Update (2024-03-19): A better approach is presented in A better jittering approach for discretization acknowledgment in density estimation
Let’s say you have a sample with tied values. If you draw a kernel density estimation (KDE) for such a sample, you may get a serrated pattern like this:
KDE requires samples from continuous distributions while tied values arise in discrete or mixture distributions. Even if the original distribution is continuous, you may observe artificial sample discretization due to the limited resolution of the measuring tool. This effect may lead to distorted density plots like in the above picture.
The problem could be solved using a nice technique called jittering. In the simplest case, jittering just adds random noise to each measurement. Such a trick removes all ties from the sample and allows building a smooth density estimation.
However, there are many different ways to apply jittering. The trickiest question here is how to choose proper noise values. In this post, I want to share one of my favorite jittering approaches. It generates a non-randomized noise pattern with a low risk of noticeable sample corruption.
The problem
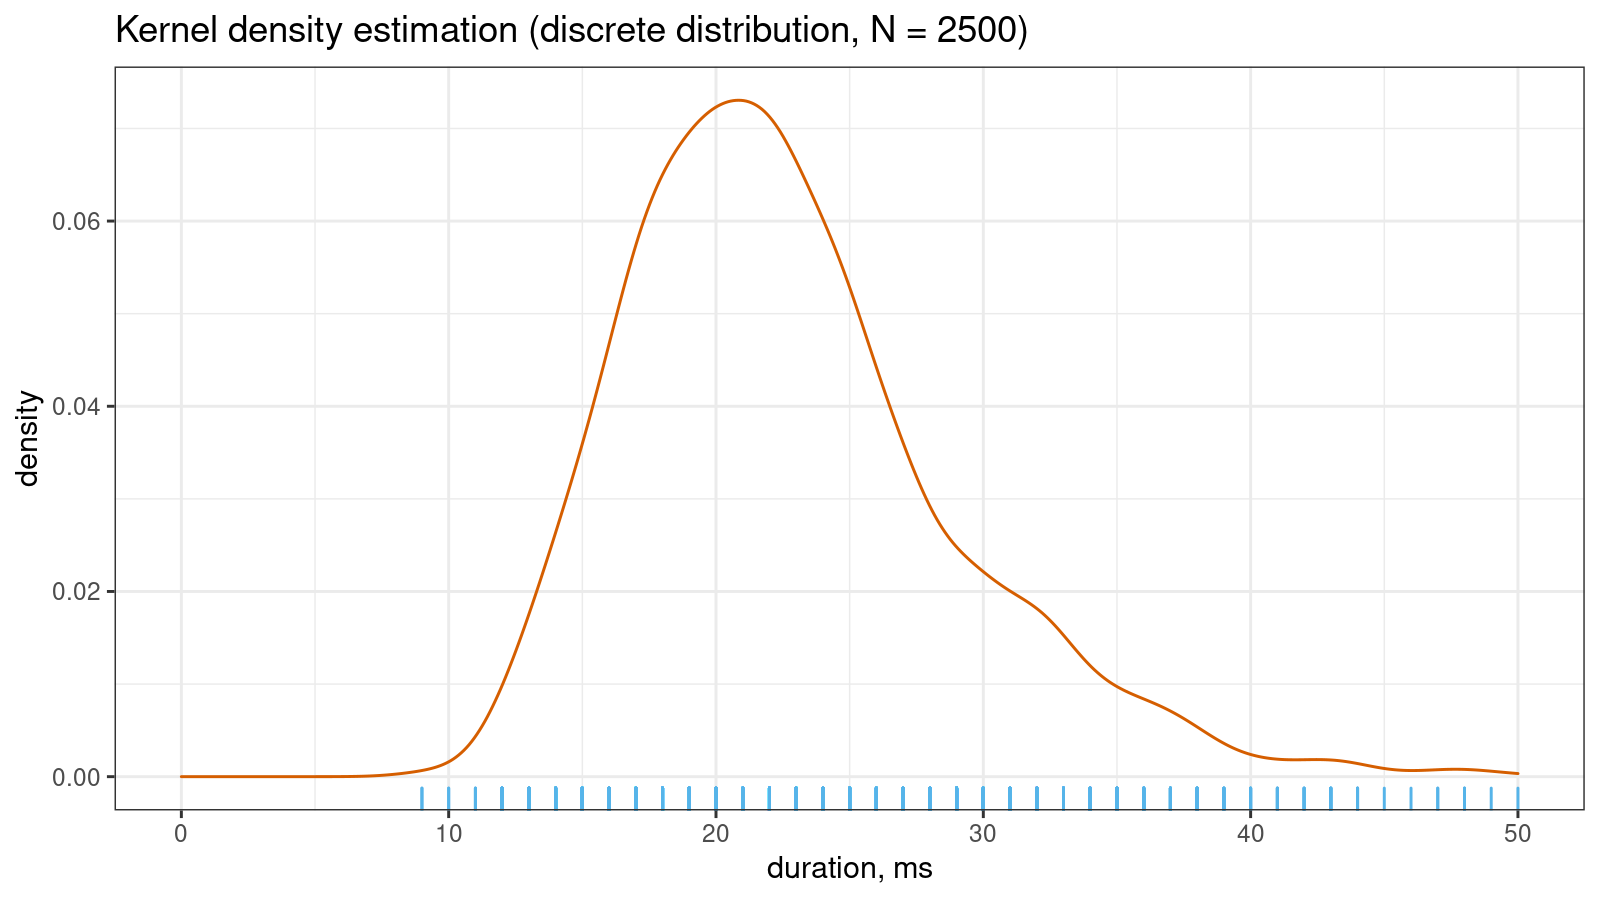
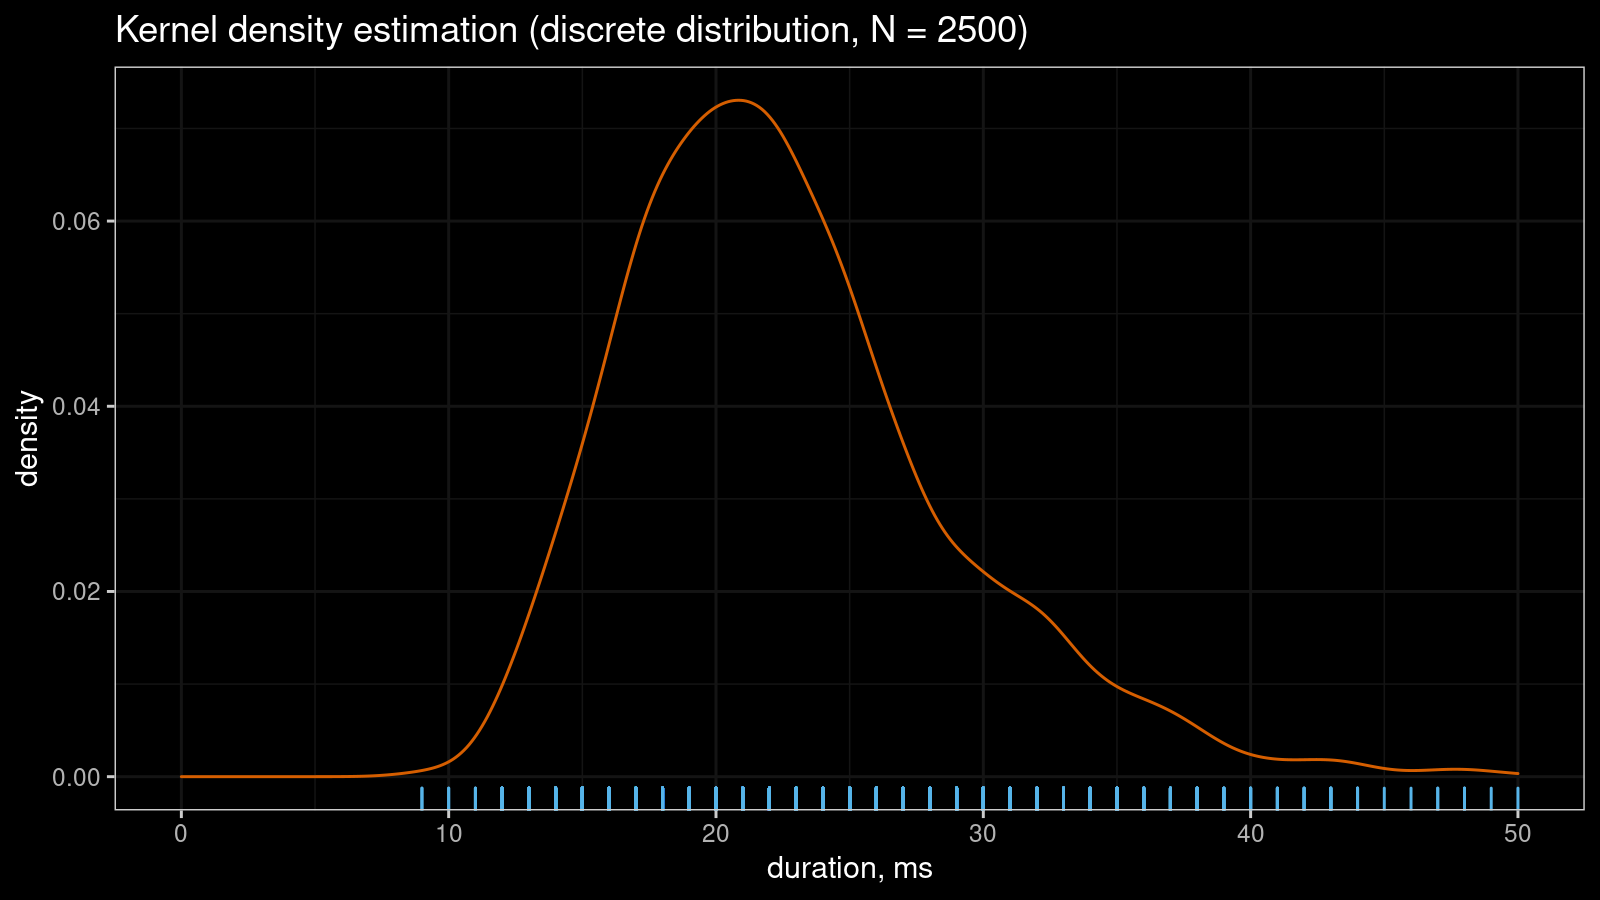
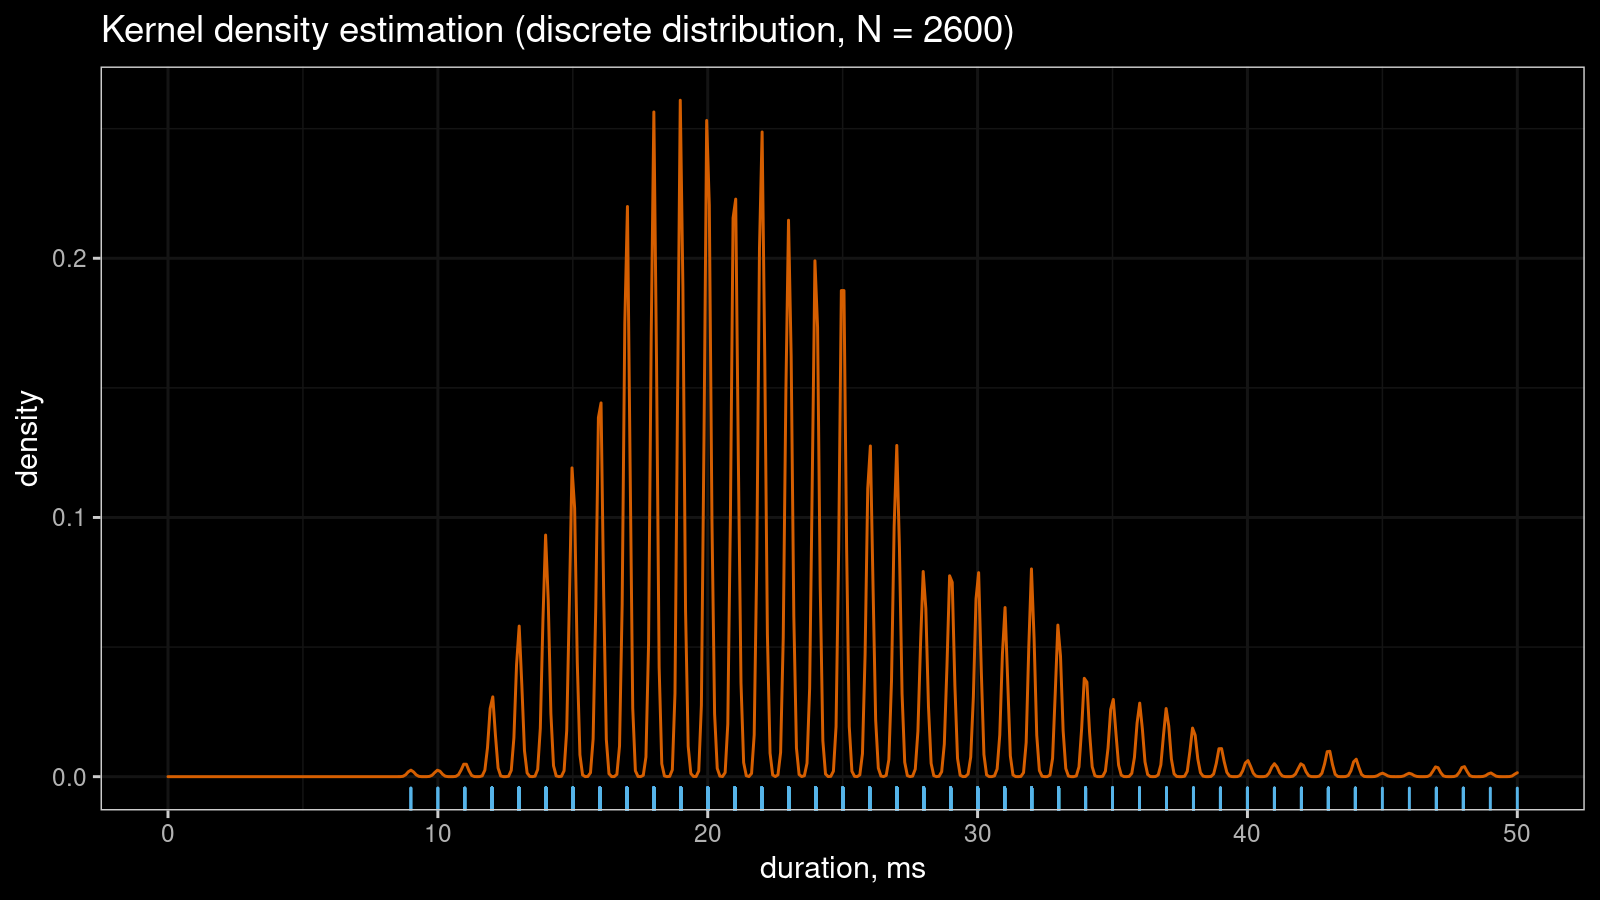
Let me show a small real-life example that illustrates the problem. Imagine you collect some duration measurements, most of which are between 0 and 100 milliseconds. You don’t need excellent accuracy, so it’s OK to round all observations to integer values. Despite the continuous nature of time, you come up with a discrete sample. If the sample size is “not-so-big,” the corresponding kernel density estimation may look pretty smooth:
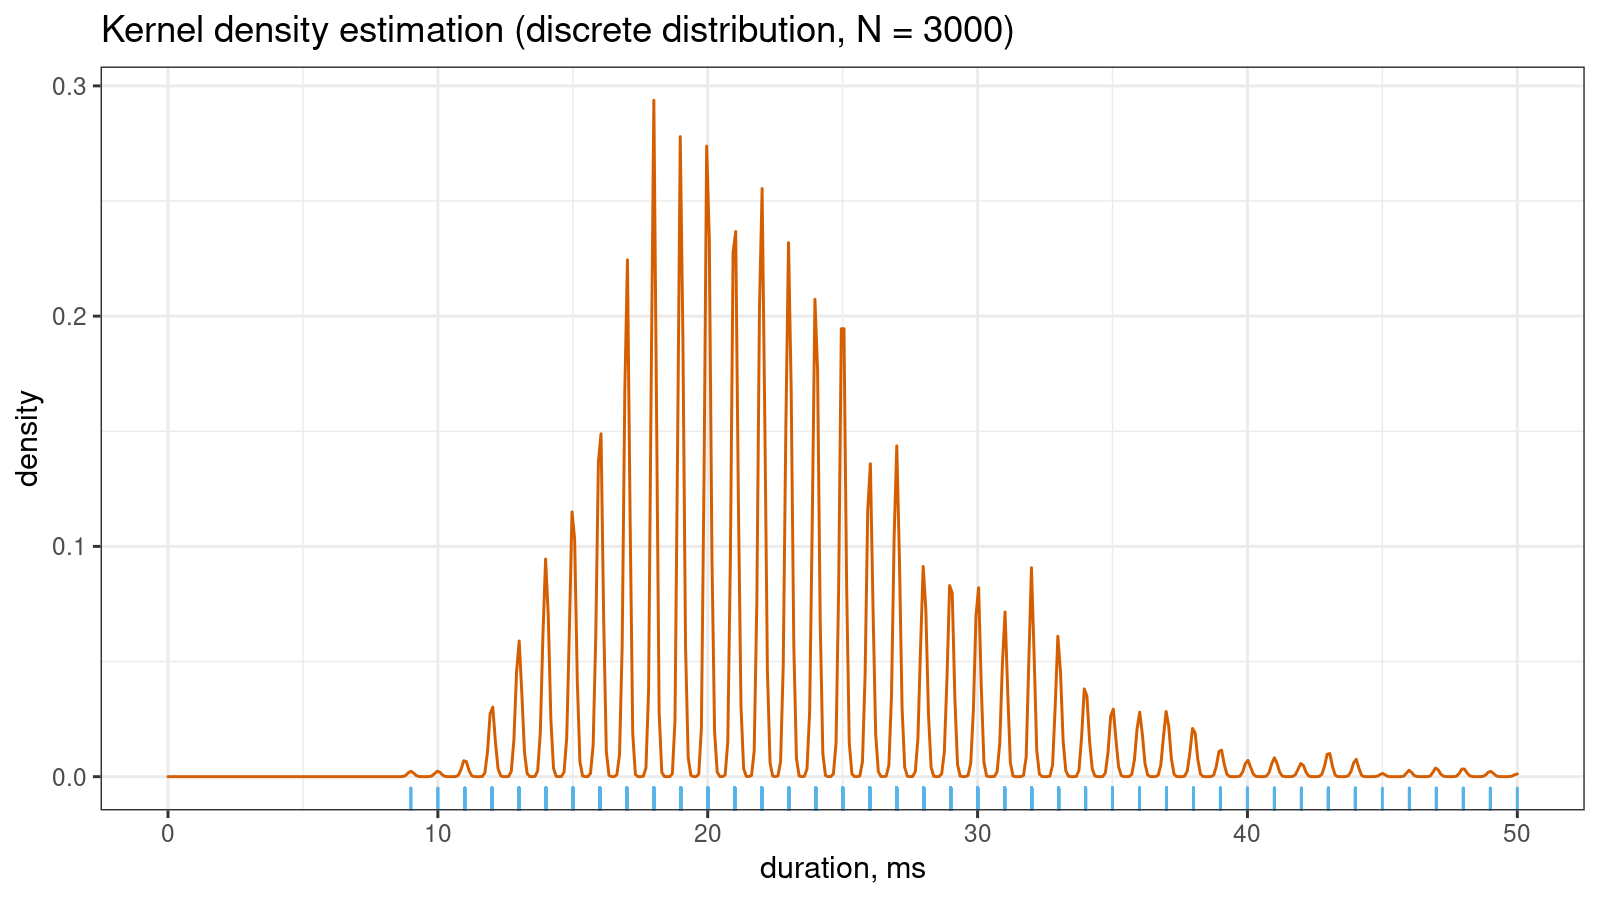
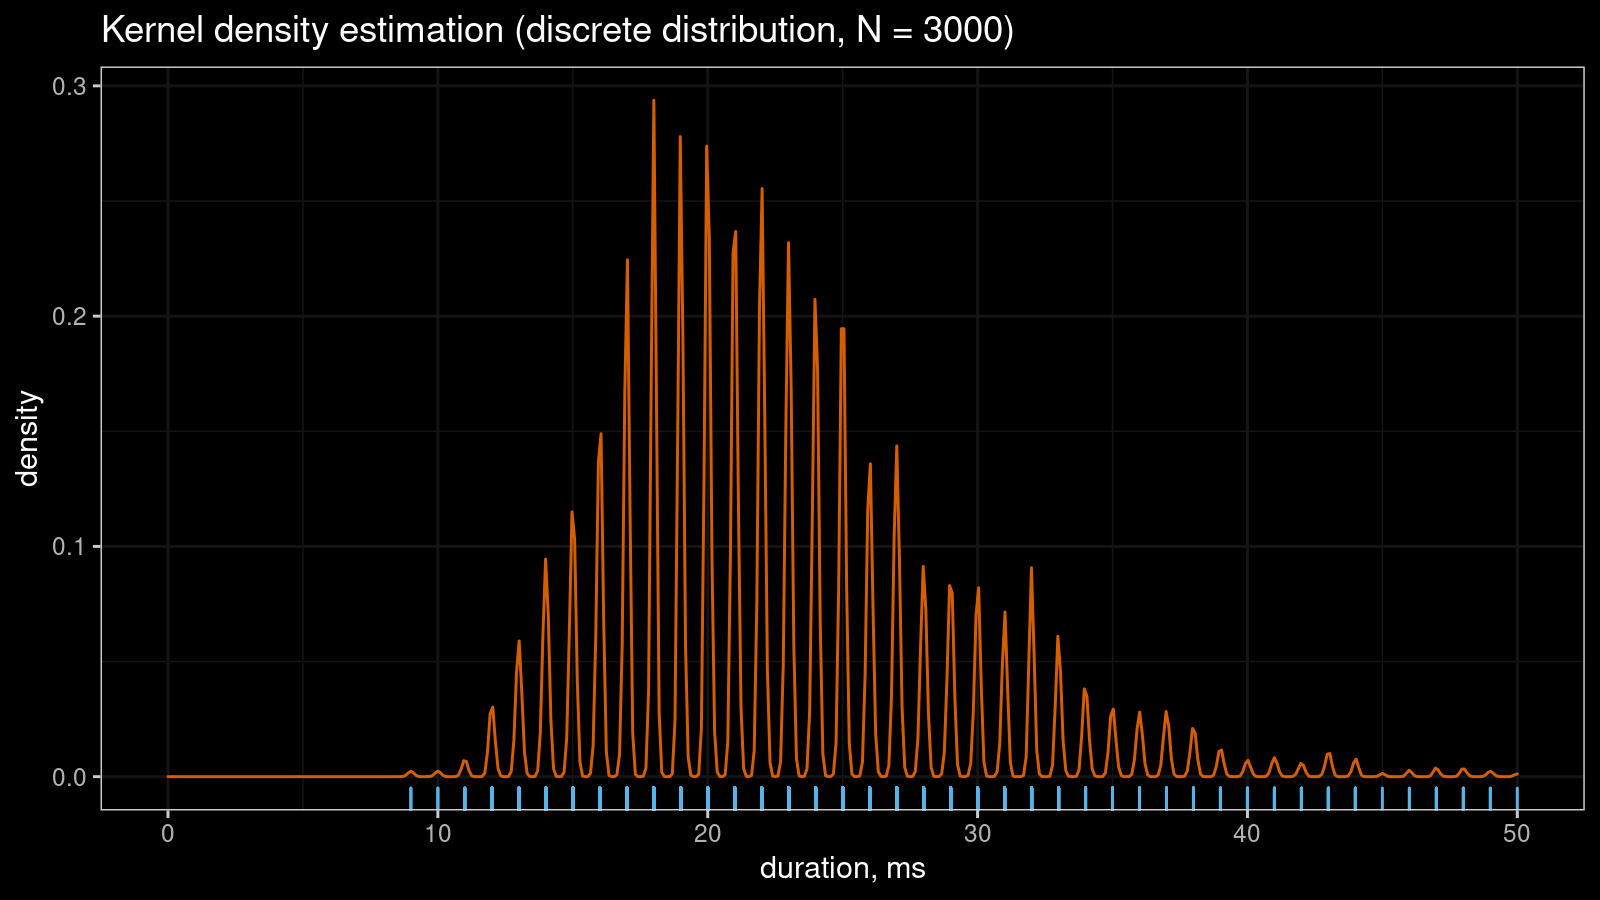
However, if you continue to collect more measurements, the KDE “will be able to guess” that the non-integer values are not allowed in this sample. Thus, the density between observed integer measurements should be zero. It gives us the serrated pattern:
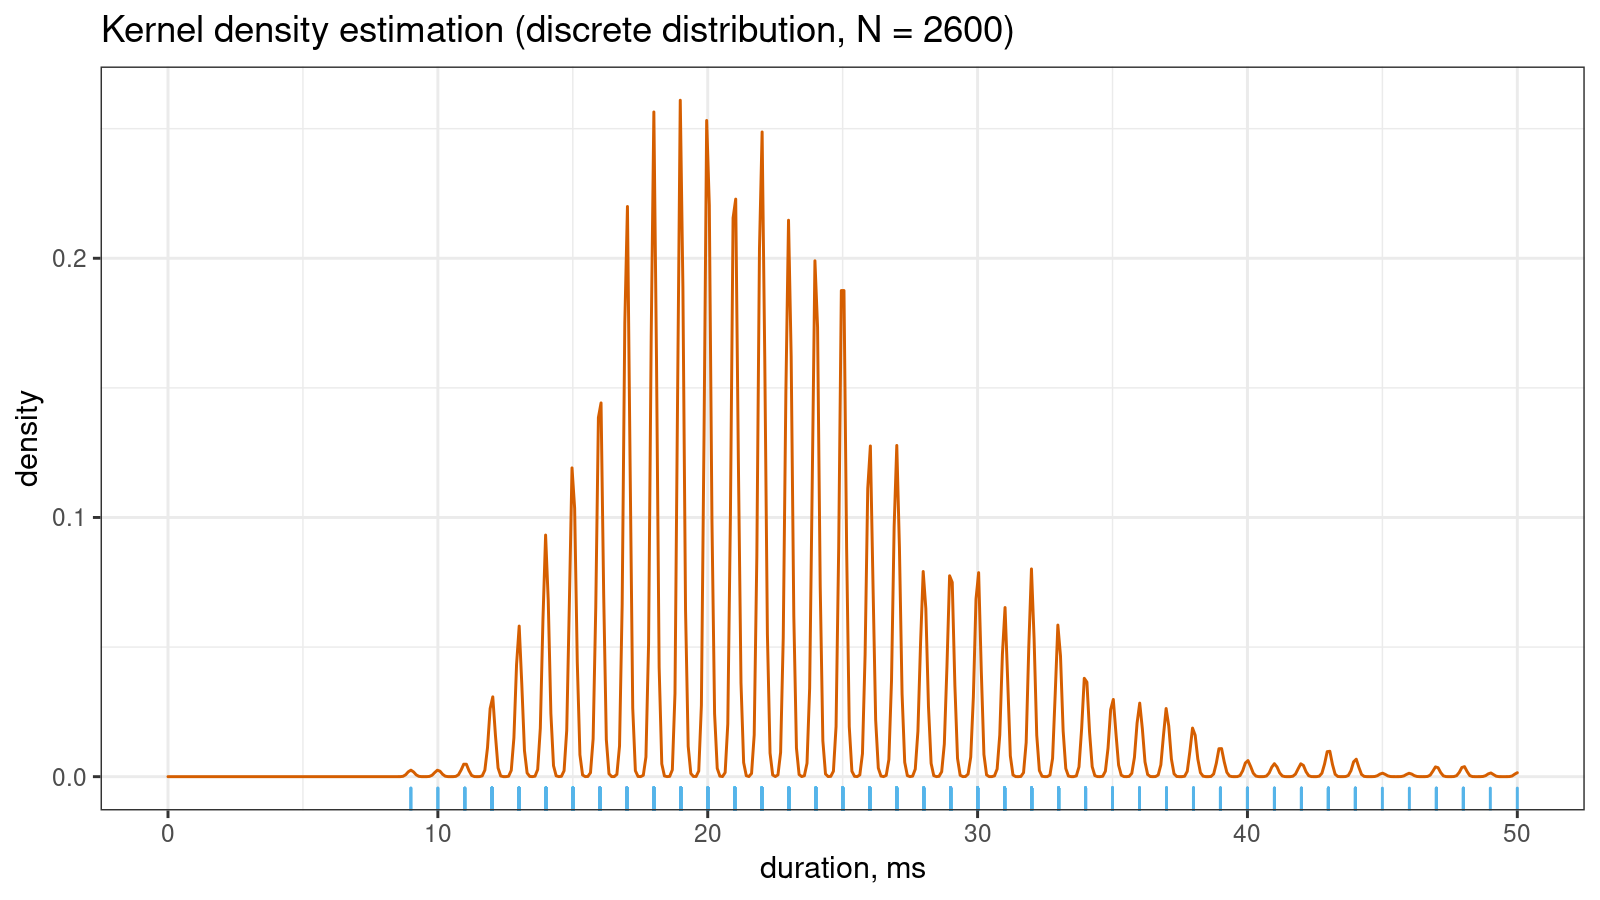
You can also find a more detailed discussion about this problem in my previous post.
Random jittering
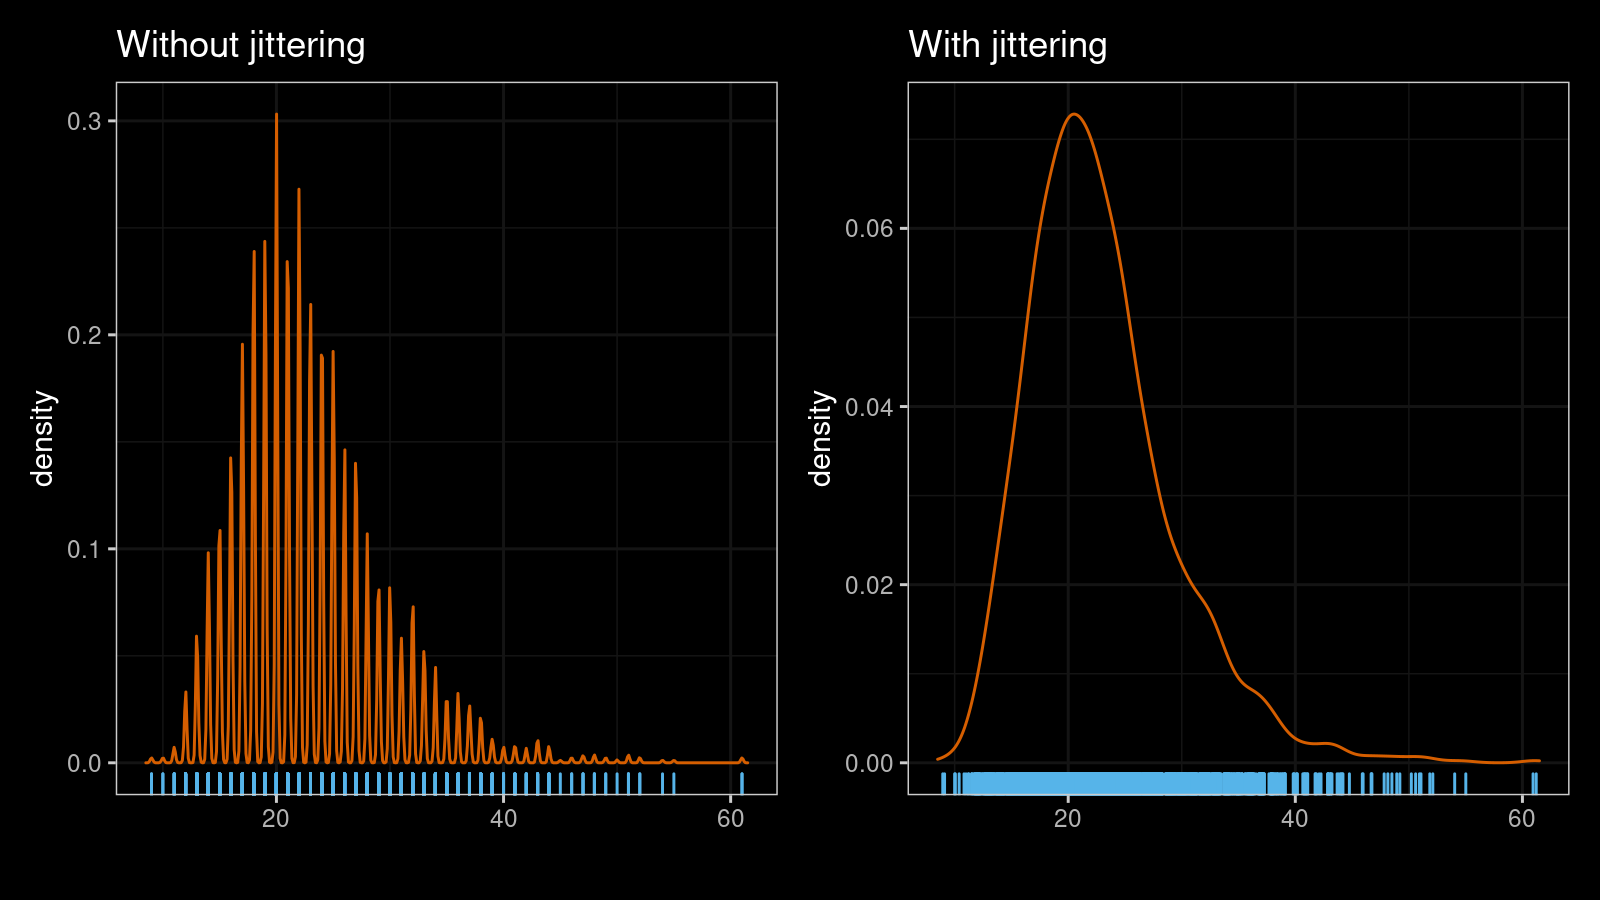
One of the easiest ways to resolve the problem is to add random noise to each sample element. In simple cases, you can use the normal distribution to generate noise values. If we apply this simple trick to the sample from the first picture, it will instantly make the KDE plot smooth:

If you are interested in a formal definition of the jittering kernel density estimator or a literature overview, it’s recommended to read nagler2018.
My noise pattern preferences
There are many different ways to introduce a noise pattern. The normal or uniform distributions may be reasonable choices for simple single-shot experiments. Note that you would need to tweak parameters for a while to get a reasonable density estimation in some cases. Jittering is always a trade-off between two states:
- The noise is too small (the serrated pattern is not fixed, jittering had no effect)
- The noise is too large (density estimation is inaccurate because the sample is corrupted)
If we want to find a proper balance between these states, we should define requirements for the noise pattern that improve our chances to get a nice density estimation. I didn’t find any bulletproof guidance on how to build a good noise distribution. So, I came up with my own list of rules that I use during jittering to form the noise pattern:
- Use stable noise pattern instead of random values
One of the main goals of the density estimation is to discover the true distribution nature based on a set of random measurements. This goal is about removing the randomness, not increasing it. Whenever it’s possible, I prefer to avoid using additional random values. It’s better to define a fixed noise pattern in advance based on the configuration of the tied values. - Modify only tied values
One may experience a temptation to add noise to each sample element. This approach is quite simple to implement because there is no need to actually detect ties. However, the primary intention of jittering is to only eliminate ties from the sample. What the point of modifying non-tied values? It would just reduce the accuracy of the final density estimation. I prefer to detect all groups of tied values and don’t touch the other values. - Maintain noise range within discretization step
It’s important to pay attention to the minimum and maximum noise values. In the case of extreme noise values (which may happen if you generate noise based on the normal distribution), one may corrupt the sample and reduce the reliability of the density estimation. It’s better to detect the discretization step and ensure that all noise values fit within a narrow band. In the simplest case, we could define the discretization step as the minimum positive difference between consequent order statistics. In more complicated cases, the discretization step could be defined adaptively based on neighbor values. - Preserve sample range
If jittering spoils the minimum and the maximum value of the sample, it may introduce problems. Let’s say we work with the rectified Gaussian distribution. In this case, we probably have a lot of tied values that equal exactly zero. If we add negative noise to some of the tied values, we will get negative sample values. It will be a violation of the sample invariant for the rectified Gaussian distribution. To avoid such a situation, it’s better to preserve the minimum and the maximum value. - Ensure high density near the original value
Without jittering, the density estimation should probably use the Dirac delta function to express tied values. With a smoother approximation, it should look like a sharp peak. Sometimes, this peak is explained not by artificial discretization but by other distribution features. For the rectified Gaussian distribution, the location of this peak is exactly zero. If we add non-negative random noise to the tied zero values, in this case, we may introduce a bias for this peak. For example, the biased peak location may become 0.2 instead of 0.0, which distorts the density shape. Whenever it’s possible, I prefer preserving the peak location.
Now let me show an example of such noise patterns that satisfy all of the above requirements.
Noise pattern example
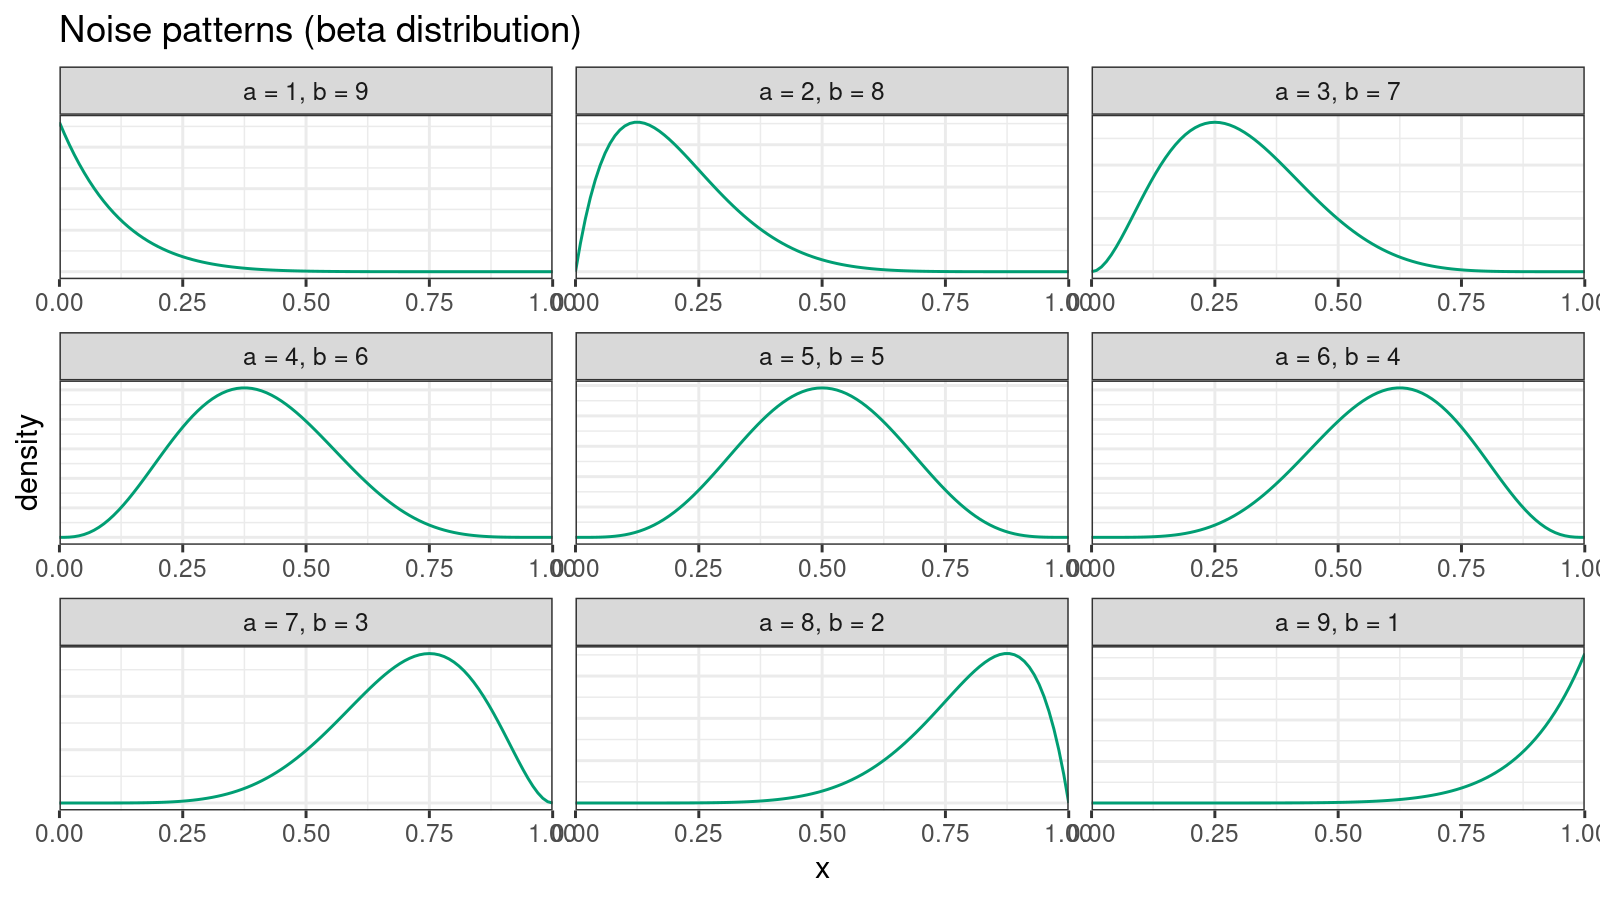
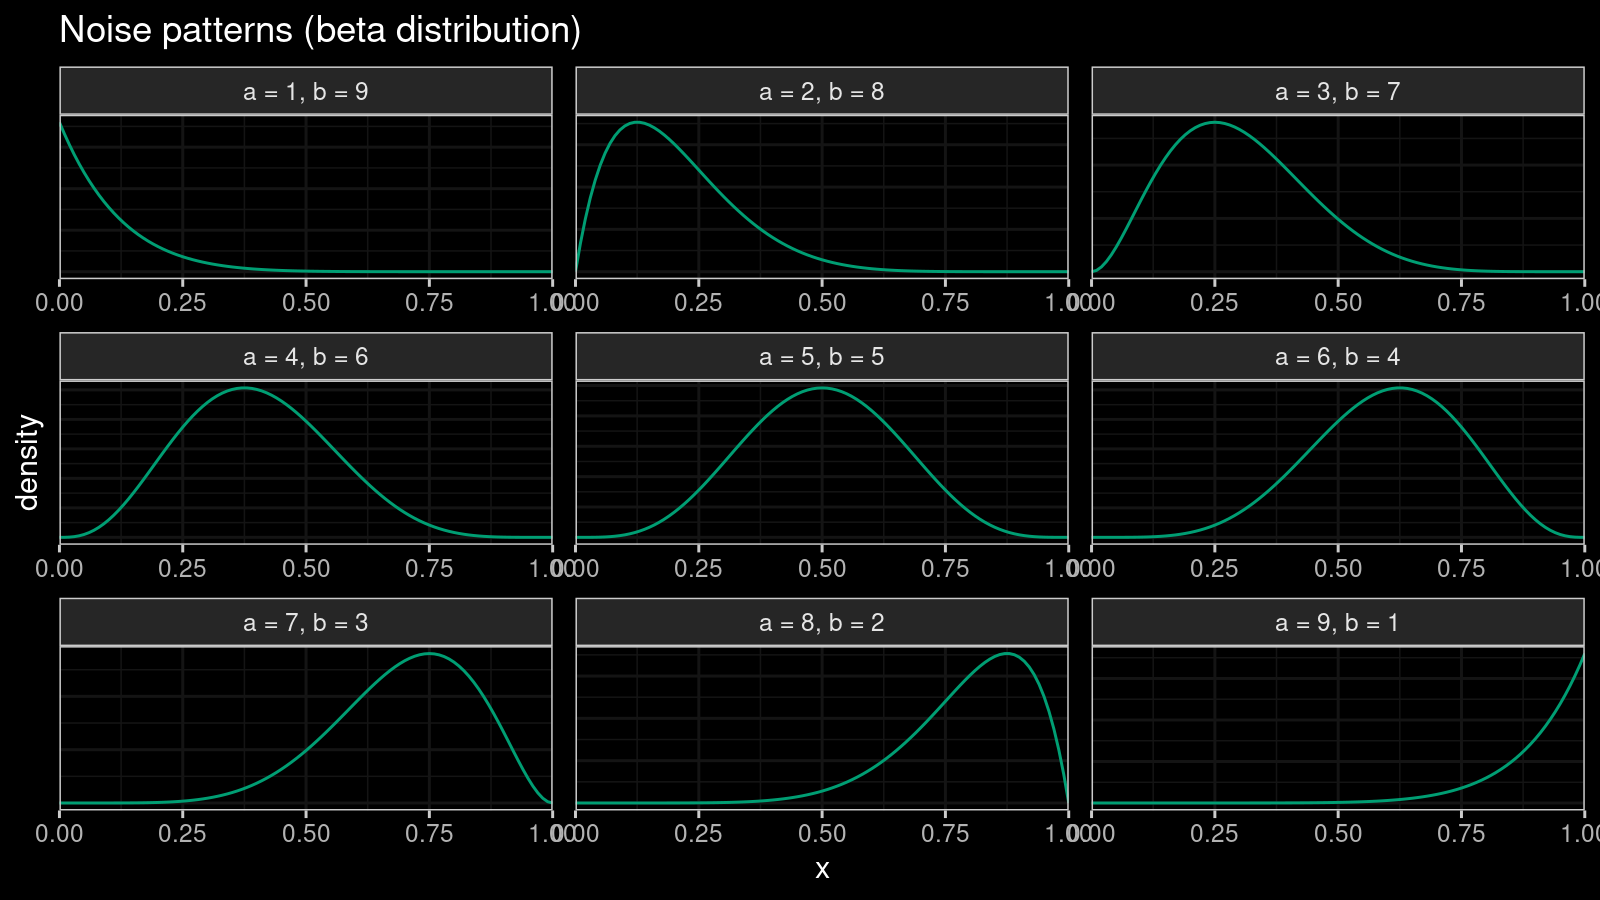
We are going to introduce an independent noise pattern for each group of tied values. Let’s say our sample contains $k$ tied values that equal $x^*$. Let $l$ be the number of sample values lower than $x^*$, and $r$ be the number of sample values higher than $x^*$. For the given $l$ and $r$, we could define a beta distribution $\textrm{Beta}(\alpha, \beta)$ with the following $\alpha$ and $\beta$:
$$ \alpha = \frac{9l+r}{l+r}, \quad \beta = \frac{l+9r}{l+r}. $$This distribution satisfy the following properties:
- $\alpha + \beta = 10$
- The mode of this distribution is always $l / (l + r)$.
Here are examples of the corresponding density plots:
Now let’s define $k$ uniformly distributed numbers $p_i$ on $[0;1]$:
$$ p_i = i / (k + 1), \quad i = 1, \ldots, k. $$Let $p_0$ be equal to $p_i$ that is nearest to the mode value $l / (l + r)$. If $Q(p)$ is the quantile function of $\textrm{Beta}(\alpha, \beta)$, we could introduce the following noise vector:
$$ \xi_i = Q(p_i) - Q(p_0), \quad i = 1, \ldots, k. $$Now we could rescale the noise vector according to the discretization step and define jittered values $\hat{x}_i$:
$$ \hat{x}_i = x^* + s \cdot \xi_i $$where $s$ is the scale constant. Based on my local experiments, I assume that $s = 1.5$ is usually enough to get a smooth approximation.
The above equation may look confusing, but it satisfies the requirements from the previous section. Let me show a few examples (for this table, $s = 1.0$):
| $k$ | $l$ | $r$ | $\xi_i$ |
|---|---|---|---|
| $1$ | $1$ | $1$ | $\{ 0.000 \} $ |
| $3$ | $1$ | $1$ | $\{ -0.108,\; 0.000,\; 0.108 \} $ |
| $5$ | $1$ | $1$ | $\{ -0.153,\; -0.069,\; 0.000,\; 0.069,\; 0.153 \} $ |
| $4$ | $5$ | $0$ | $\{-0.139,\; -0.072,\; -0.031,\; 0.000 \} $ |
| $4$ | $0$ | $5$ | $\{0.000,\; 0.031,\; 0.072,\; 0.139 \} $ |
Thus, the suggested approach preserves the sample range, provides a small bias, and returns consistent non-randomized values. In addition, one of the noise vector components is always zero (which is a lovely property for manual sample exploration). The noise range can be controlled via the scale constant $s$.
Let’s look at a few examples. Here are two kernel density estimations (normal kernel, Sheather & Jones bandwidth selector) for a sample of size 1000 from the binomial distribution $\textrm{B}(n = 30, p = 0.2)$ without and with jittering ($s = 1.5$):
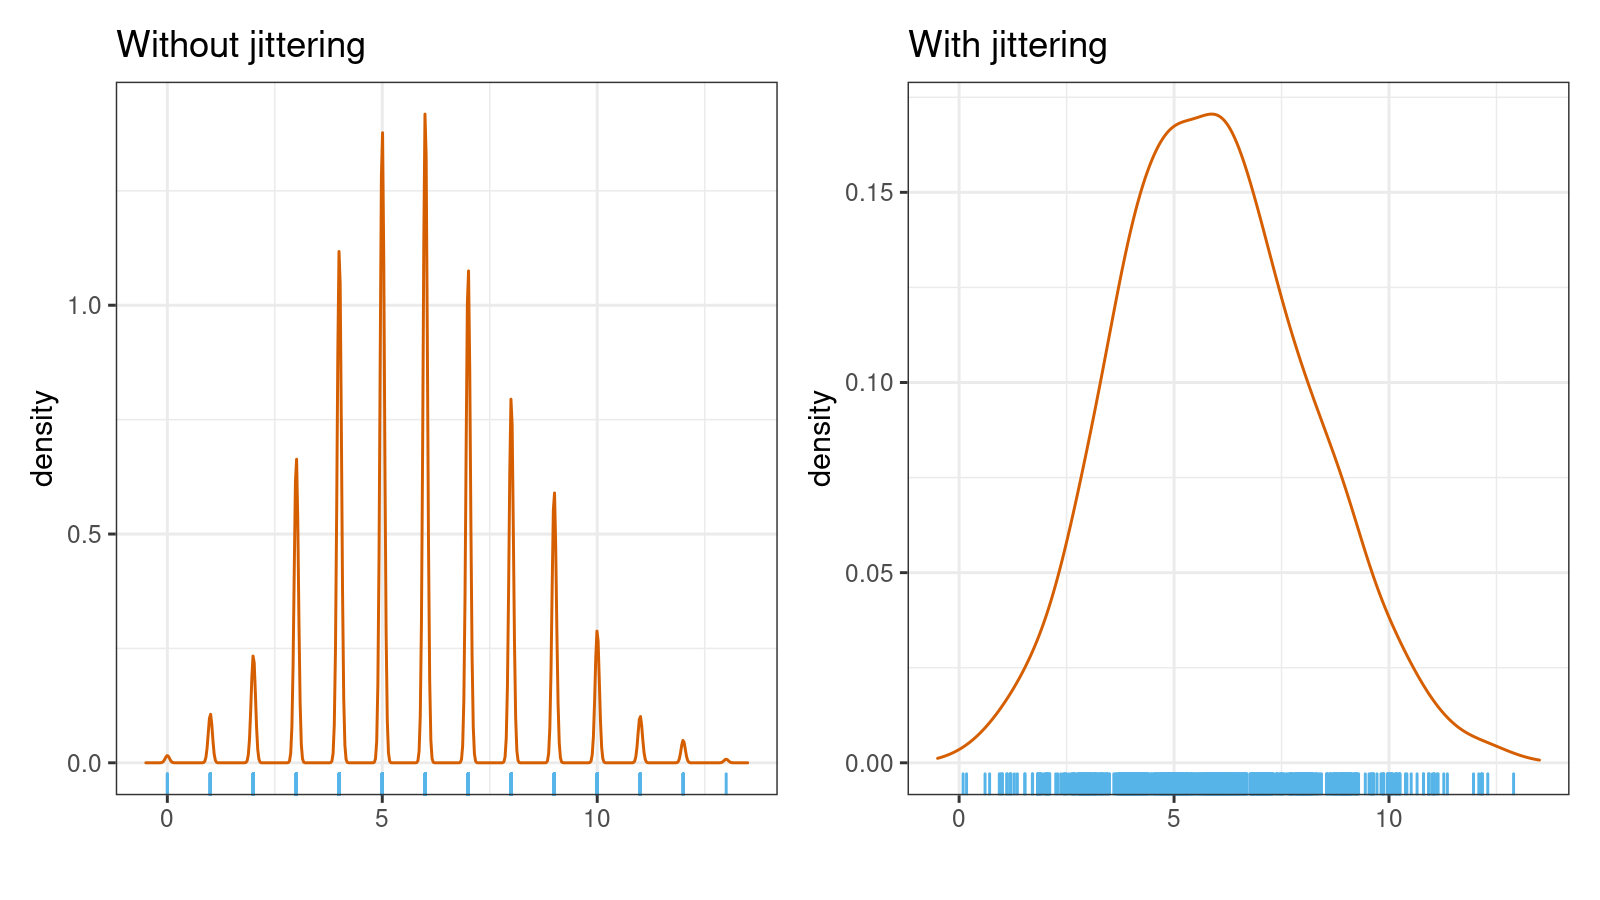
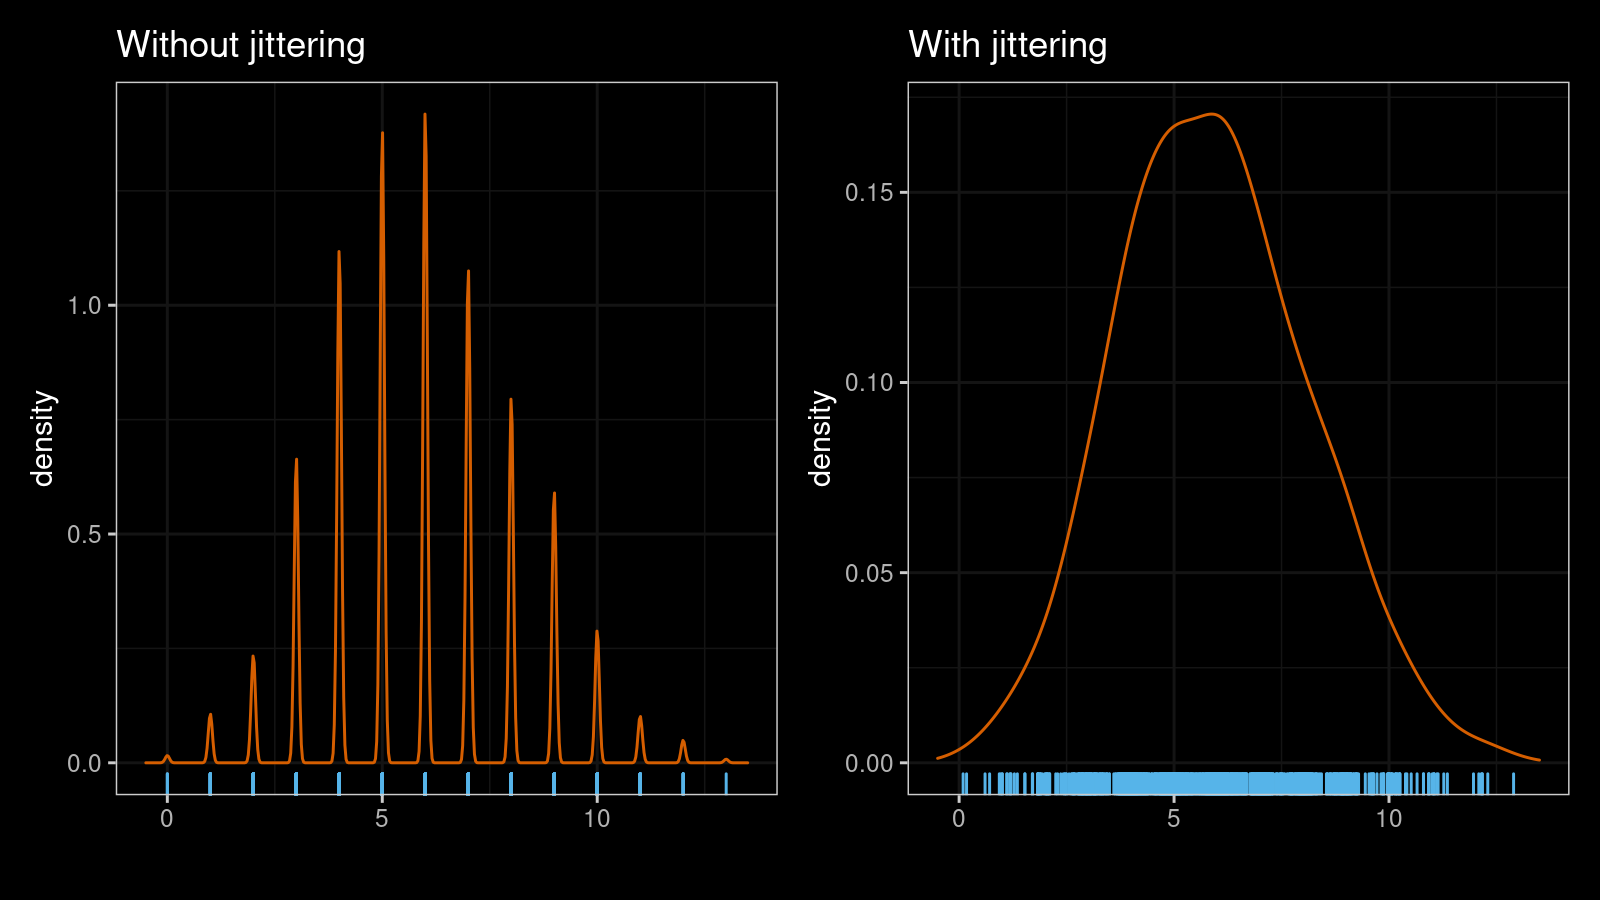
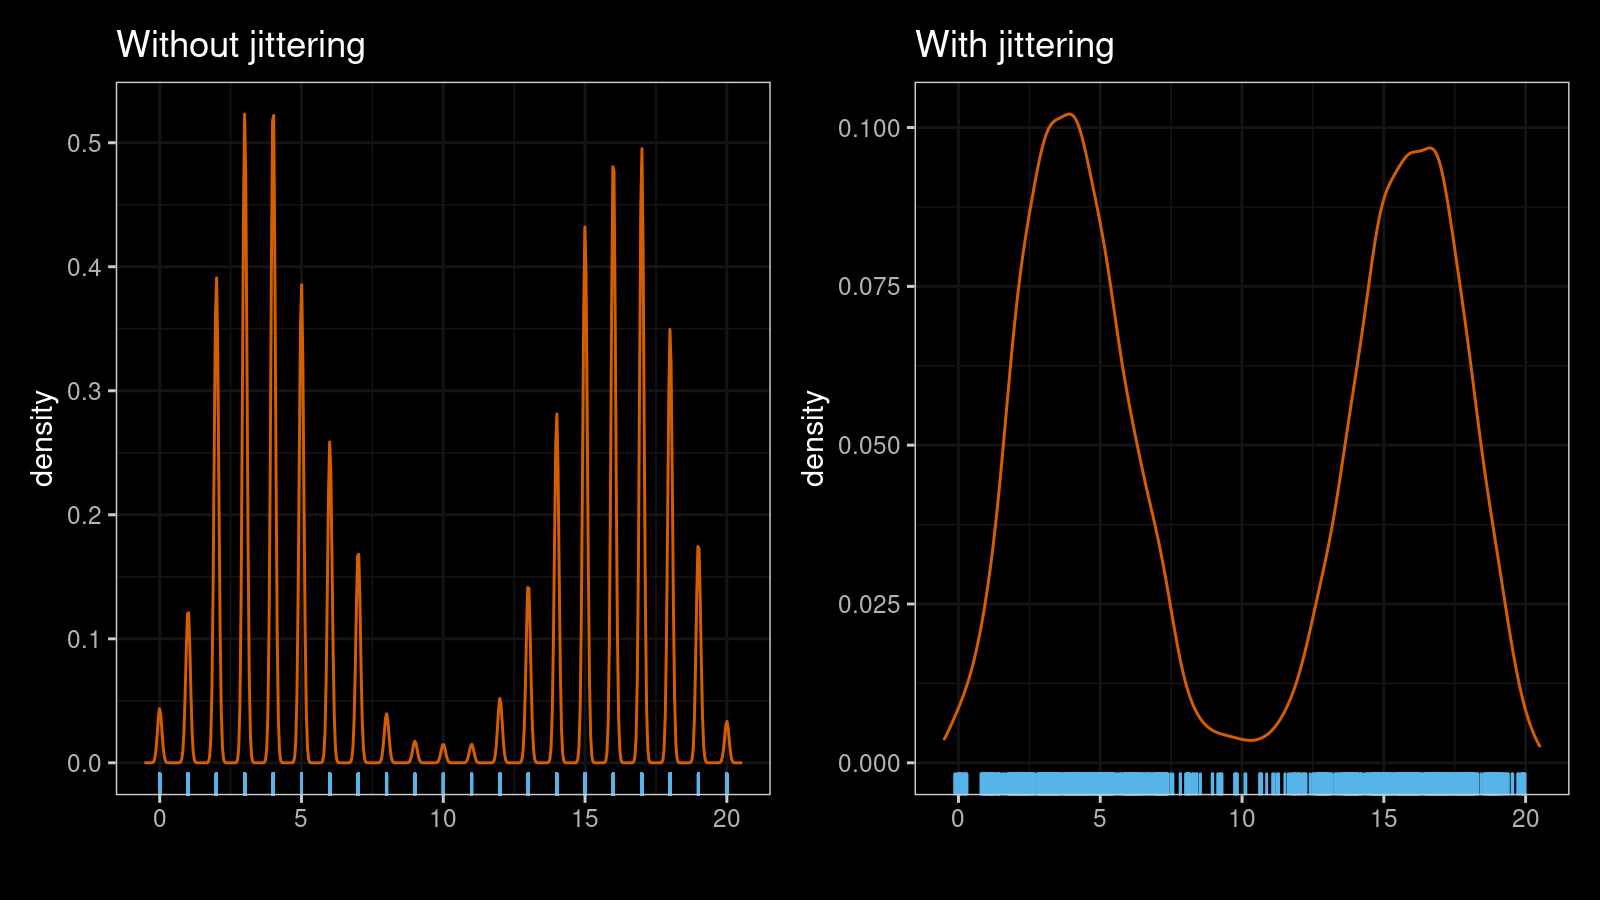
As you can see, the jittered version is much smoother. The suggested approach works nicely with multimodal distribution as well. Here are another two KDEs for a mixture of a sample of size 1000 from $\textrm{B}(n = 20, p = 0.2)$ and a sample of size 1000 from $\textrm{B}(n = 20, p = 0.8)$:

Conclusion
Jittering is an excellent technique that allows getting smooth density estimations for discrete samples. In this post, I described an example of a non-randomized noise pattern with a low risk of noticeable sample corruption.