Finite-sample bias correction factors for Rousseeuw-Croux scale estimators
The Rousseeuw-Croux scale estimators $S_n$ and $Q_n$ are efficient alternatives to the median absolute deviation ($\operatorname{MAD}_n$). While all three estimators have the same breakdown point of $50\%$, $S_n$ and $Q_n$ have higher statistical efficiency than $\operatorname{MAD}_n$. The asymptotic Gaussian efficiency values of $\operatorname{MAD}_n$, $S_n$, and $Q_n$ are $37\%$, $58\%$, and $82\%$ respectively.
Using scale constants, we can make $S_n$ and $Q_n$ consistent estimators for the standard deviation under normality. The asymptotic values of these constants are well-known. However, for finite-samples, only approximated scale constants are known. In this post, we provide refined values of these constants with higher accuracy.
Read morePreprint announcement: 'Quantile absolute deviation'
I have just published a preprint of a paper ‘Quantile absolute deviation’. It’s based on a series of my research notes that I have been writing since December 2020.
The paper preprint is available on arXiv: arXiv:2208.13459 [stat.ME]. The paper source code is available on GitHub: AndreyAkinshin/paper-qad. You can cite it as follows:
- Andrey Akinshin (2022) “Quantile absolute deviation” arXiv:2208.13459
Abstract:
Read moreThe median absolute deviation (MAD) is a popular robust measure of statistical dispersion. However, when it is applied to non-parametric distributions (especially multimodal, discrete, or heavy-tailed), lots of statistical inference issues arise. Even when it is applied to distributions with slight deviations from normality and these issues are not actual, the Gaussian efficiency of the MAD is only 37% which is not always enough.
In this paper, we introduce the quantile absolute deviation (QAD) as a generalization of the MAD. This measure of dispersion provides a flexible approach to analyzing properties of non-parametric distributions. It also allows controlling the trade-off between robustness and statistical efficiency. We use the trimmed Harrell-Davis median estimator based on the highest density interval of the given width as a complimentary median estimator that gives increased finite-sample Gaussian efficiency compared to the sample median and a breakdown point matched to the QAD.
As a rule of thumb, we suggest using two new measures of dispersion called the standard QAD and the optimal QAD. They give 54% and 65% of Gaussian efficiency having breakdown points of 32% and 14% respectively.
Standard trimmed Harrell-Davis median estimator
In one of the previous posts, I suggested a new measure of dispersion called the standard quantile absolute deviation around the median ($\operatorname{SQAD}$) which can be used as an alternative to the median absolute deviation ($\operatorname{MAD}$) as a consistent estimator for the standard deviation under normality. The Gaussian efficiency of $\operatorname{SQAD}$ is $54\%$ (comparing to $37\%$ for MAD), and its breakdown point is $32\%$ (comparing to $50\%$ for MAD). $\operatorname{SQAD}$ is a symmetric dispersion measure around the median: the interval $[\operatorname{Median} - \operatorname{SQAD}; \operatorname{Median} + \operatorname{SQAD}]$ covers $68\%$ of the distribution. In the case of the normal distribution, this corresponds to the interval $[\mu - \sigma; \mu + \sigma]$.
If we use $\operatorname{SQAD}$, we accept the breakdown point of $32\%$. This makes the sample median a non-optimal choice for the median estimator. Indeed, the sample median has high robustness (the breakdown point is $50\%$), but relatively poor Gaussian efficiency. If we use $\operatorname{SQAD}$, it doesn’t make sense to require a breakdown point of more than $32\%$. Therefore, we could trade the median robustness for efficiency and come up with a complementary measure of the median for $\operatorname{SQAD}$.
In this post, we introduce the standard trimmed Harrell-Davis median estimator which shares the breakdown point with $\operatorname{SQAD}$ and provides better finite-sample efficiency comparing to the sample median.
Read moreOptimal quantile absolute deviation
We consider the quantile absolute deviation around the median defined as follows:
$$ \newcommand{\E}{\mathbb{E}} \newcommand{\PR}{\mathbb{P}} \newcommand{\Q}{\operatorname{Q}} \newcommand{\OQAD}{\operatorname{OQAD}} \newcommand{\QAD}{\operatorname{QAD}} \newcommand{\median}{\operatorname{median}} \newcommand{\Exp}{\operatorname{Exp}} \newcommand{\SD}{\operatorname{SD}} \newcommand{\V}{\mathbb{V}} \QAD(X, p) = K_p \Q(|X - \median(X)|, p), $$where $\Q$ is a quantile estimator, and $K_p$ is a scale constant which we use to make $\QAD(X, p)$ an asymptotically consistent estimator for the standard deviation under the normal distribution.
In this post, we get the exact values of the $K_p$ values, derive the corresponding equation for the asymptotic Gaussian efficiency of $\QAD(X, p)$, and find the point in which $\QAD(X, p)$ achieves the highest Gaussian efficiency.
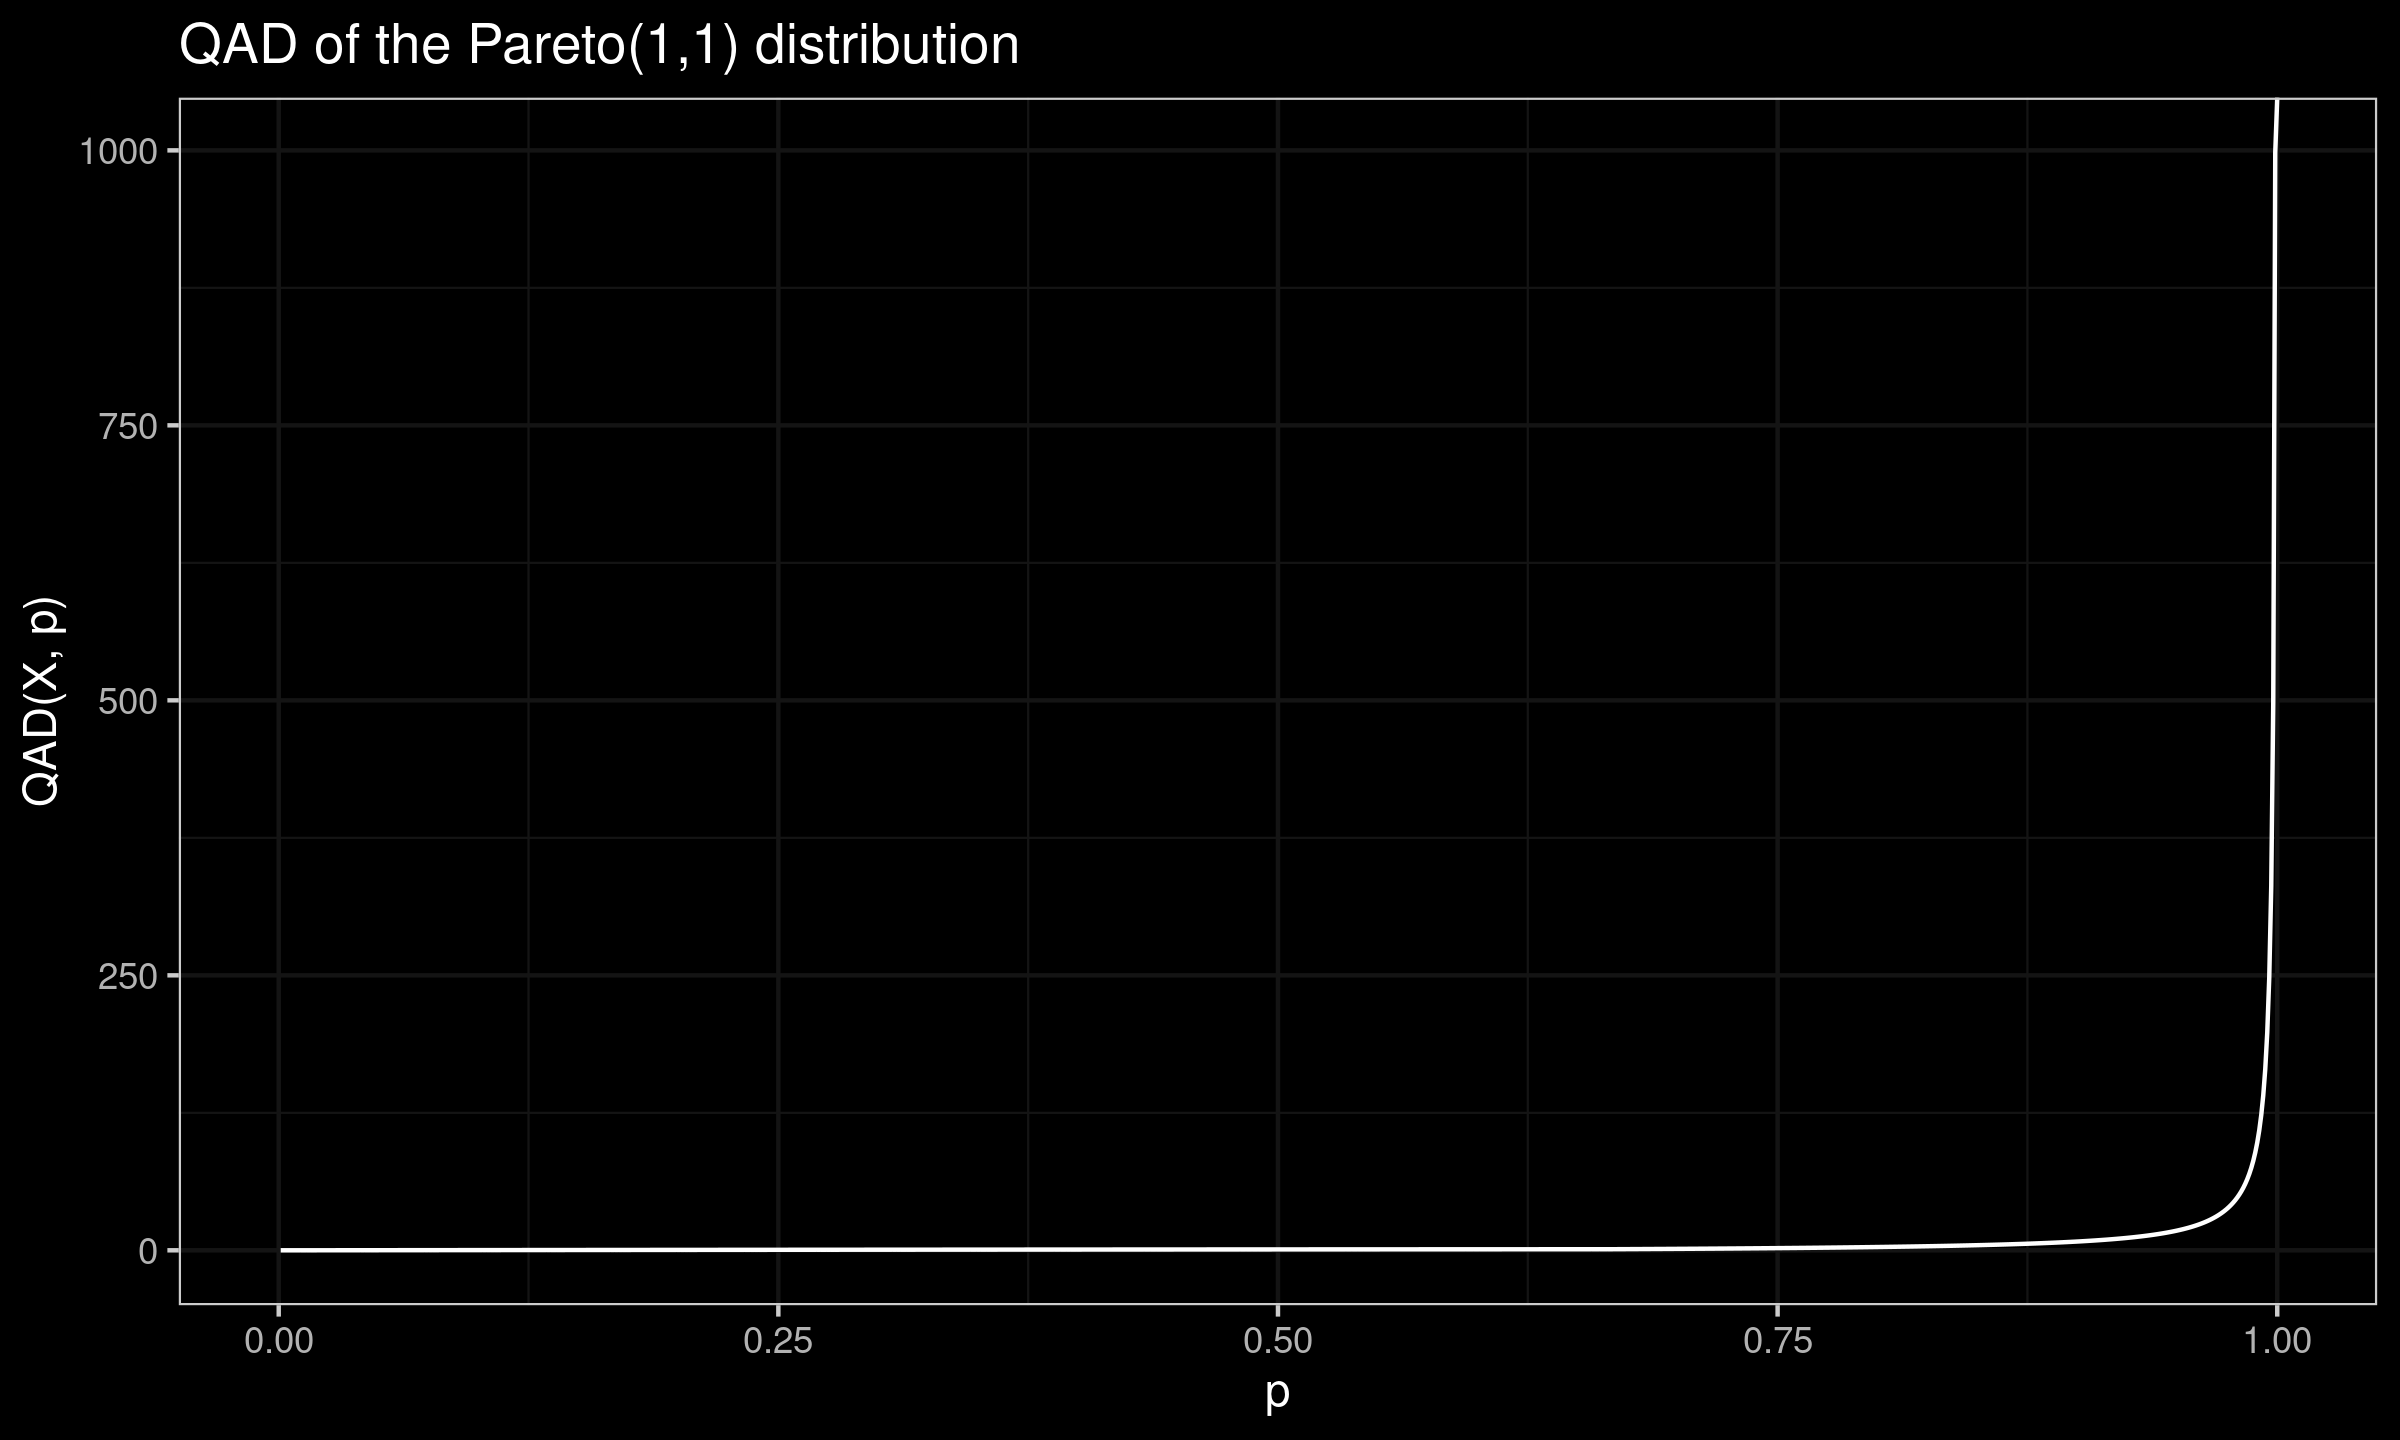
Read moreQuantile absolute deviation of the Pareto distribution
In this post, we derive the exact equation for the quantile absolute deviation around the median of the Pareto(1,1) distribution.

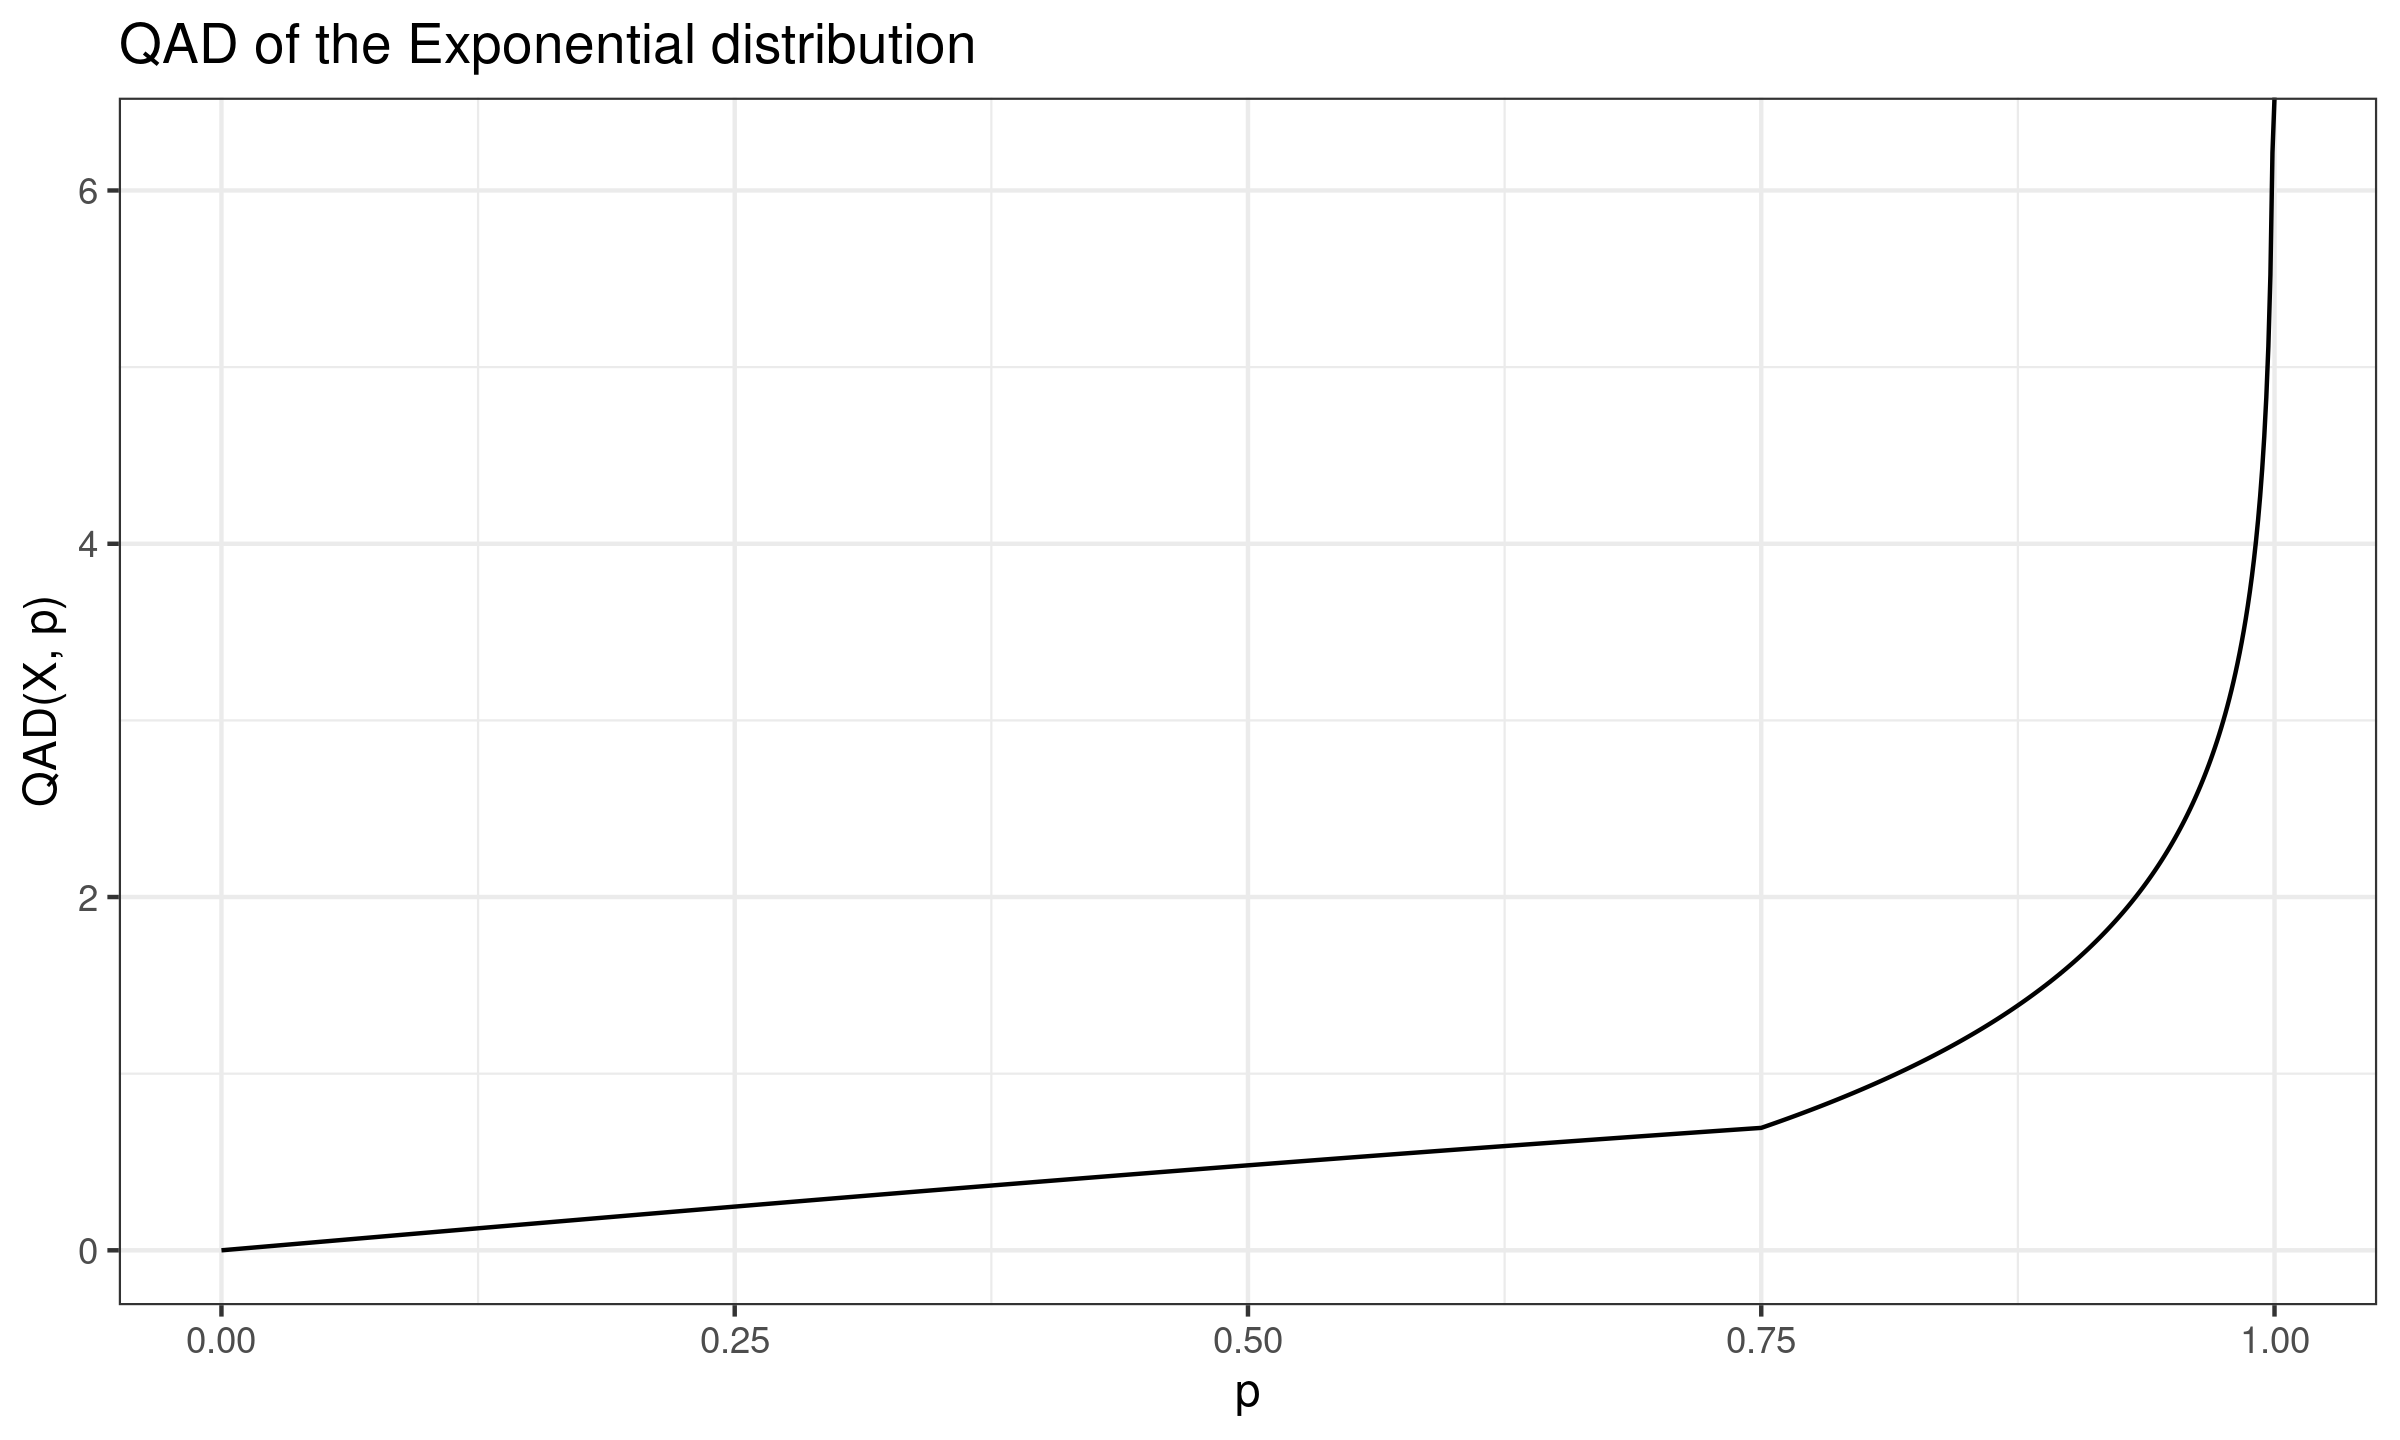
Quantile absolute deviation of the Exponential distribution
In this post, we derive the exact equation for the quantile absolute deviation around the median of the Exponential distribution.

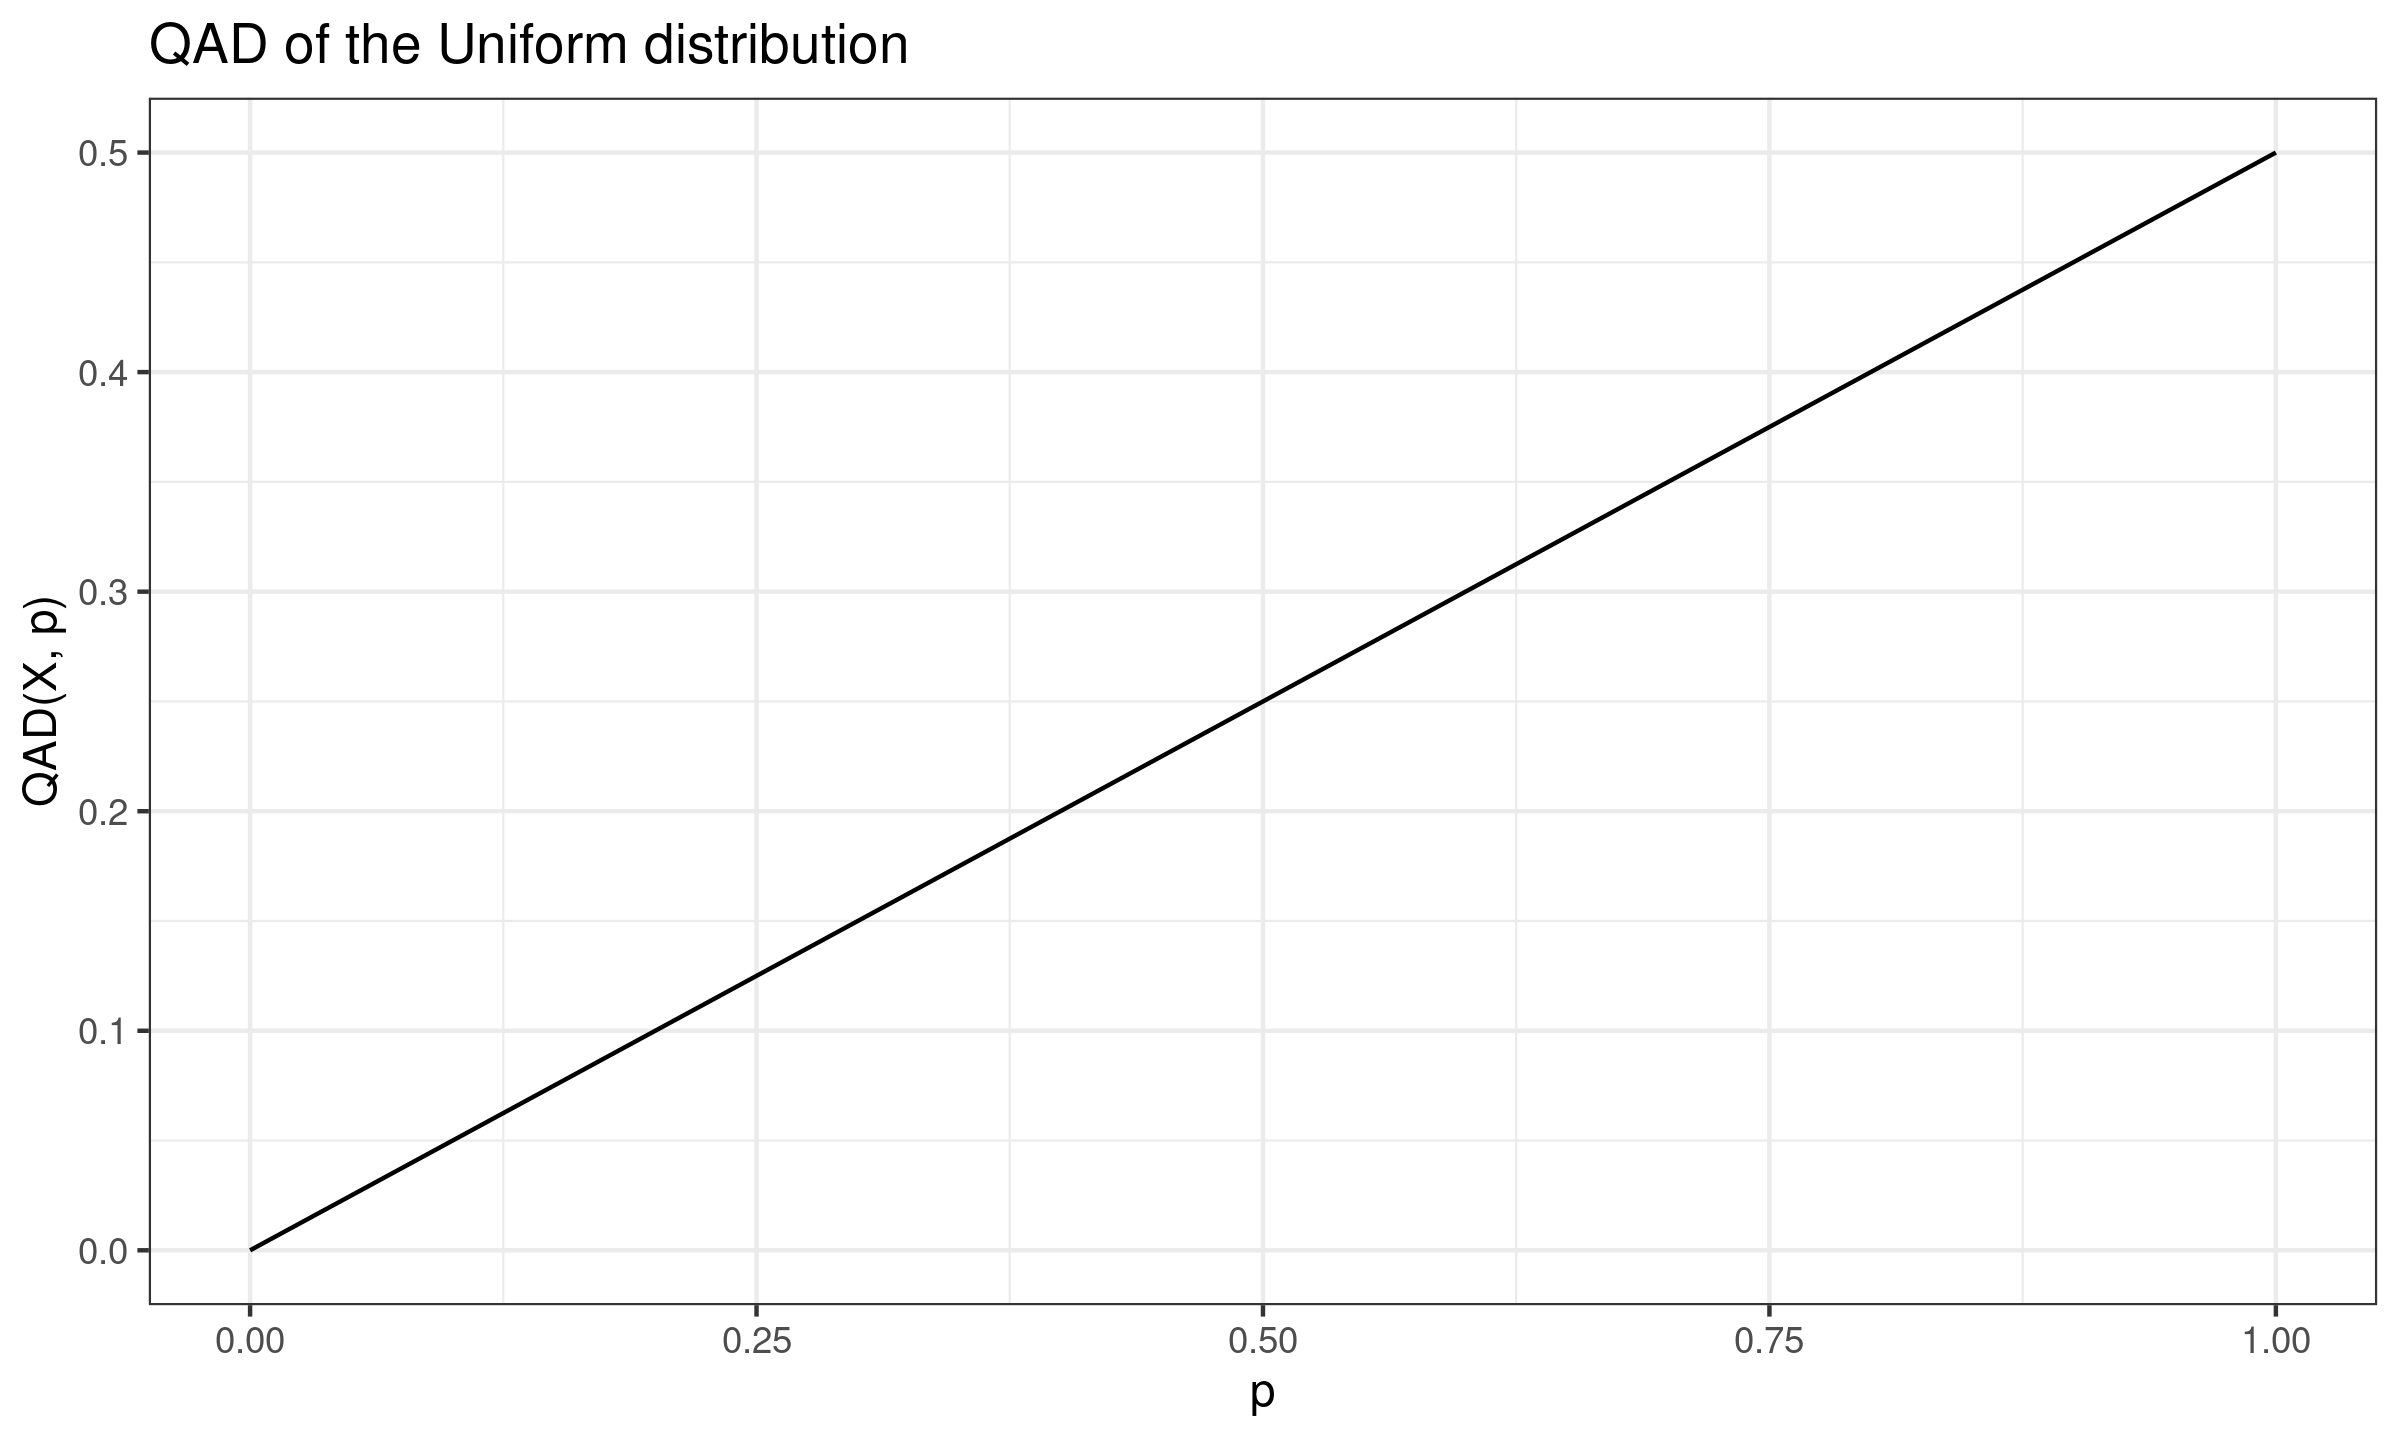
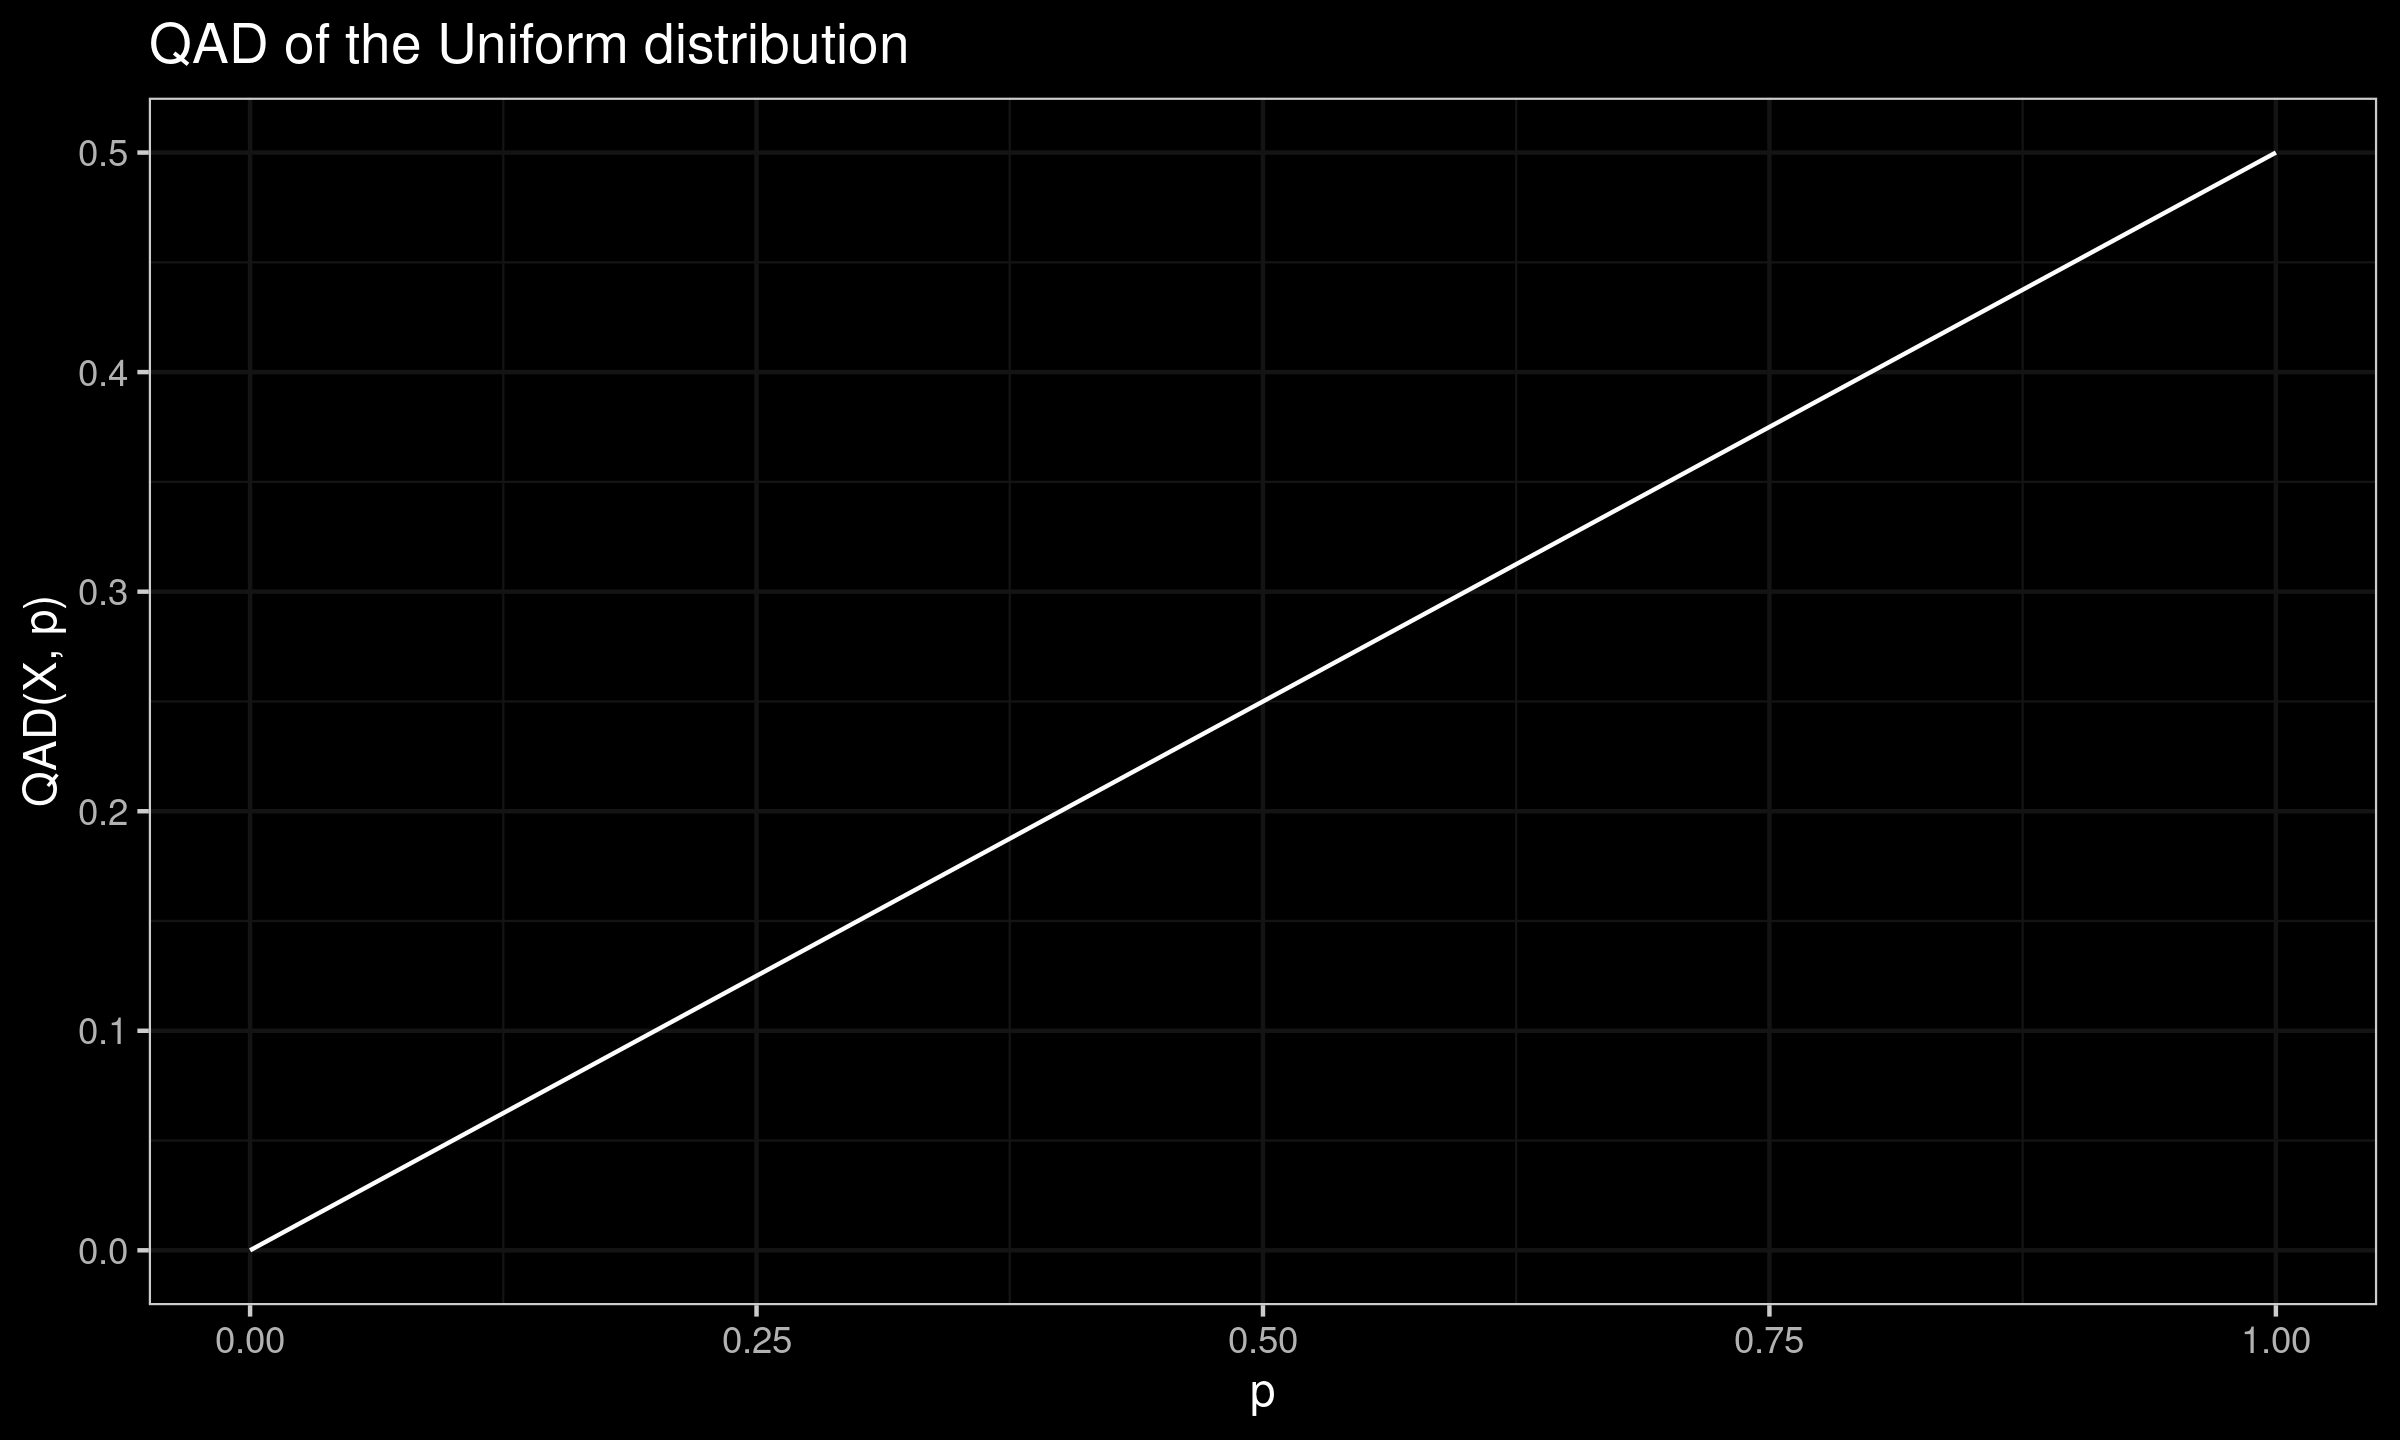
Quantile absolute deviation of the Uniform distribution
In this post, we derive the exact equation for the quantile absolute deviation around the median of the Uniform distribution.
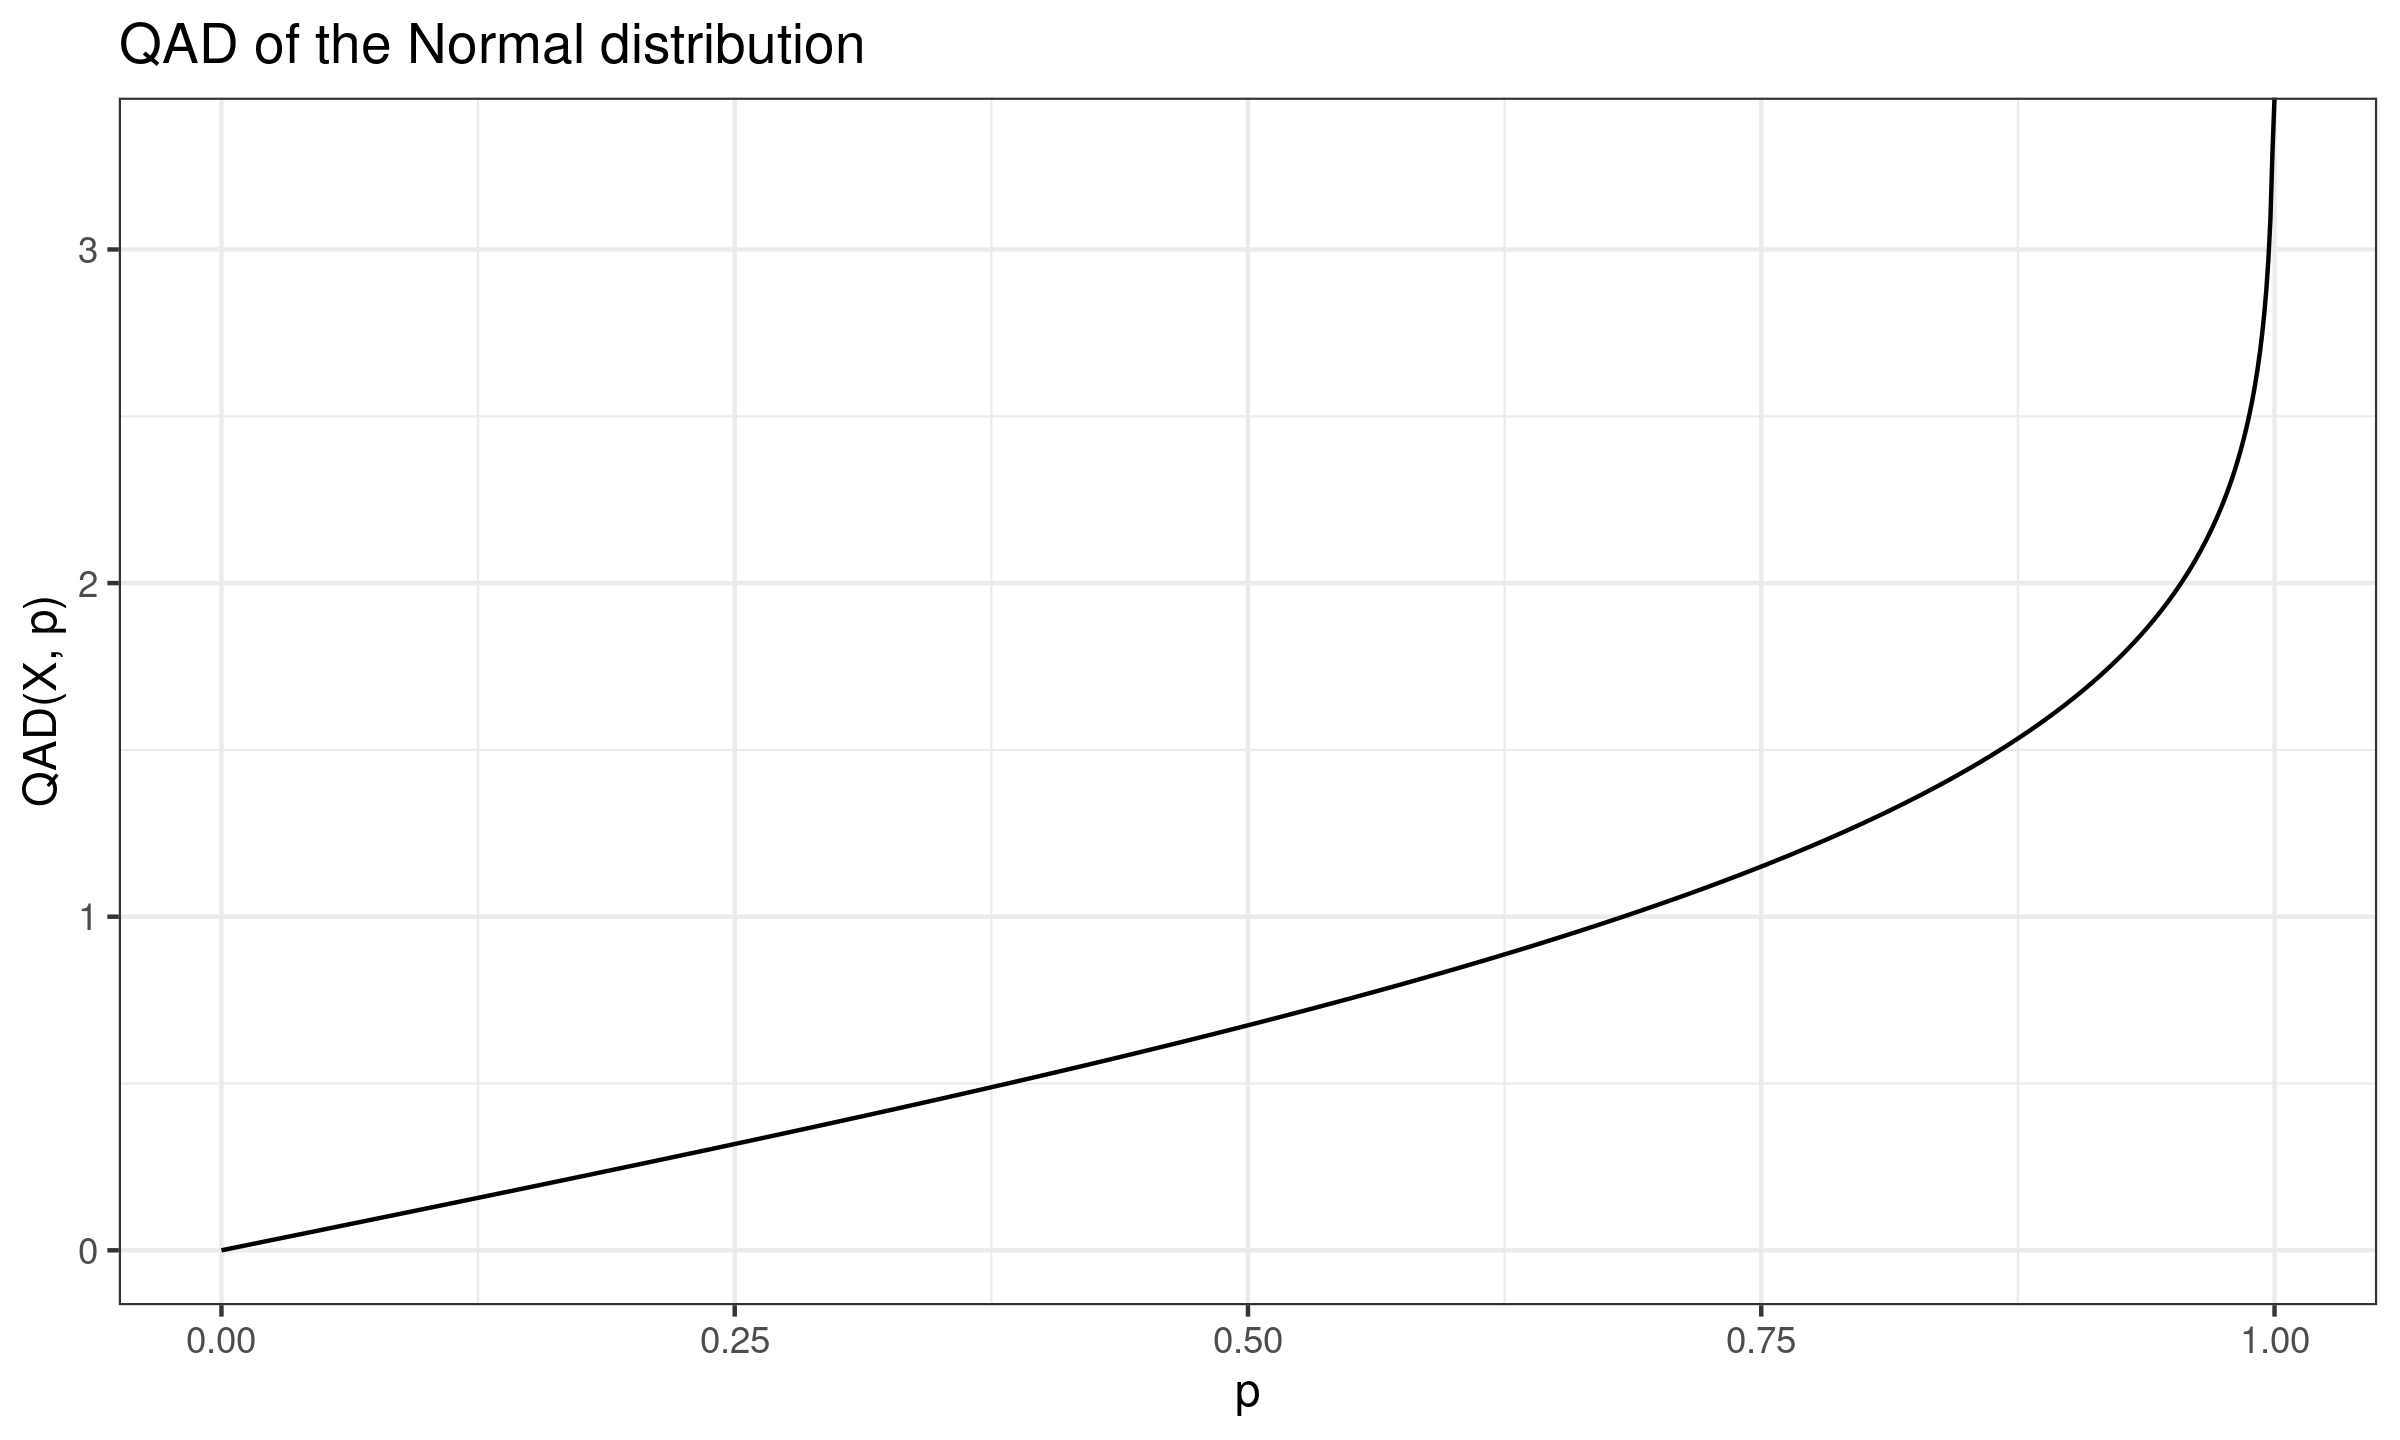
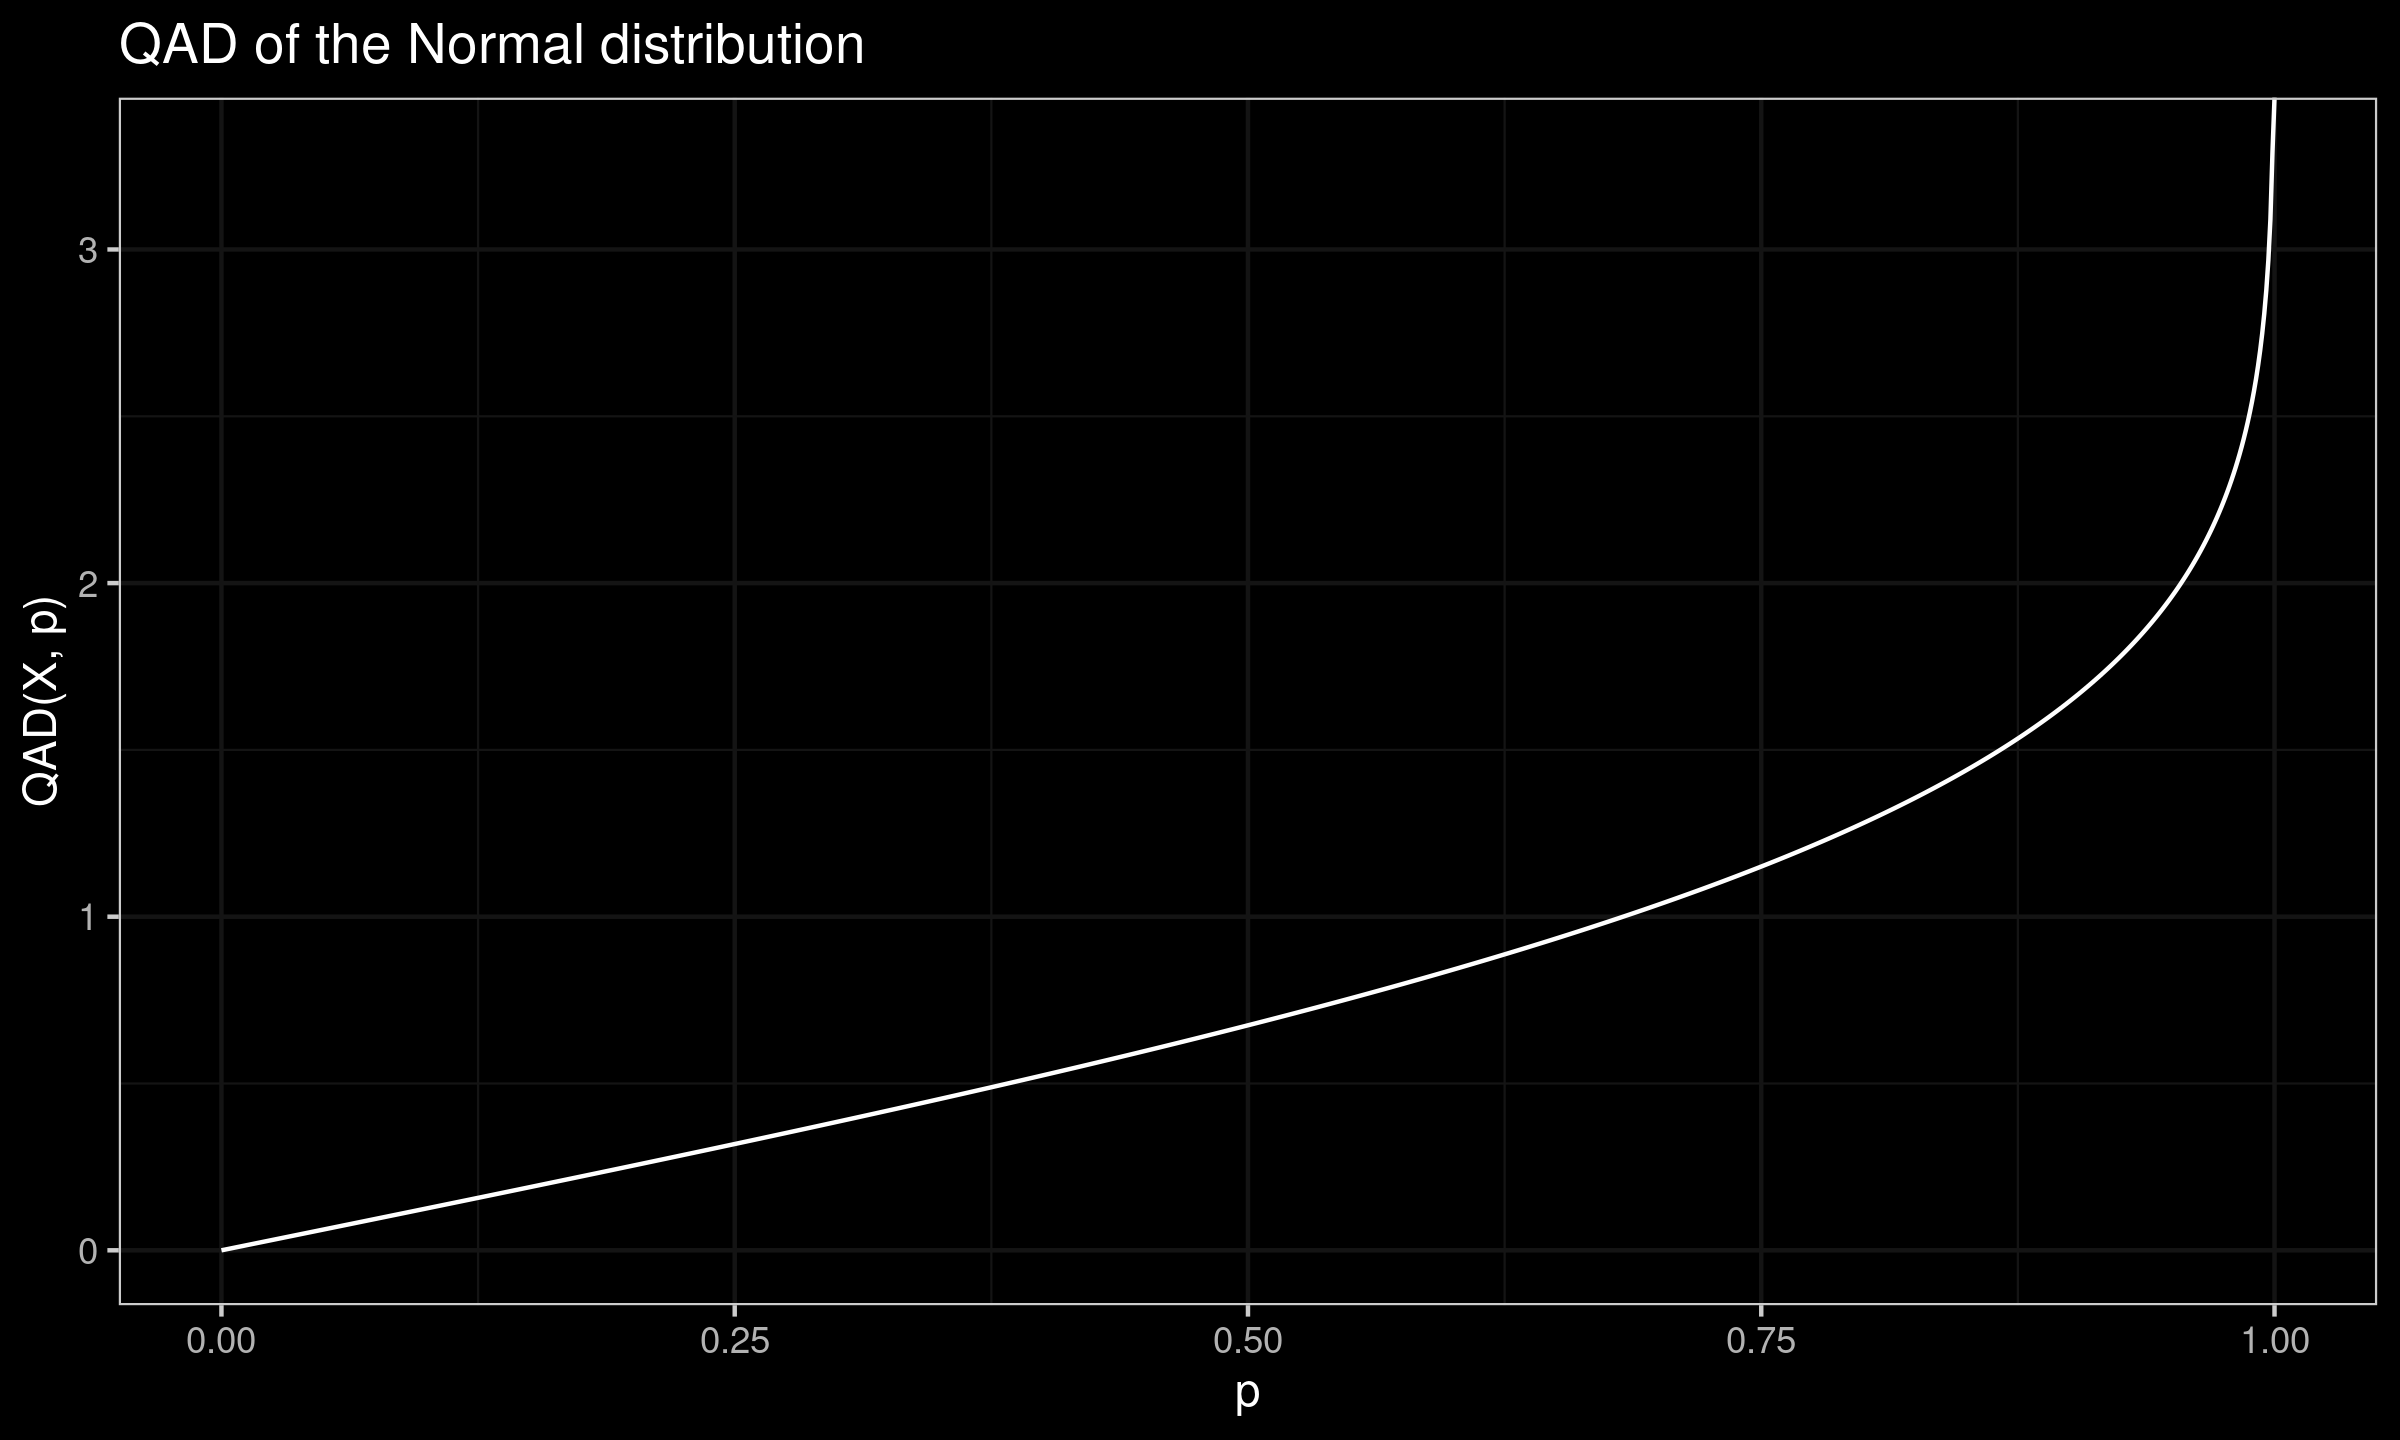
Quantile absolute deviation of the Normal distribution
In this post, we derive the exact equation for the quantile absolute deviation around the median of the Normal distribution.
Standard quantile absolute deviation
The median absolute deviation (MAD) is a popular robust replacement of the standard deviation (StdDev). It’s truly robust: its breakdown point is $50\%$. However, it’s not so efficient when we use it as a consistent estimator for the standard deviation under normality: the asymptotic relative efficiency against StdDev (we call it the Gaussian efficiency) is only about $\approx 37\%$.
In practice, such robustness is not always essential, while we typically want to have the highest possible efficiency. I already described the concept of the quantile absolute deviation which aims to provide a customizable trade-off between robustness and efficiency. In this post, I would like to suggest a new default option for this measure of dispersion called the standard quantile absolute deviation. Its Gaussian efficiency is $\approx 54\%$ while the breakdown point is $\approx 32\%$
Read moreAsymptotic Gaussian efficiency of the quantile absolute deviation
I have already discussed the concept of the quantile absolute deviation in several previous posts. In this post, we derive the equation for the relative statistical efficiency of the quantile absolute deviation against the standard deviation under the normal distribution (so call Gaussian efficiency).
Read more