P² quantile estimator rounding issue
Update: the estimator accuracy could be improved using a bunch of patches.
The P² quantile estimator is a sequential estimator that uses $O(1)$ memory. Thus, for the given sequence of numbers, it allows estimating quantiles without storing values. I already wrote a blog post about this approach and added its implementation in perfolizer. Recently, I got a bug report that revealed a flaw of the original paper. In this post, I’m going to briefly discuss this issue and the corresponding fix.
Read moreTrimmed Harrell-Davis quantile estimator based on the highest density interval of the given width
Traditional quantile estimators that are based on one or two order statistics are a common way to estimate distribution quantiles based on the given samples. These estimators are robust, but their statistical efficiency is not always good enough. A more efficient alternative is the Harrell-Davis quantile estimator which uses a weighted sum of all order statistics. Whereas this approach provides more accurate estimations for the light-tailed distributions, it’s not robust. To be able to customize the trade-off between statistical efficiency and robustness, we could consider a trimmed modification of the Harrell-Davis quantile estimator. In this approach, we discard order statistics with low weights according to the highest density interval of the beta distribution.
Read moreOptimal window of the trimmed Harrell-Davis quantile estimator, Part 2: Trying Planck-taper window
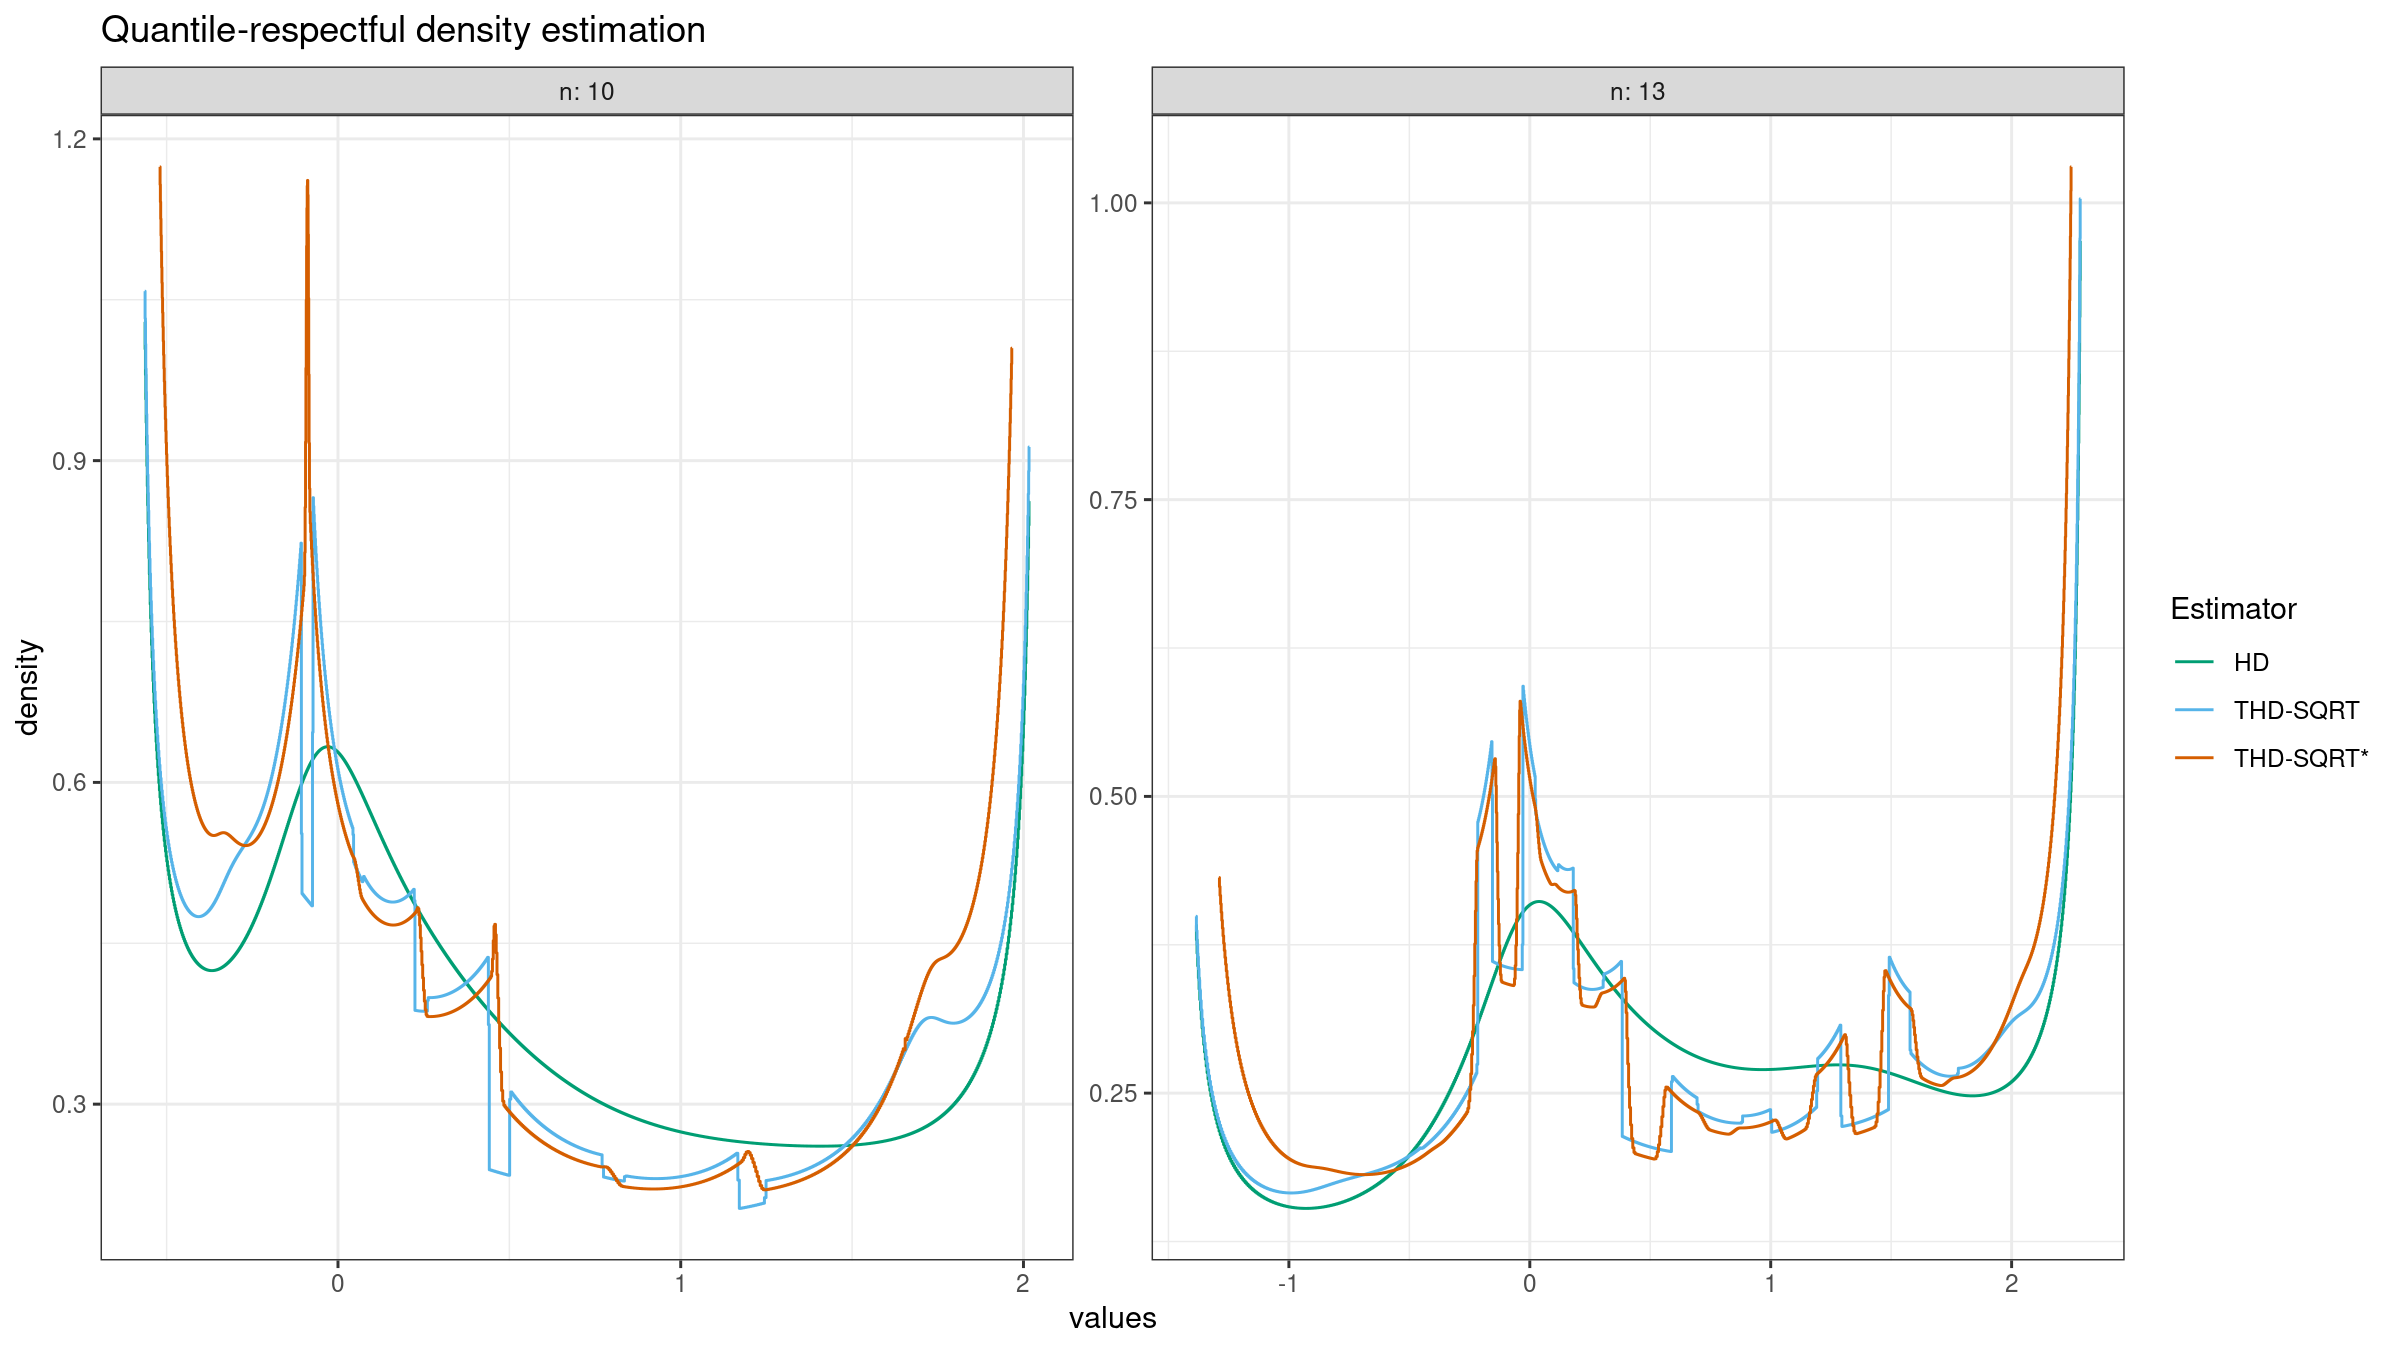
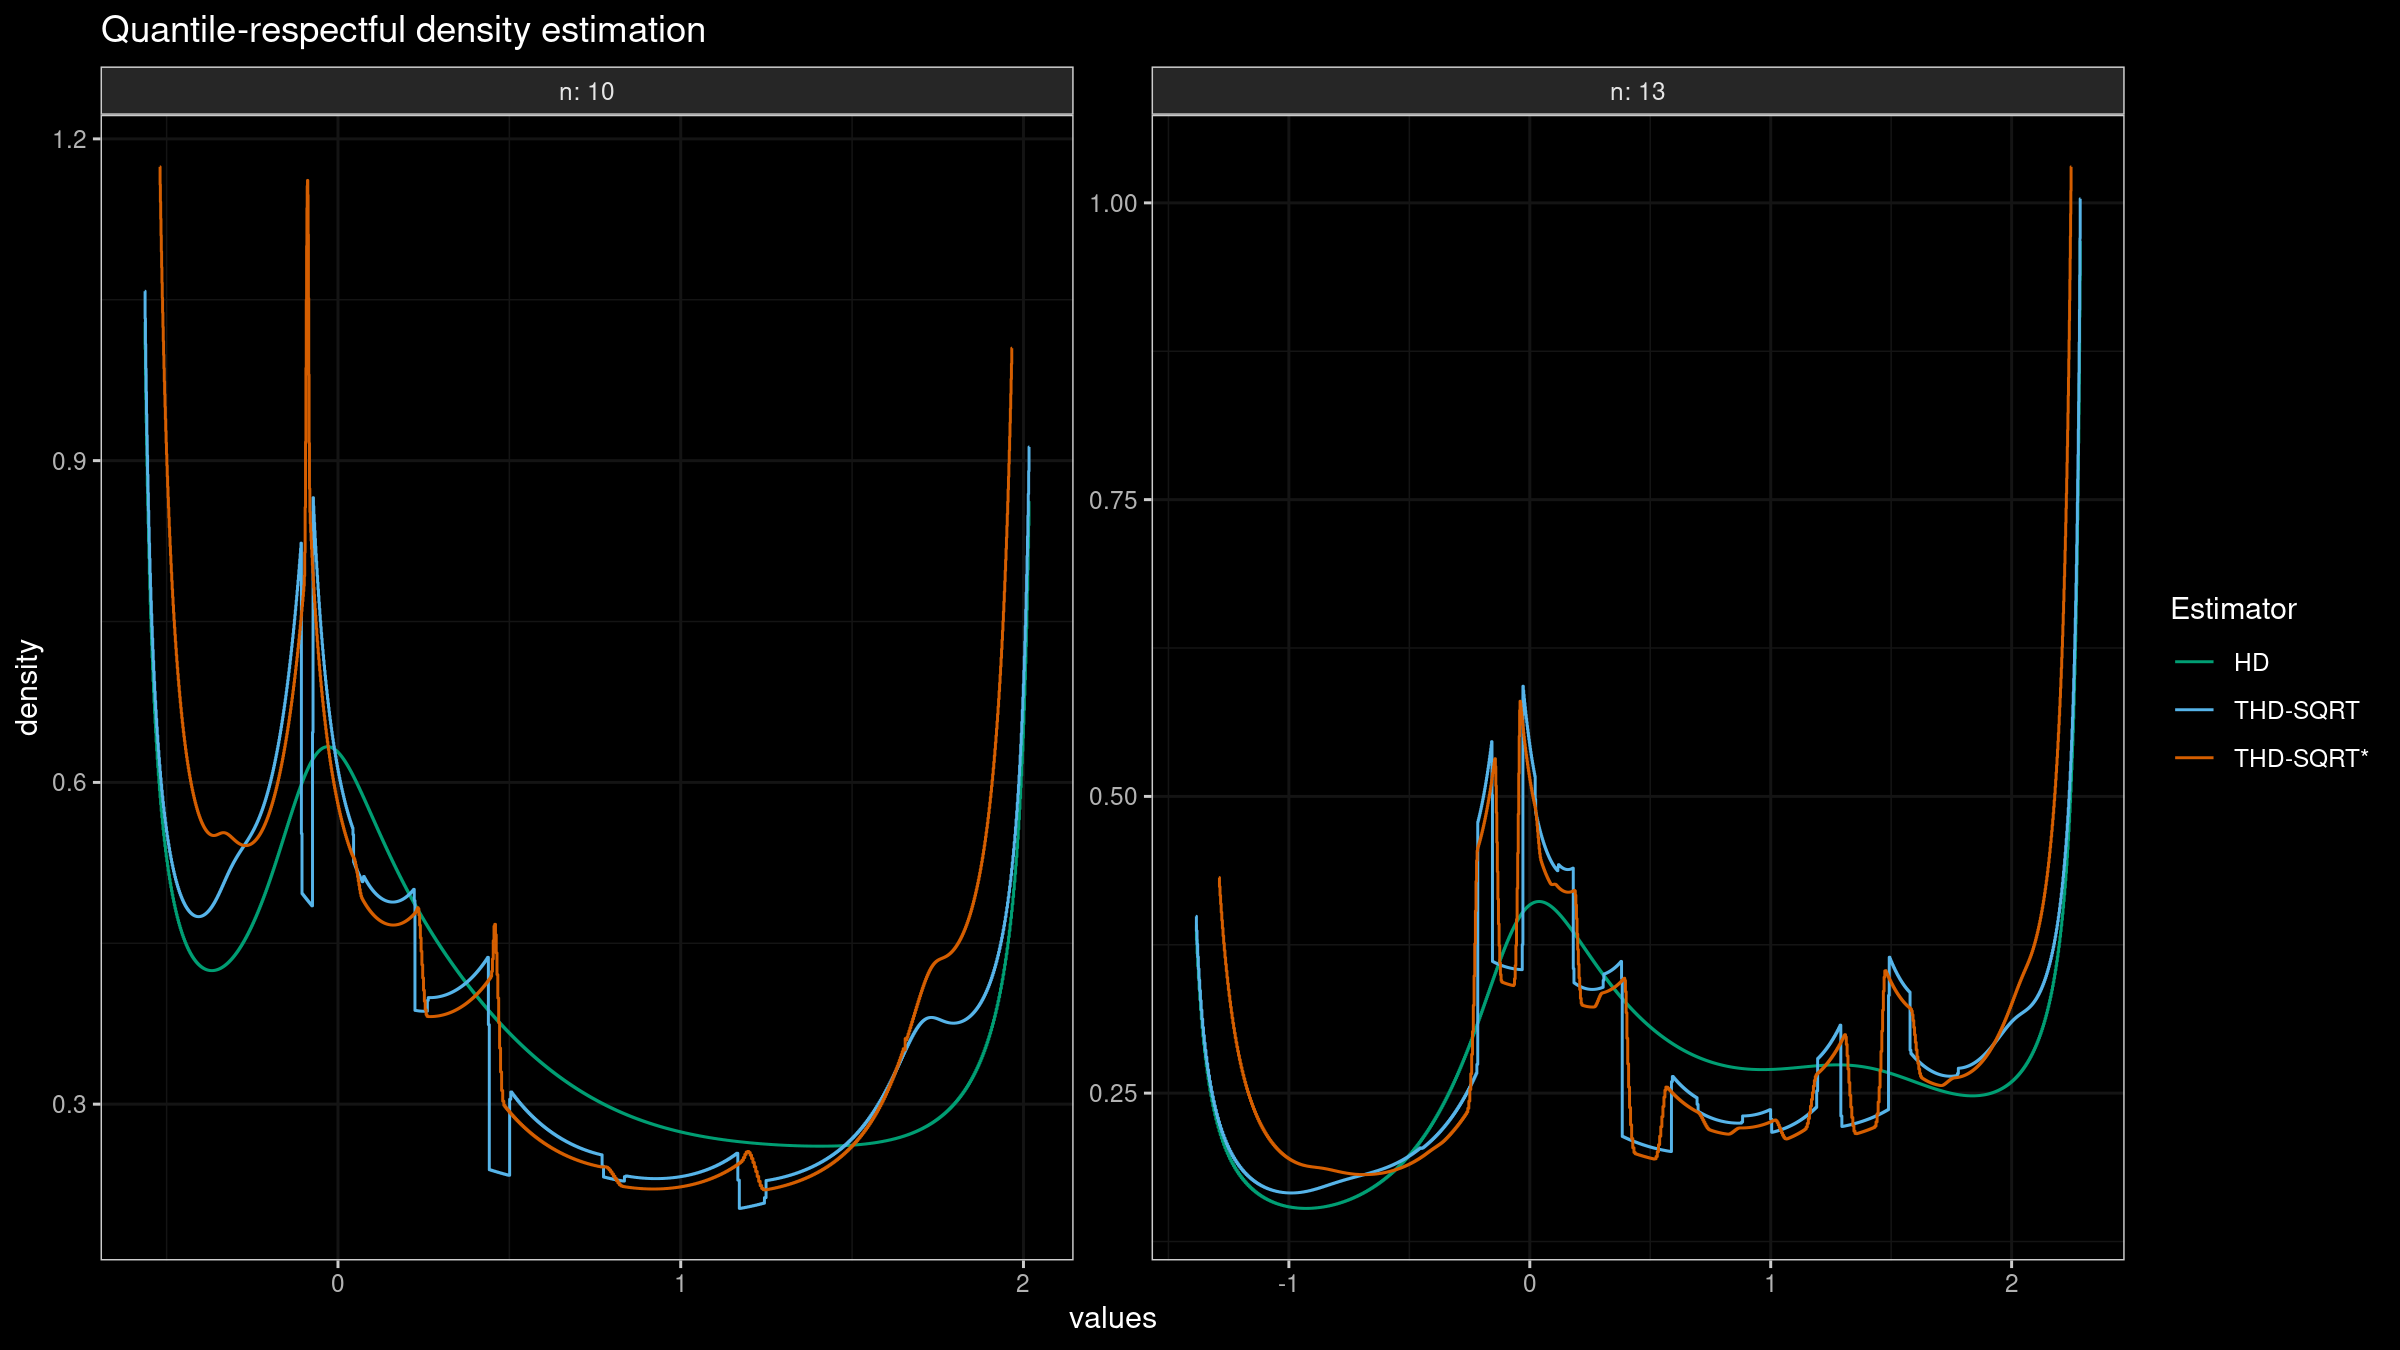
In the previous post, I discussed the problem of non-smooth quantile-respectful density estimation (QRDE) which is generated by the trimmed Harrell-Davis quantile estimator based on the highest density interval of the given width. I assumed that non-smoothness was caused by a non-smooth rectangular window which was used to build the truncated beta distribution. In this post, we are going to try another option: the Planck-taper window.
Optimal window of the trimmed Harrell-Davis quantile estimator, Part 1: Problems with the rectangular window
In the previous post, we have obtained a nice version of the trimmed Harrell-Davis quantile estimator which provides an opportunity to get a nice trade-off between robustness and statistical efficiency of quantile estimations. Unfortunately, it has a severe drawback. If we build a quantile-respectful density estimation based on the suggested estimator, we won’t get a smooth density function as in the case of the classic Harrell-Davis quantile estimator:
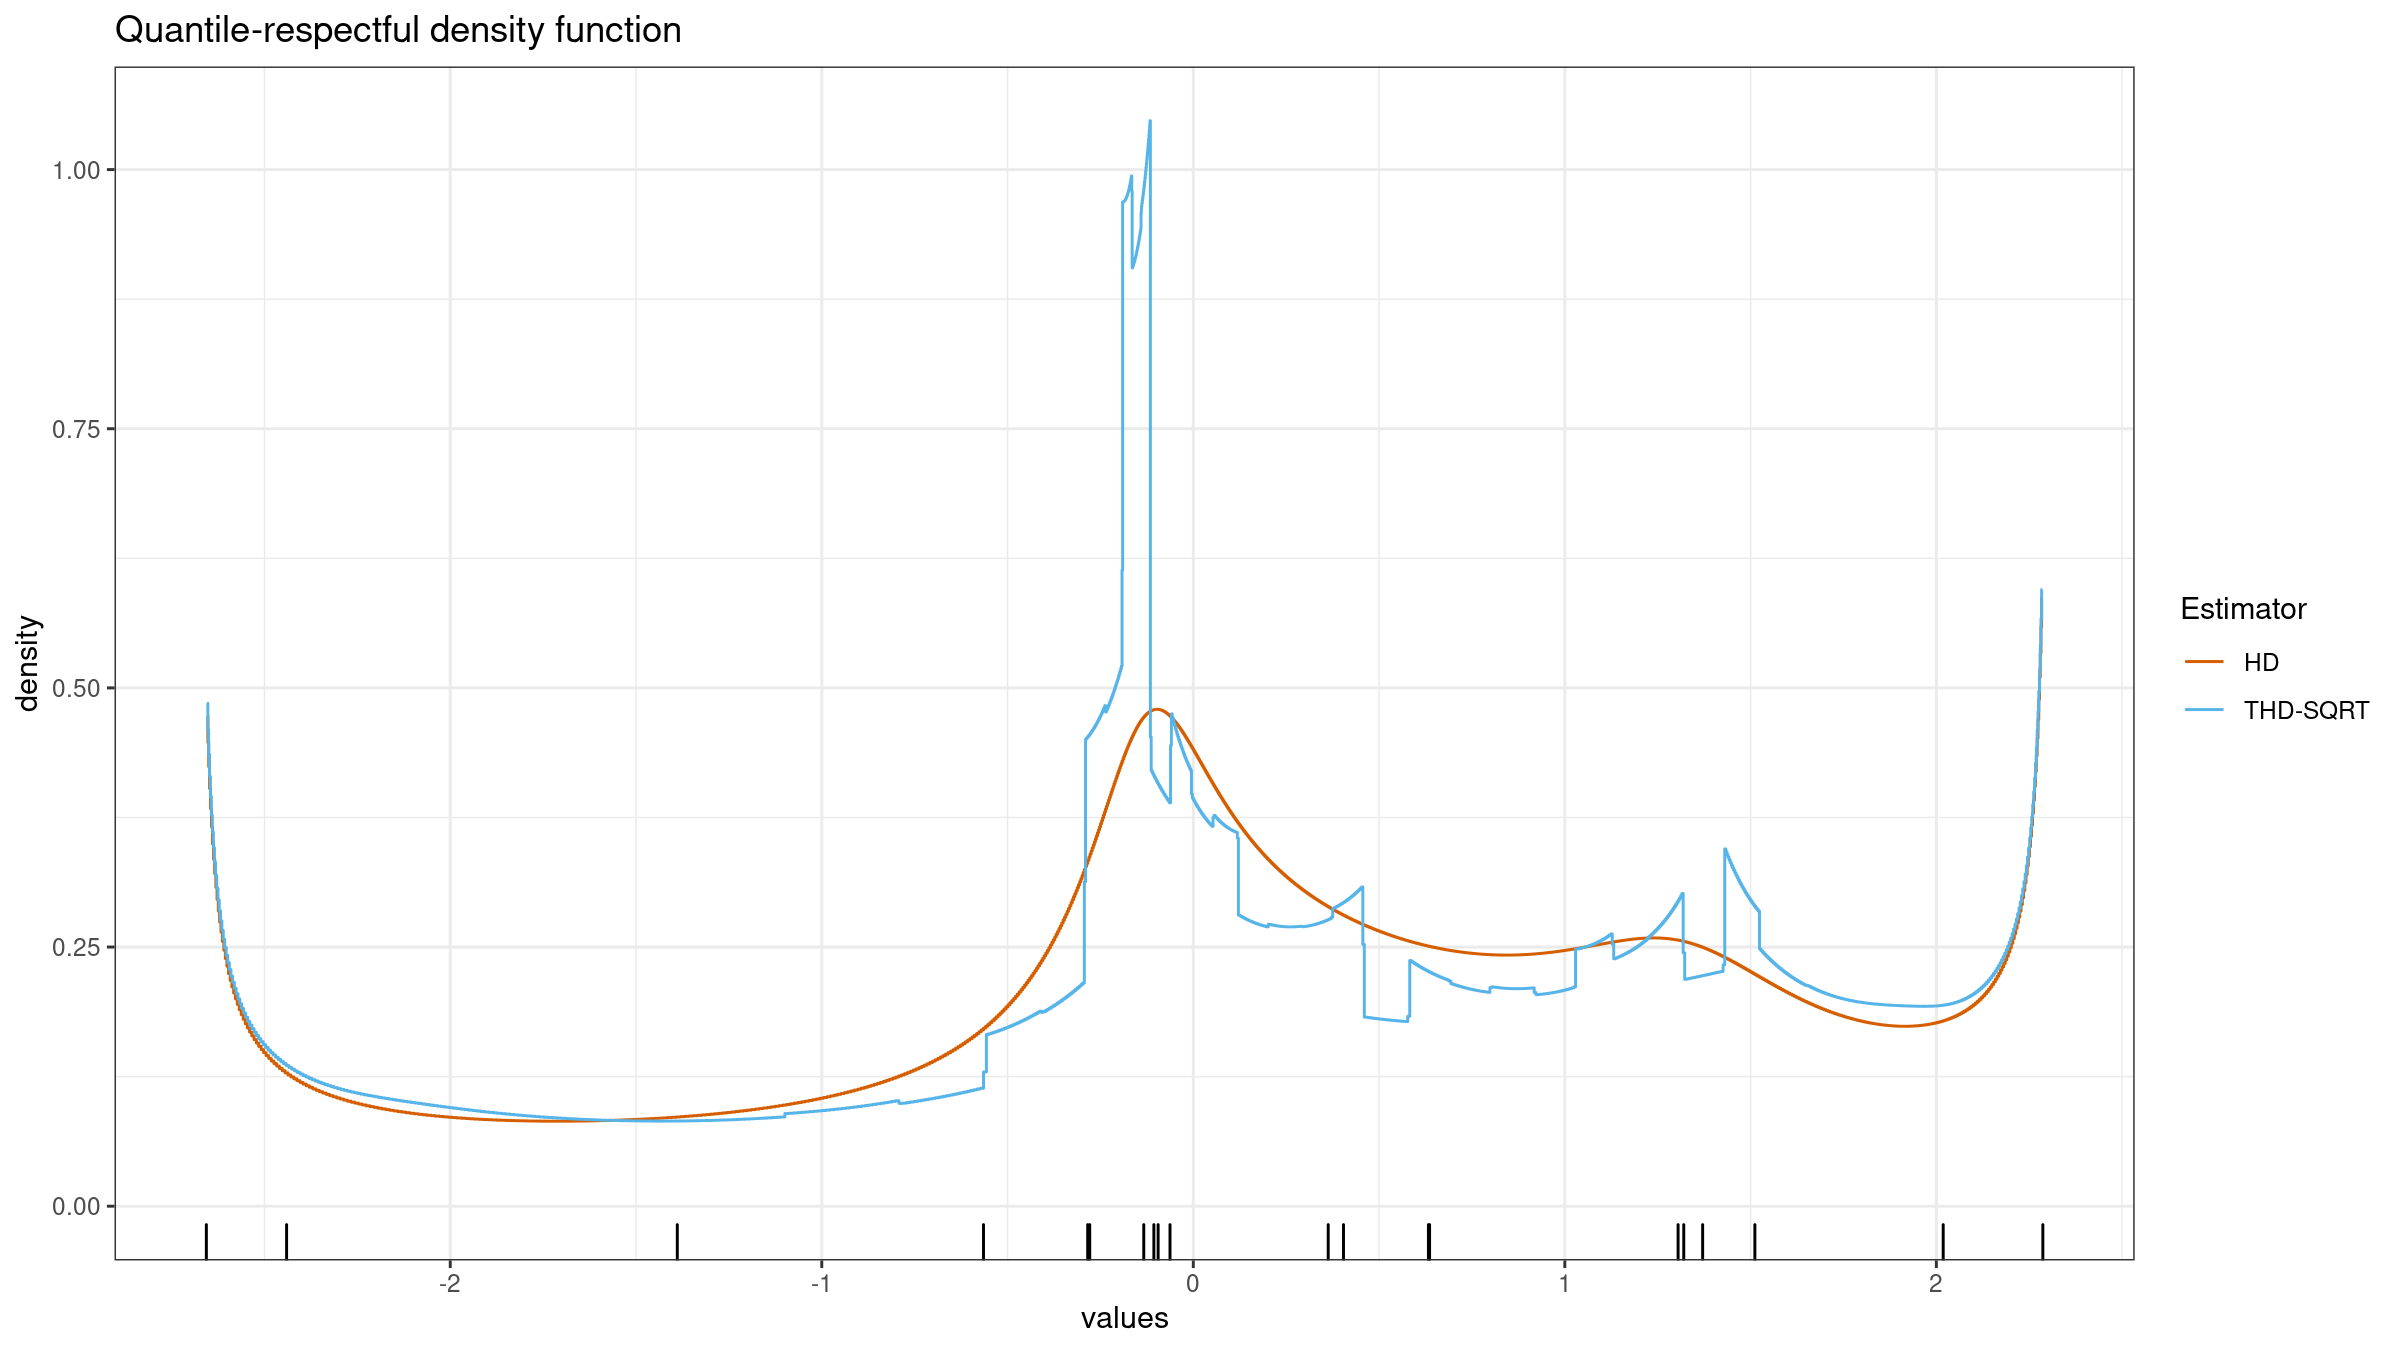
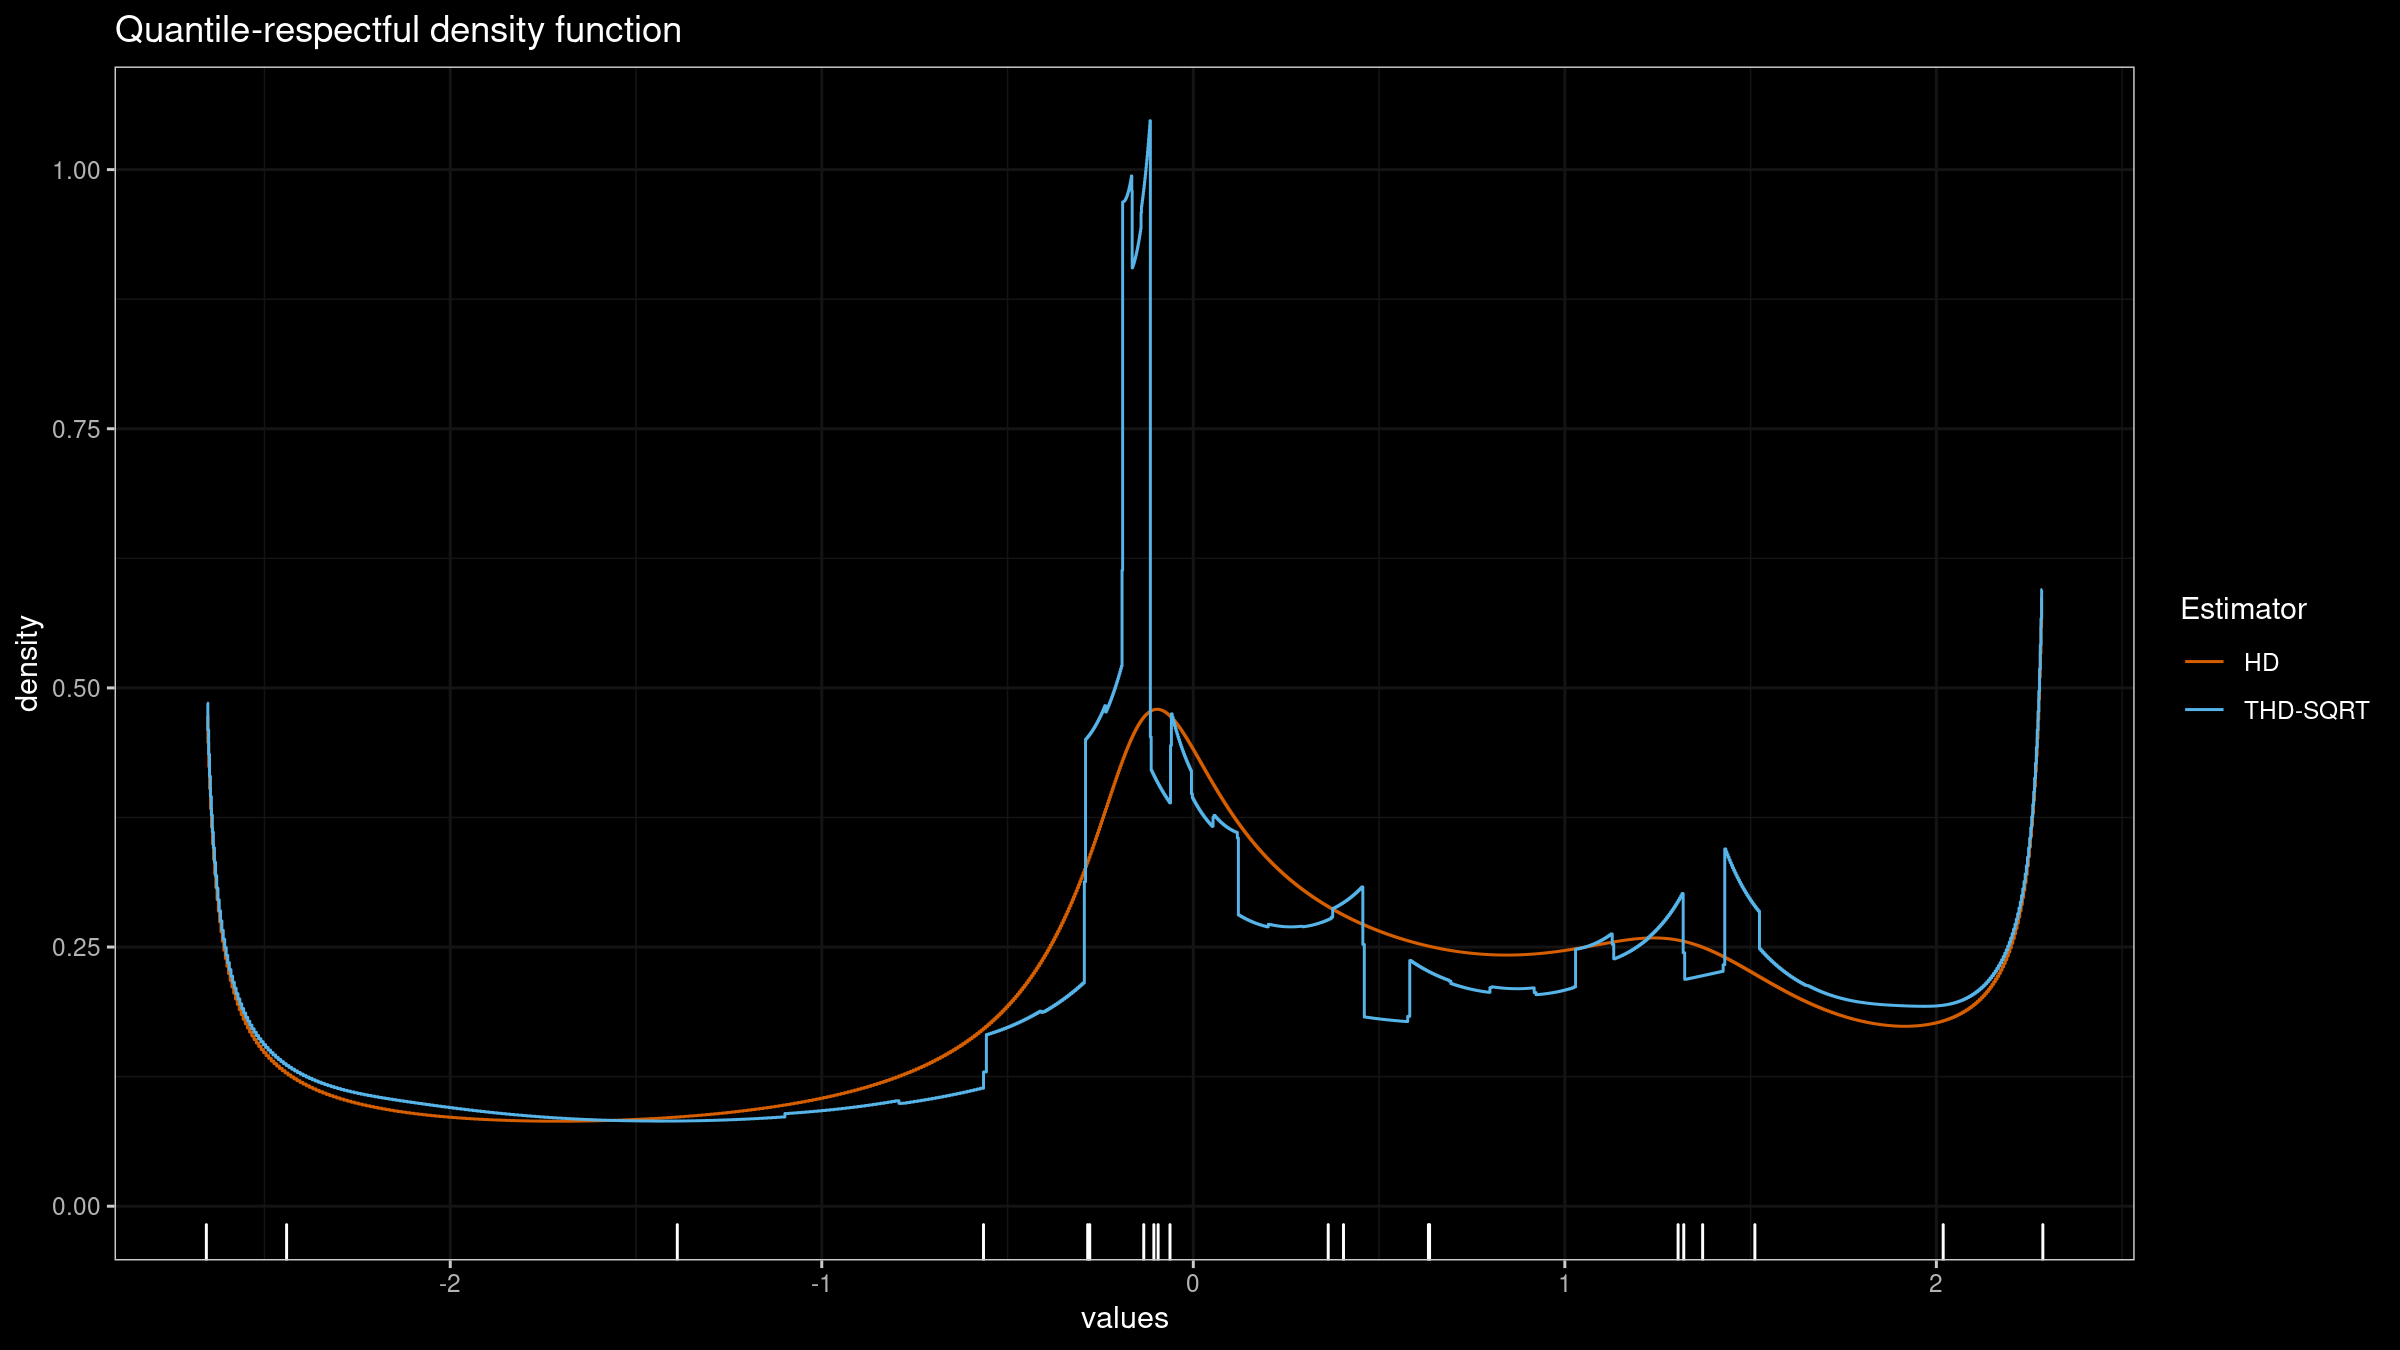
In this blog post series, we are going to find a way to improve the trimmed Harrell-Davis quantile estimator so that it gives a smooth density function and keeps its advantages in terms of robustness and statistical efficiency.
Read moreBeta distribution highest density interval of the given width
In one of the previous posts, I discussed the idea of the trimmed Harrell-Davis quantile estimator based on the highest density interval of the given width. Since the Harrell-Davis quantile estimator uses the Beta distribution, we should be able to find the beta distribution highest density interval of the given width. In this post, I will show how to do this.
Read moreQuantile estimators based on k order statistics, Part 8: Winsorized Harrell-Davis quantile estimator
In the previous post, we have discussed the trimmed modification of the Harrell-Davis quantile estimator based on the highest density interval of size $\sqrt{n}/n$. This quantile estimator showed a decent level of statistical efficiency. However, the research wouldn’t be complete without comparison with the winsorized modification. Let’s fix it!
Read moreQuantile estimators based on k order statistics, Part 7: Optimal threshold for the trimmed Harrell-Davis quantile estimator
In the previous post, we have obtained a nice quantile estimator. To be specific, we considered a trimmed modification of the Harrell-Davis quantile estimator based on the highest density interval of the given size. The interval size is a parameter that controls the trade-off between statistical efficiency and robustness. While it’s nice to have the ability to control this trade-off, there is also a need for the default value, which could be used as a starting point when we have neither estimator breakdown point requirements nor prior knowledge about distribution properties.
After a series of unsuccessful attempts, it seems that I have found an acceptable solution. We should build the new estimator based on $\sqrt{n}/n$ order statistics. In this post, I’m going to briefly explain the idea behind the suggested estimator and share some numerical simulations that compare the proposed estimator and the classic Harrell-Davis quantile estimator.
Read moreQuantile estimators based on k order statistics, Part 6: Continuous trimmed Harrell-Davis quantile estimator
In my previous post, I tried the idea of using the trimmed modification of the Harrell-Davis quantile estimator based on the highest density interval of the given width. The width was defined so that it covers exactly k order statistics (the width equals $(k-1)/n$). I was pretty satisfied with the result and decided to continue evolving this approach. While “k order statistics” is a good mental model that described the trimmed interval, it doesn’t actually require an integer k. In fact, we can use any real number as the trimming percentage.
In this post, we are going to perform numerical simulations that check the statistical efficiency of the trimmed Harrell-Davis quantile estimator with different trimming percentages.
Read moreQuantile estimators based on k order statistics, Part 5: Improving trimmed Harrell-Davis quantile estimator
During the last several months, I have been experimenting with different variations of the trimmed Harrell-Davis quantile estimator. My original idea of using the highest density interval based on the fixed area percentage (e.g., HDI 95% or HDI 99%) led to a set of problems with overtrimming. I tried to solve them with manually customized trimming strategy, but this approach turned out to be too inconvenient; it was too hard to come up with optimal thresholds. One of the main problems was about the suboptimal number of elements that we actually aggregate to obtain the quantile estimation. So, I decided to try an approach that involves exactly k order statistics. The idea was so promising, but numerical simulations haven’t shown the appropriate efficiency level.
This bothered me the whole week. It sounded so reasonable to trim the Harrell-Davis quantile estimator using exactly k order statistics. Why didn’t this work as expected? Finally, I have found a fatal flaw in my previous approach: while it was a good idea to fix the size of the trimming window, I mistakenly chose its location following the equation from the Hyndman-Fan Type 7 quantile estimator!
In this post, we fix this problem and try another modification of the trimmed Harrell-Davis quantile estimator based on k order statistics and highest density intervals at the same time.
Read more