Exploring the power curve of the Ansari-Bradley test
The Ansari-Bradley test is a popular rank-based nonparametric test for a difference in scale/dispersion parameters. In this post, we explore its power curve in a numerical simulation.
The Ansari-Bradley test
Let $\mathbf{x} = (x_1, x_2, \ldots, x_n)$ and $\mathbf{y} = (y_1, y_2, \ldots, y_m)$ be random samples. Let $N=n+m$. Let $\mathbf{V} = (V_1, V_2, \ldots, V_N)$ be a boolean vector of zeros and ones, where $V_i = 1$ if the $i^\textrm{th}$ order statistic of the pooled sample $(\mathbf{x}, \mathbf{y})$ is come from $\mathbf{x}$.
With this notation, we can define the Ansari-Bradley statistic $\operatorname{AB}$ as follows:
$$ \operatorname{AB} = \frac{1}{2} n (N + 1) - \sum_{i=1}^N \left| i - \frac{1}{2}(N+1) \right| \cdot V_i. $$The asymptotic approximation is defined by the following normal distribution:
$$ \mu = \begin{cases} \frac{1}{4} n(N + 2), & \;\textrm{if}\;N\;\textrm{is even,}\\ \frac{1}{4} n(N + 1)^2/N, & \;\textrm{if}\;N\;\textrm{is odd,} \end{cases} $$$$ \sigma^2 = \begin{cases} nm(N^2-4) / (48(N-1)) & \;\textrm{if}\;N\;\textrm{is even,}\\ nm(N+1)(N^2+3) / (48N^2) & \;\textrm{if}\;N\;\textrm{is odd.} \end{cases} $$Power curve
For exploring the power curve, we compare $\mathcal{N}(0, 1)$ and $\mathcal{N}(0, \sigma^2)$. We enumerate $\sigma$ values (aka “ratio”) in $[1; 10]$. The sample size are in $n \in \{5, 10, 20 \}$, the statistical level $\alpha = 0.05$, all the statistical tests are two-sided. Just for fun, in addition to the Ansari-Bradley test, we also consider Welch’s t-test and Mann-Whitney U test. Here are the power curves:
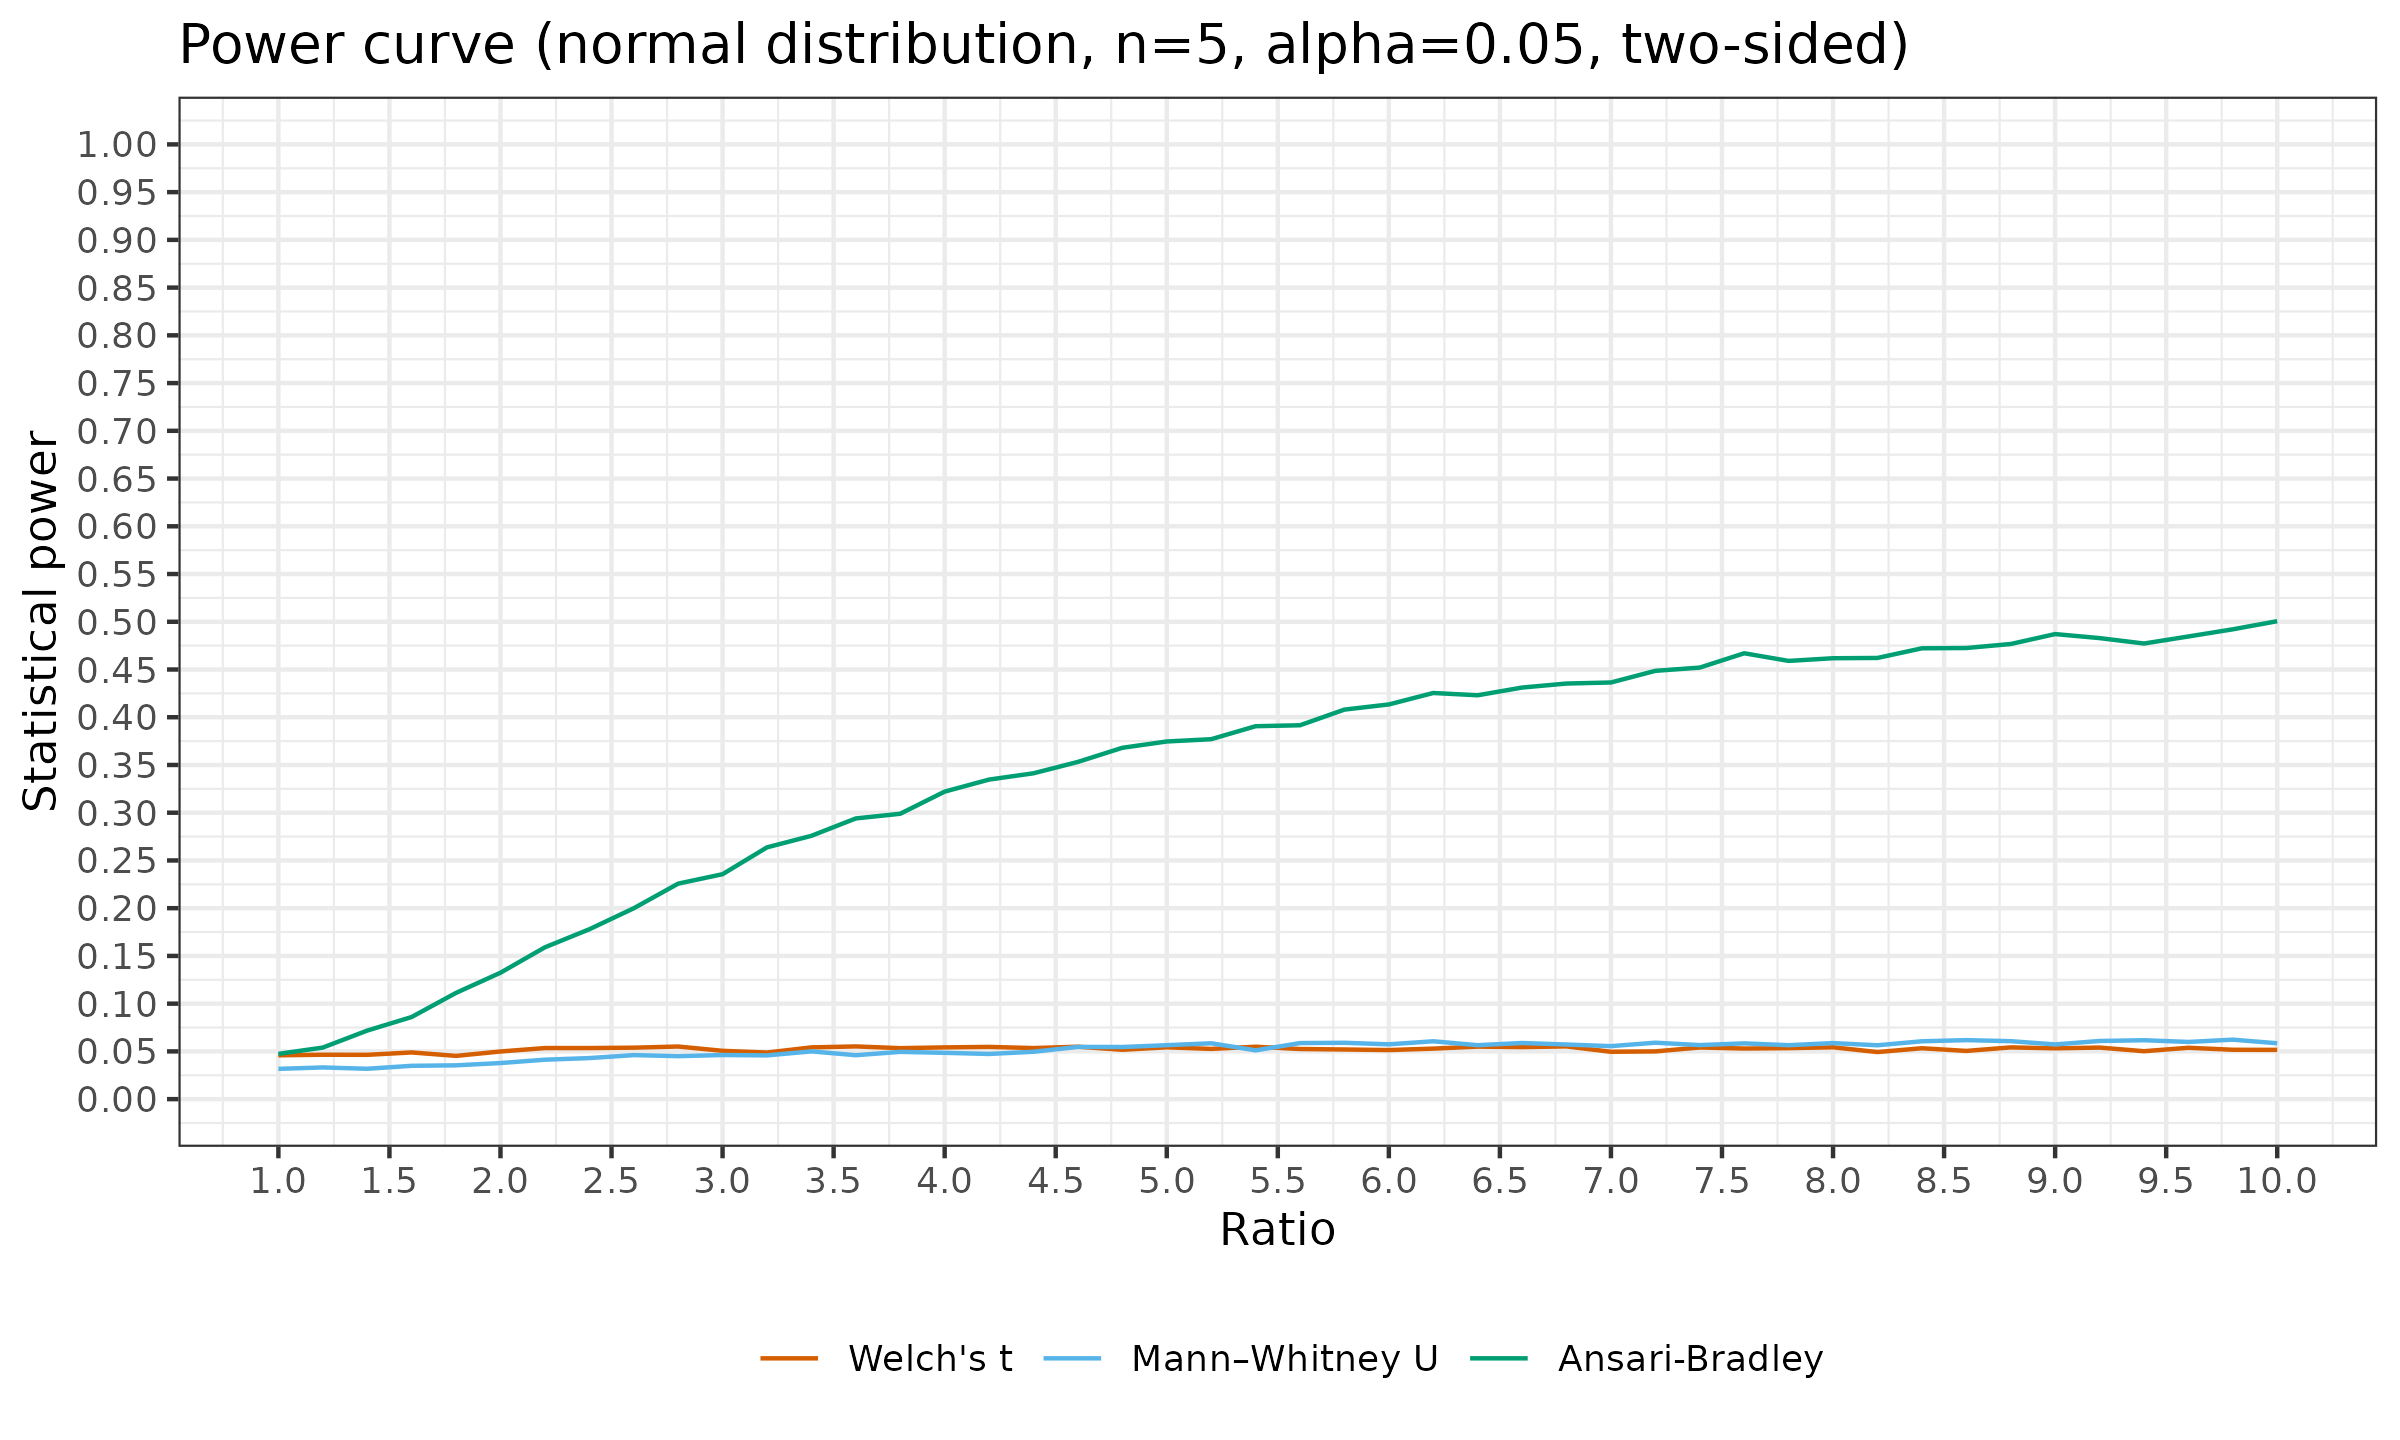

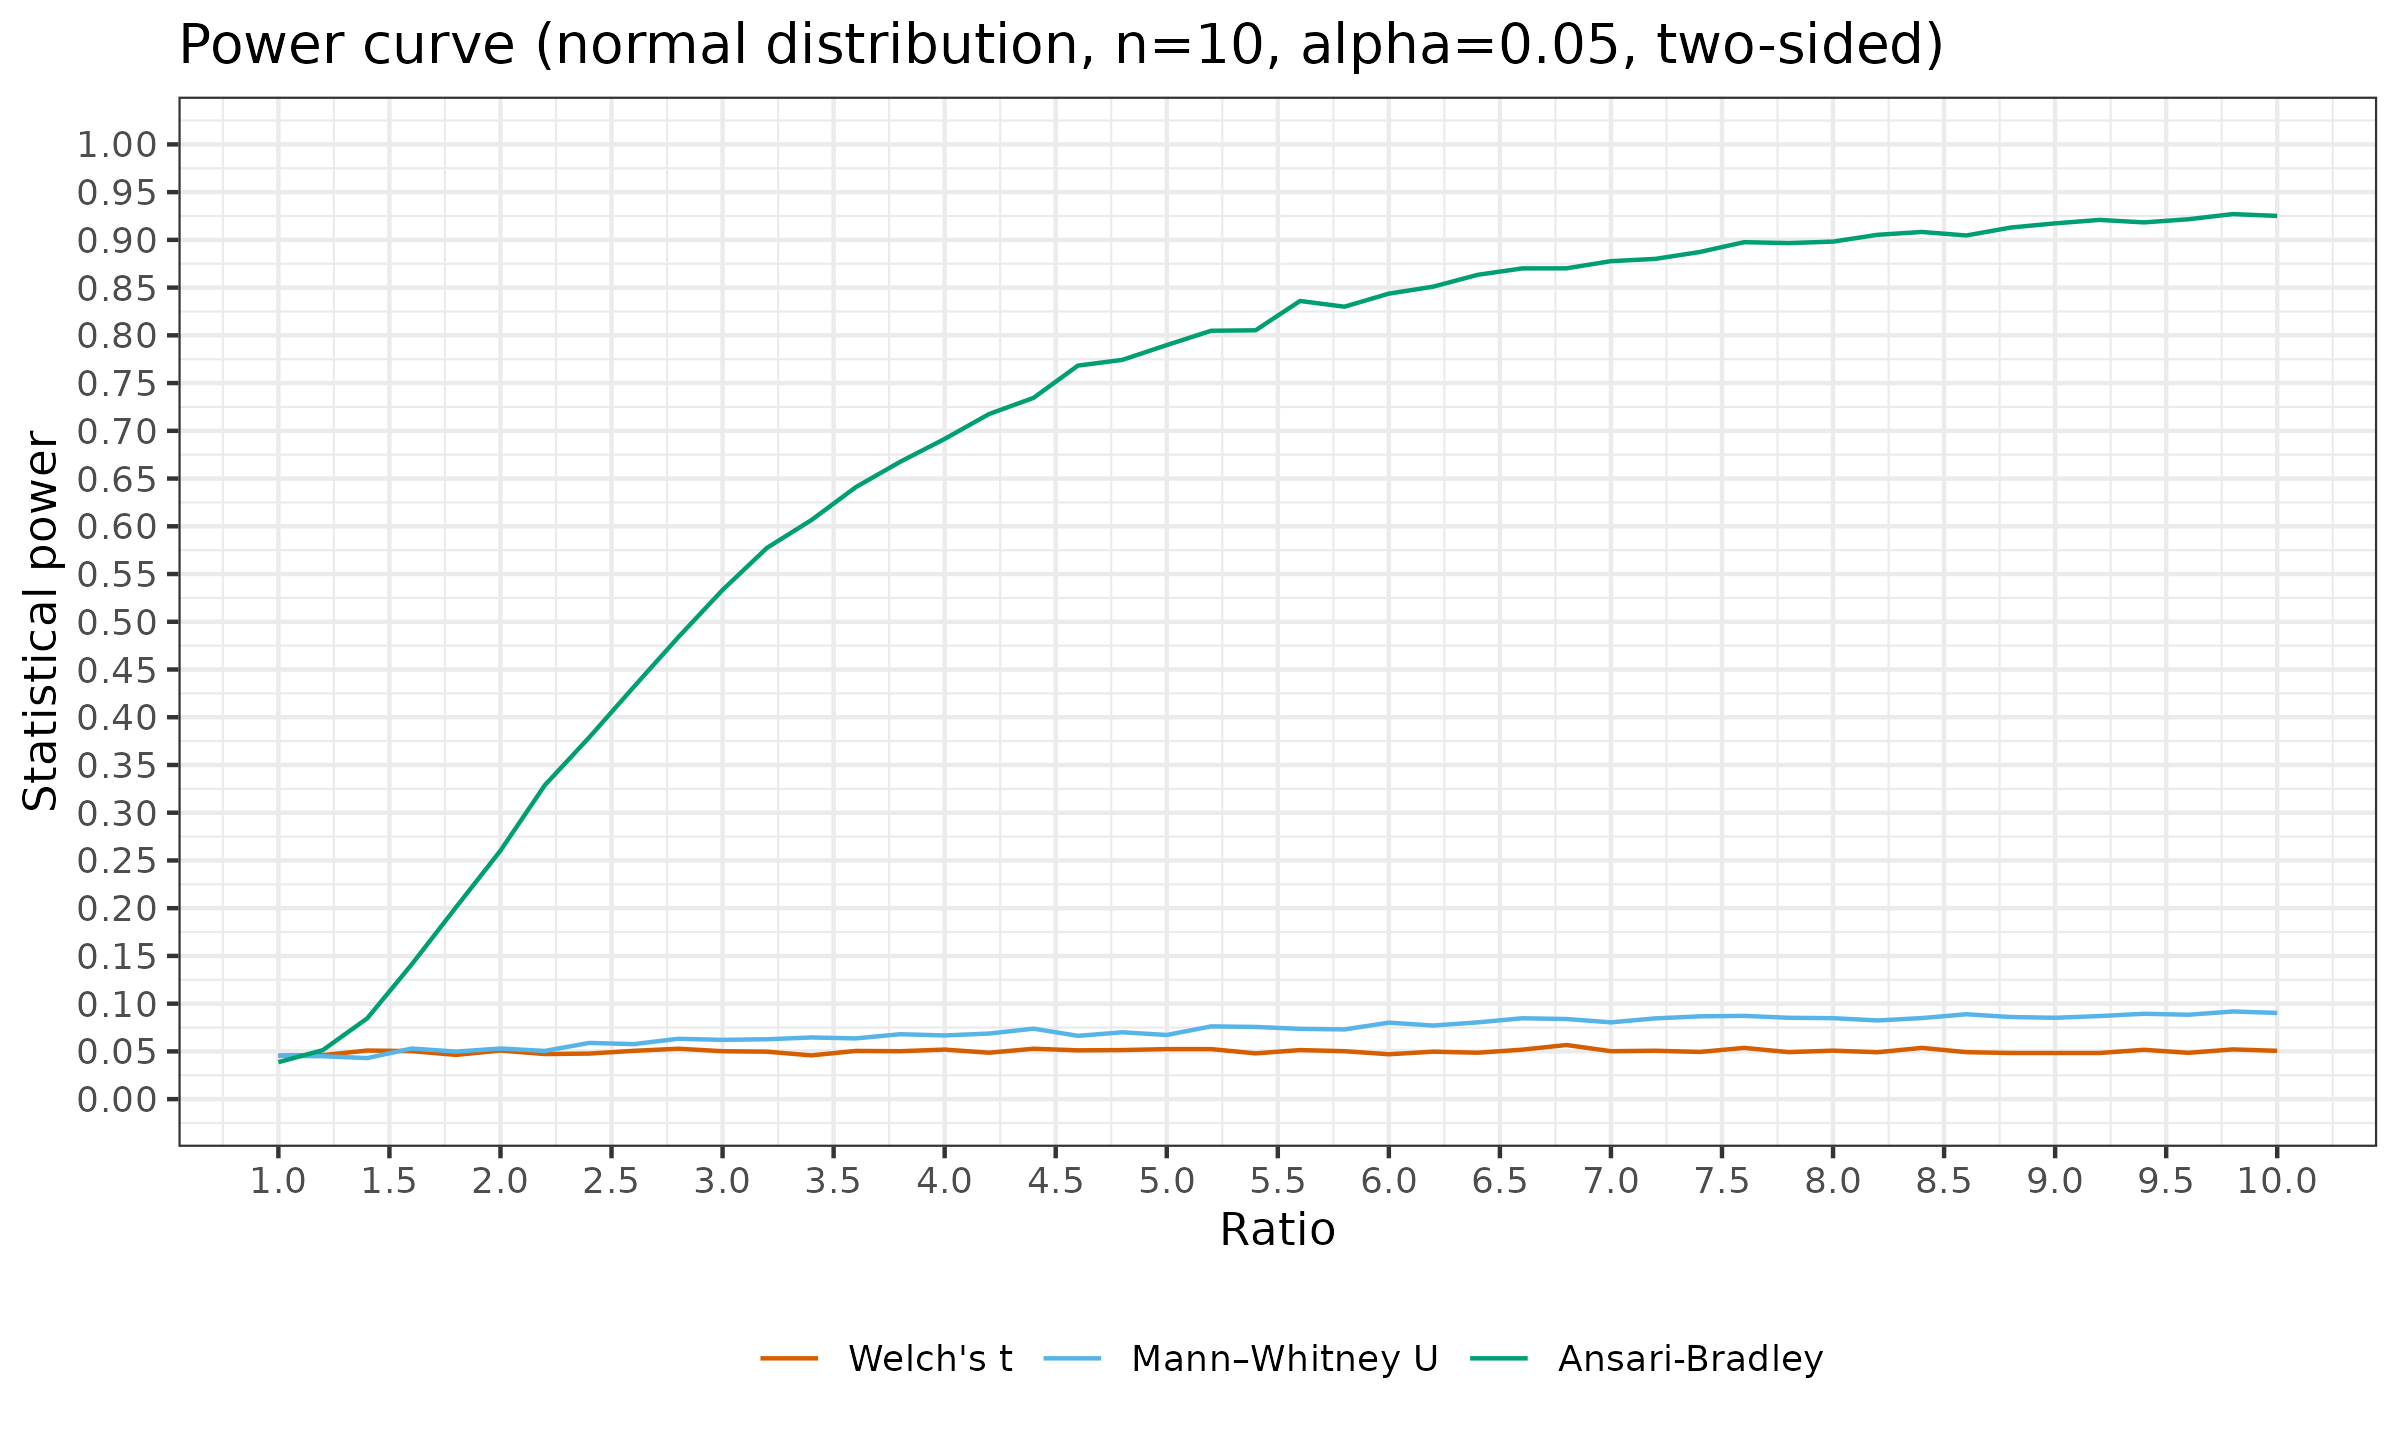
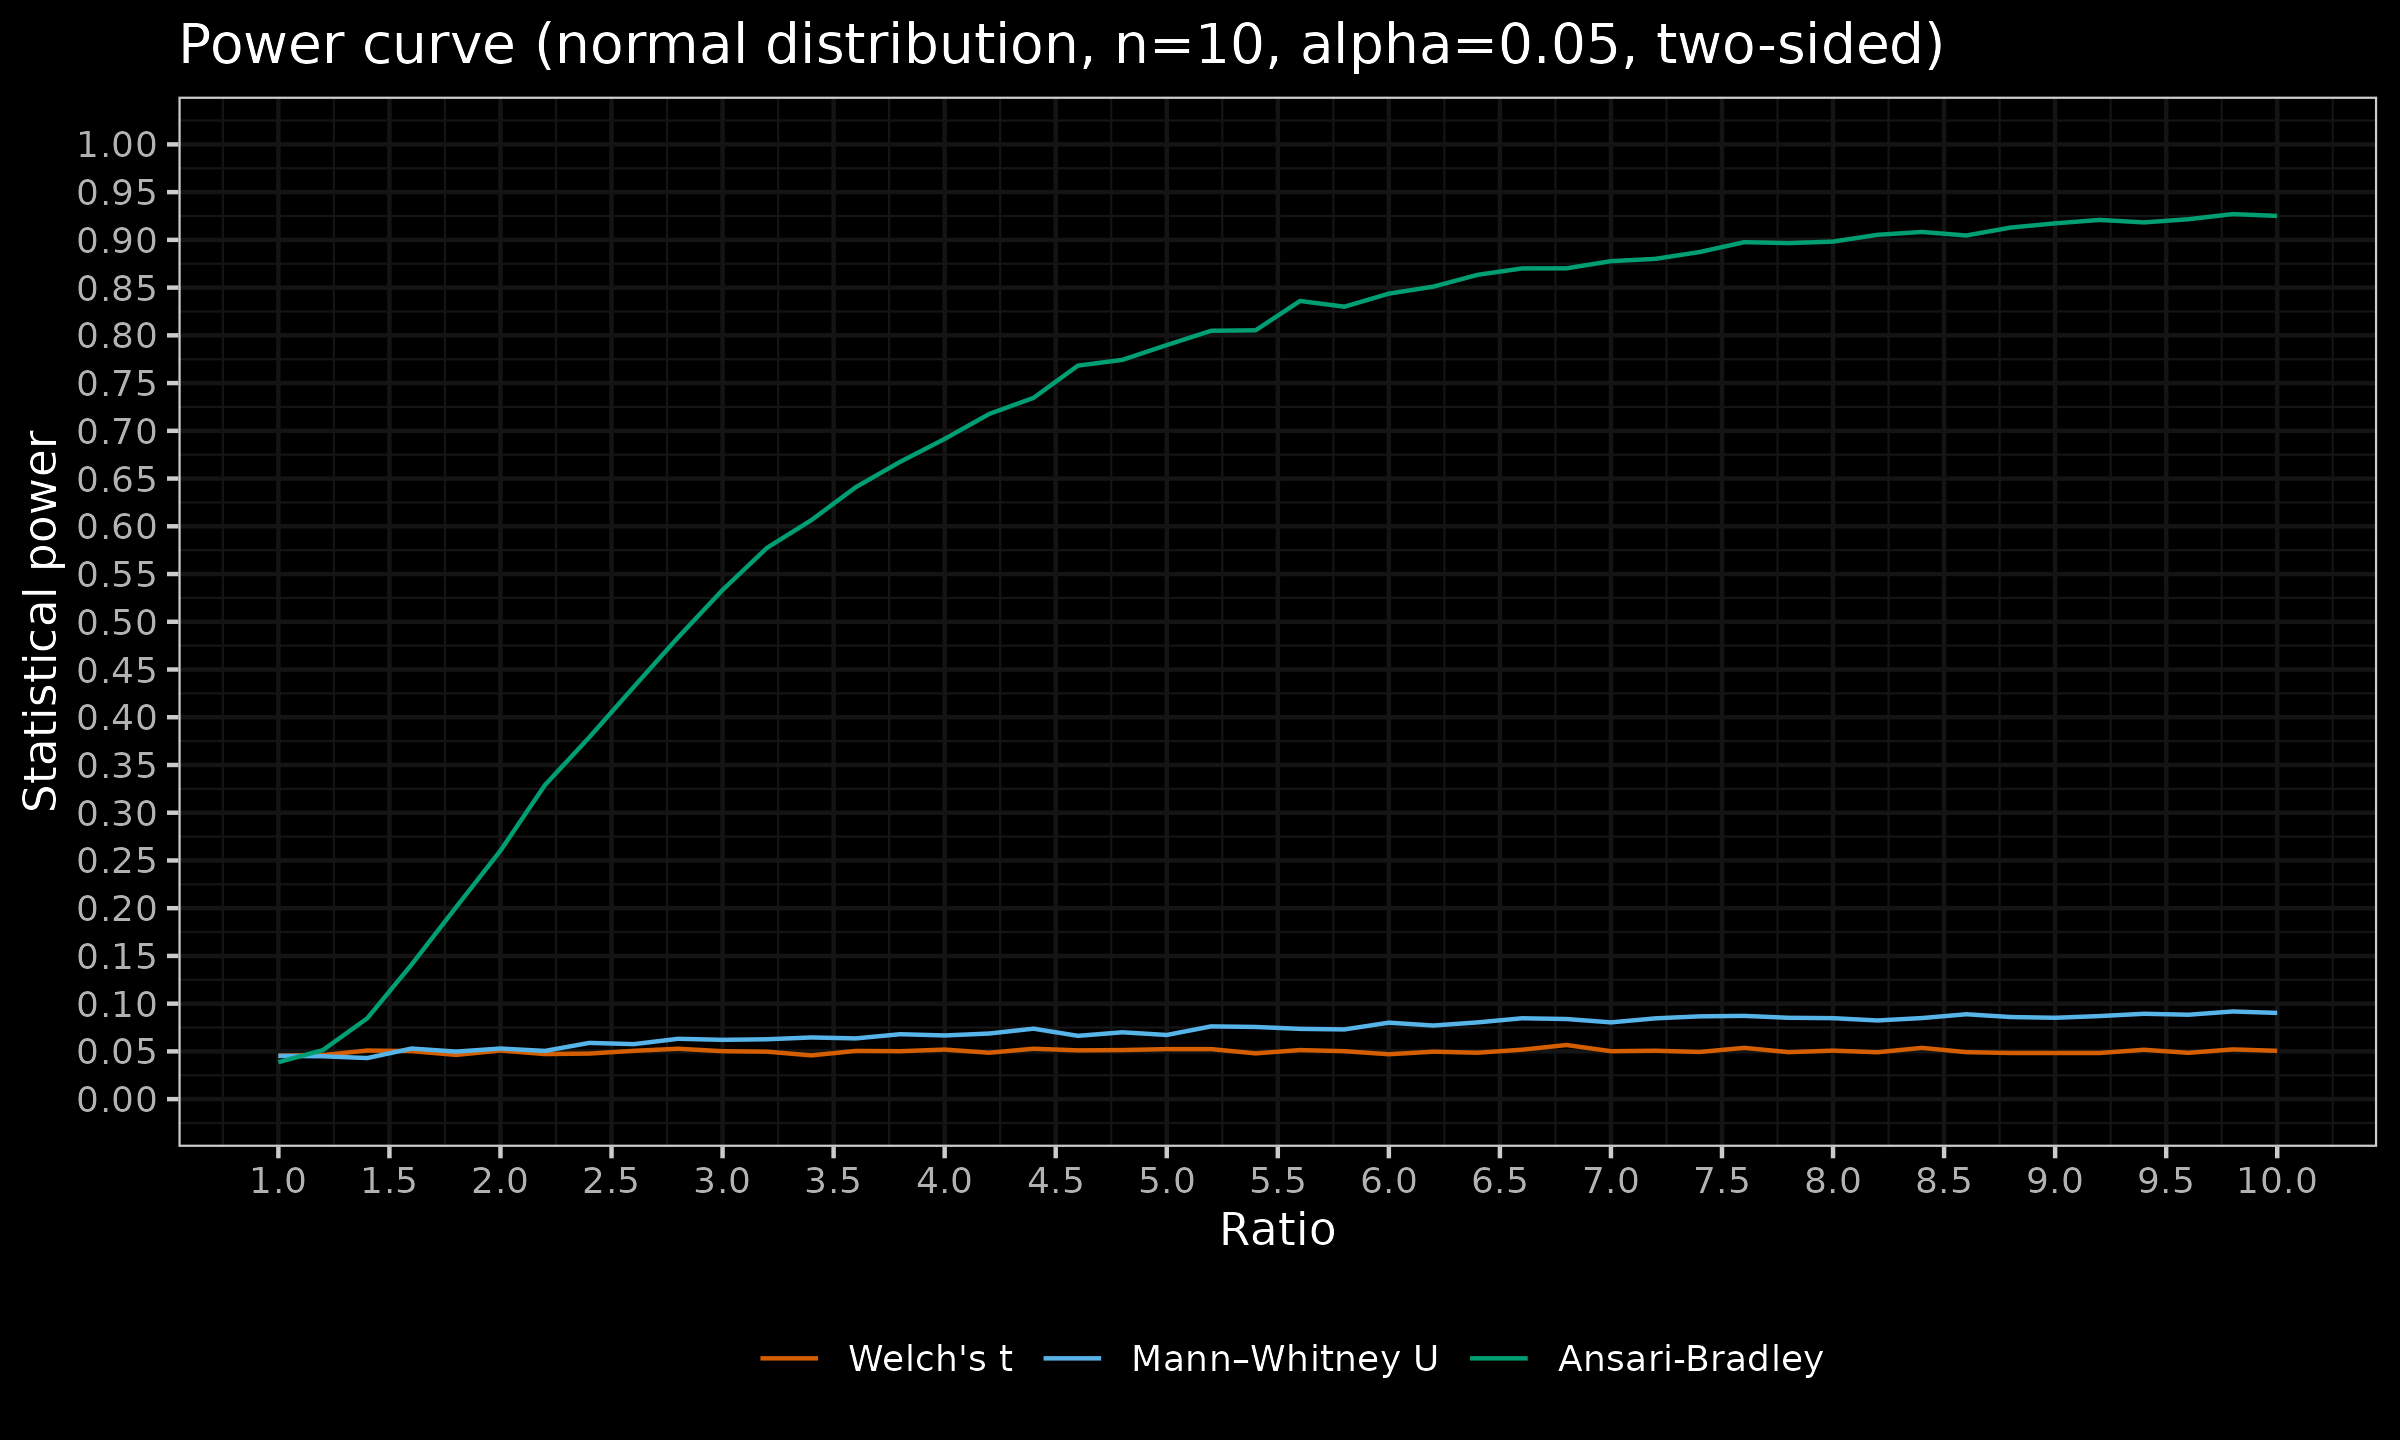

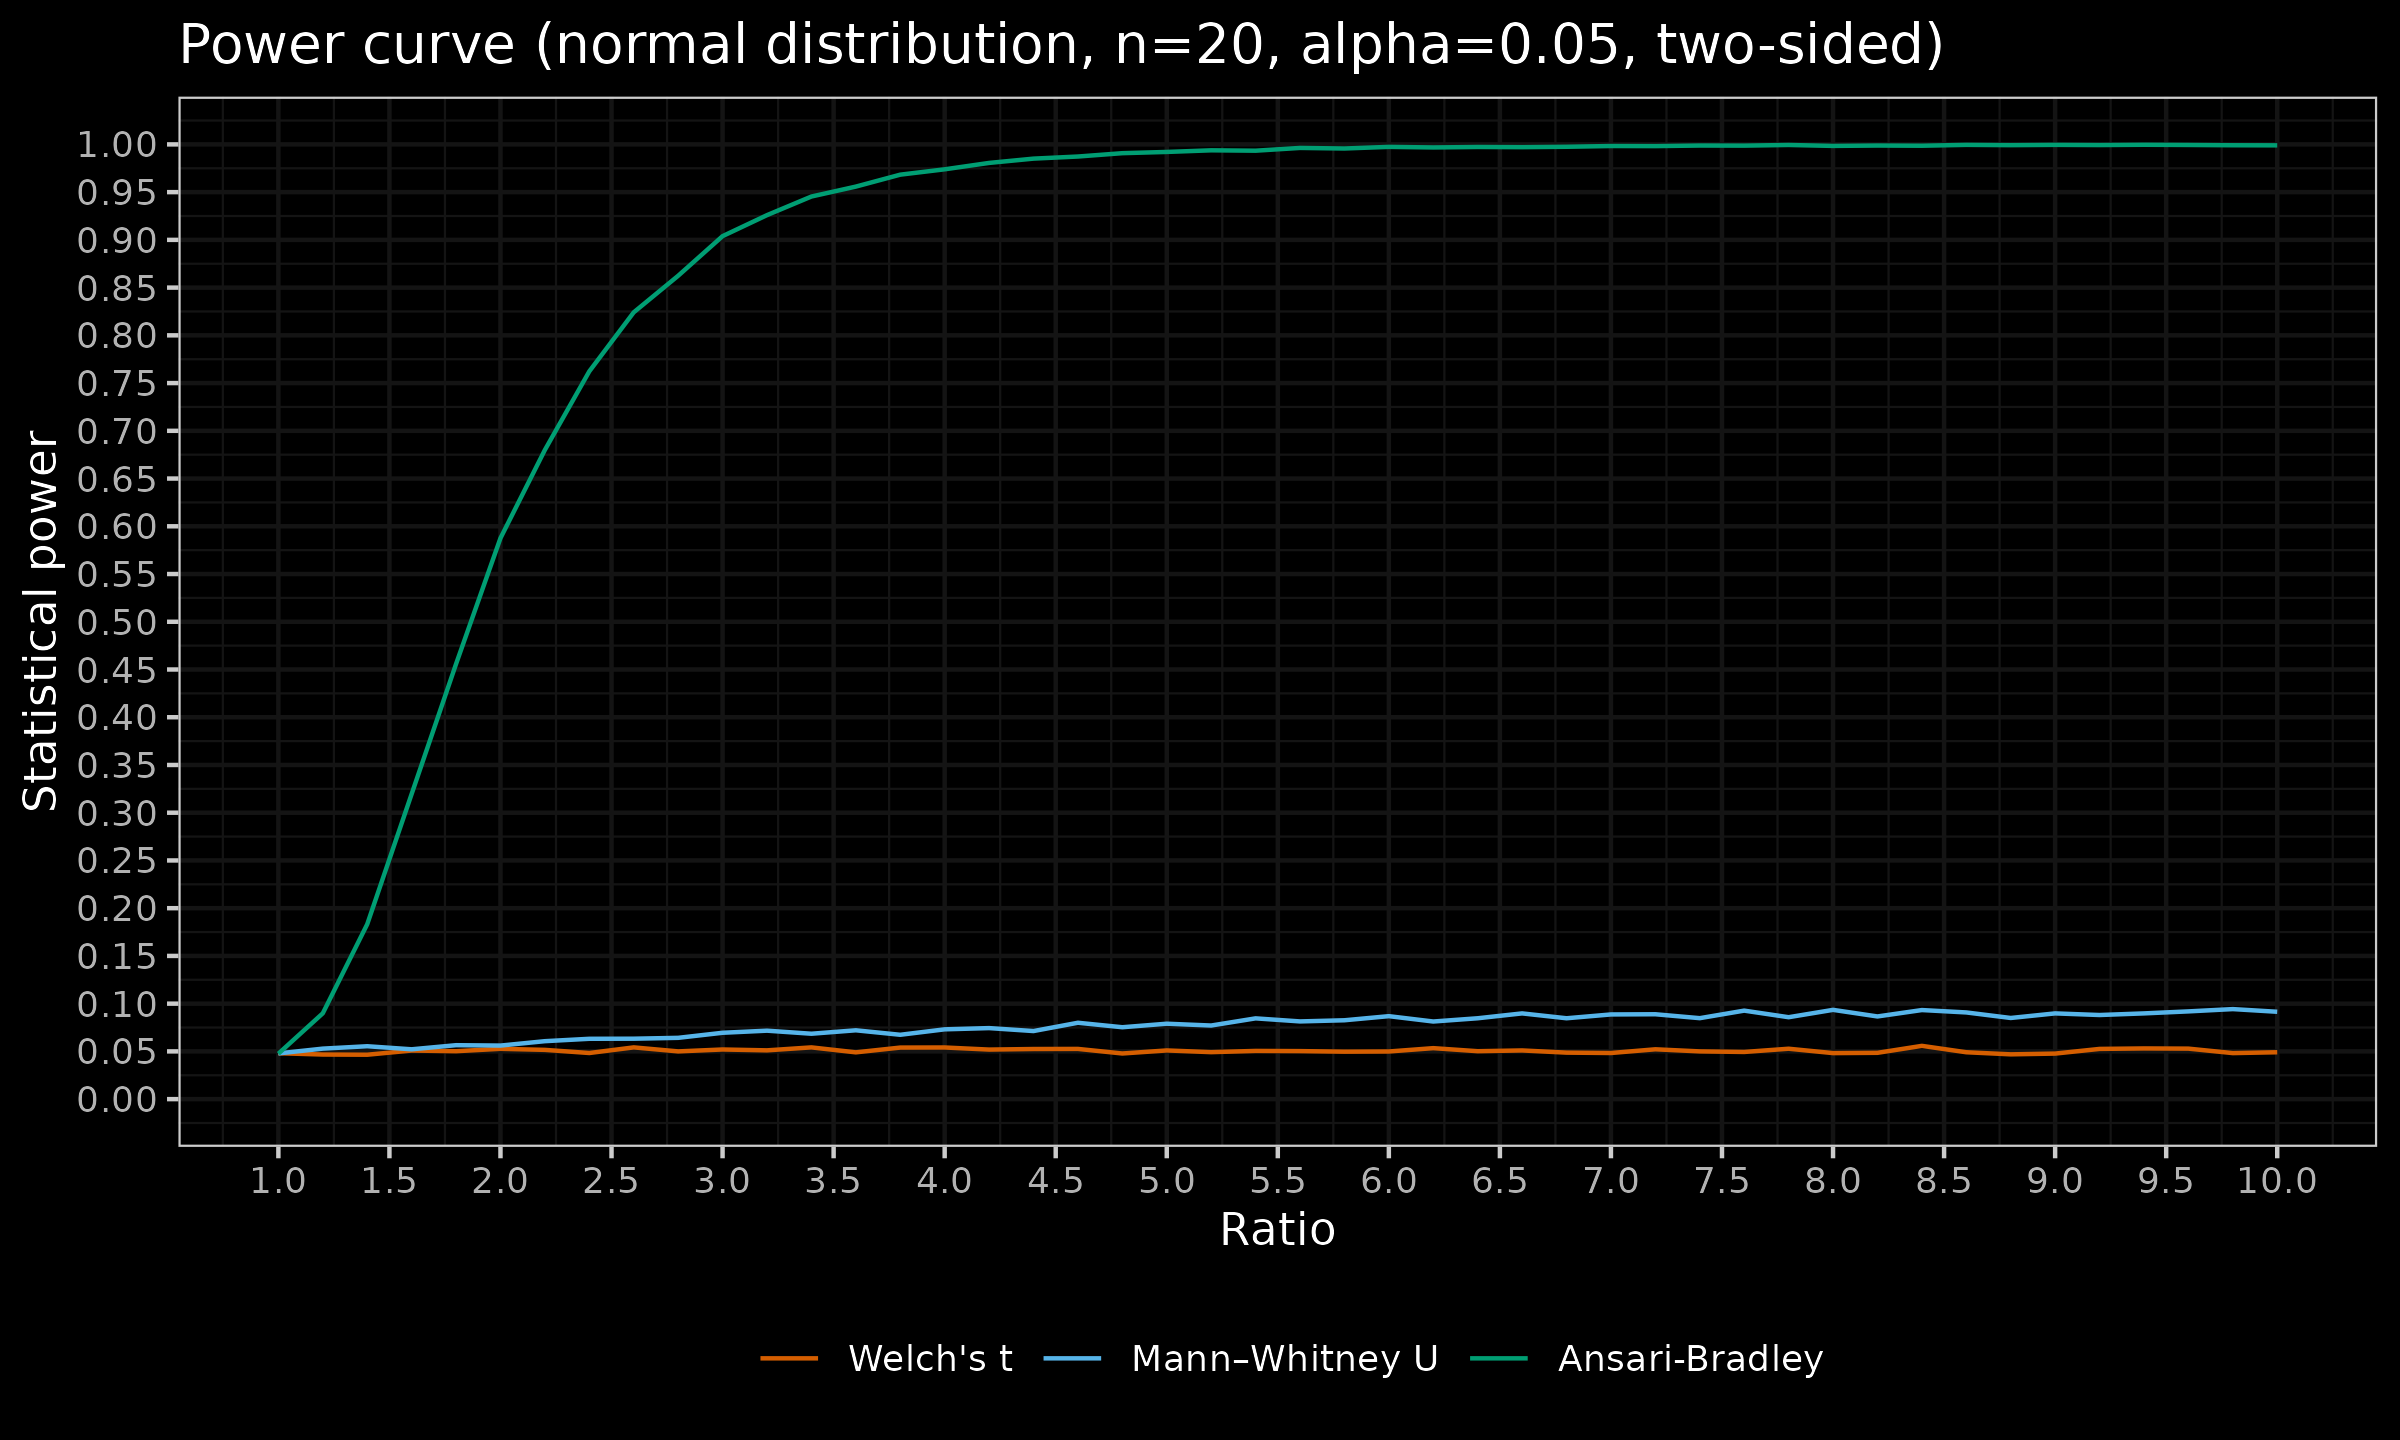
We can make the following observation:
- Welch’s t-test: while this modification of the Student’s t-test is specifically designed for normal distributions with unequal variances, it is still a location test. Since the distribution locations in this simulation are the same, the test maintains its statistical power at $\alpha = 0.05$ regardless of the values of $n$ and $\sigma$.
- Mann-Whitney U test: while this is one of the most popular nonparametric tests, it is not always suitable for all kinds of distribution changes. This test is often mistakenly declared as a test for medians or a test for stochastic greatness. Note that while in the above simulation, both distributions are stochastic equal, the statistical power of the Mann-Whitney U test is higher than $\alpha = 0.05$ for large $n$, $\sigma$. We will discuss this phenomenon in one of the future posts.
- Ansari-Bradley test: this is the only actually suitable test for our problem. The statistical power starts at $\alpha = 0.05$ for $\sigma = 1$ (as it should) and increases while $\sigma$ increases. Expectedly, the higher sample size $n$ gives a better power increase rate and, therefore, higher statistical power for the same value of $\sigma$.