Asymmetric decile-based outlier detector, Part 2
In the previous post, I suggested an asymmetric decile-based outlier detector as an alternative to Tukey’s fences. In this post, we run some numerical simulations to check out the suggested outlier detector in action.
Let $Q_p$ be an estimation of the $p^\textrm{th}$ quantile for the given sample, and $k$ be a parameter of the outlier detector. With this notation, we consider the following range:
$$ [Q_{0.1} - k (Q_{0.5} - Q_{0.1}),\, Q_{0.9} + k (Q_{0.9} - Q_{0.5})] $$All the sample elements outside this range should be considered as outliers.
Now let’s repeat the experiment that I performed for Tukey’s fences according to the following scheme:
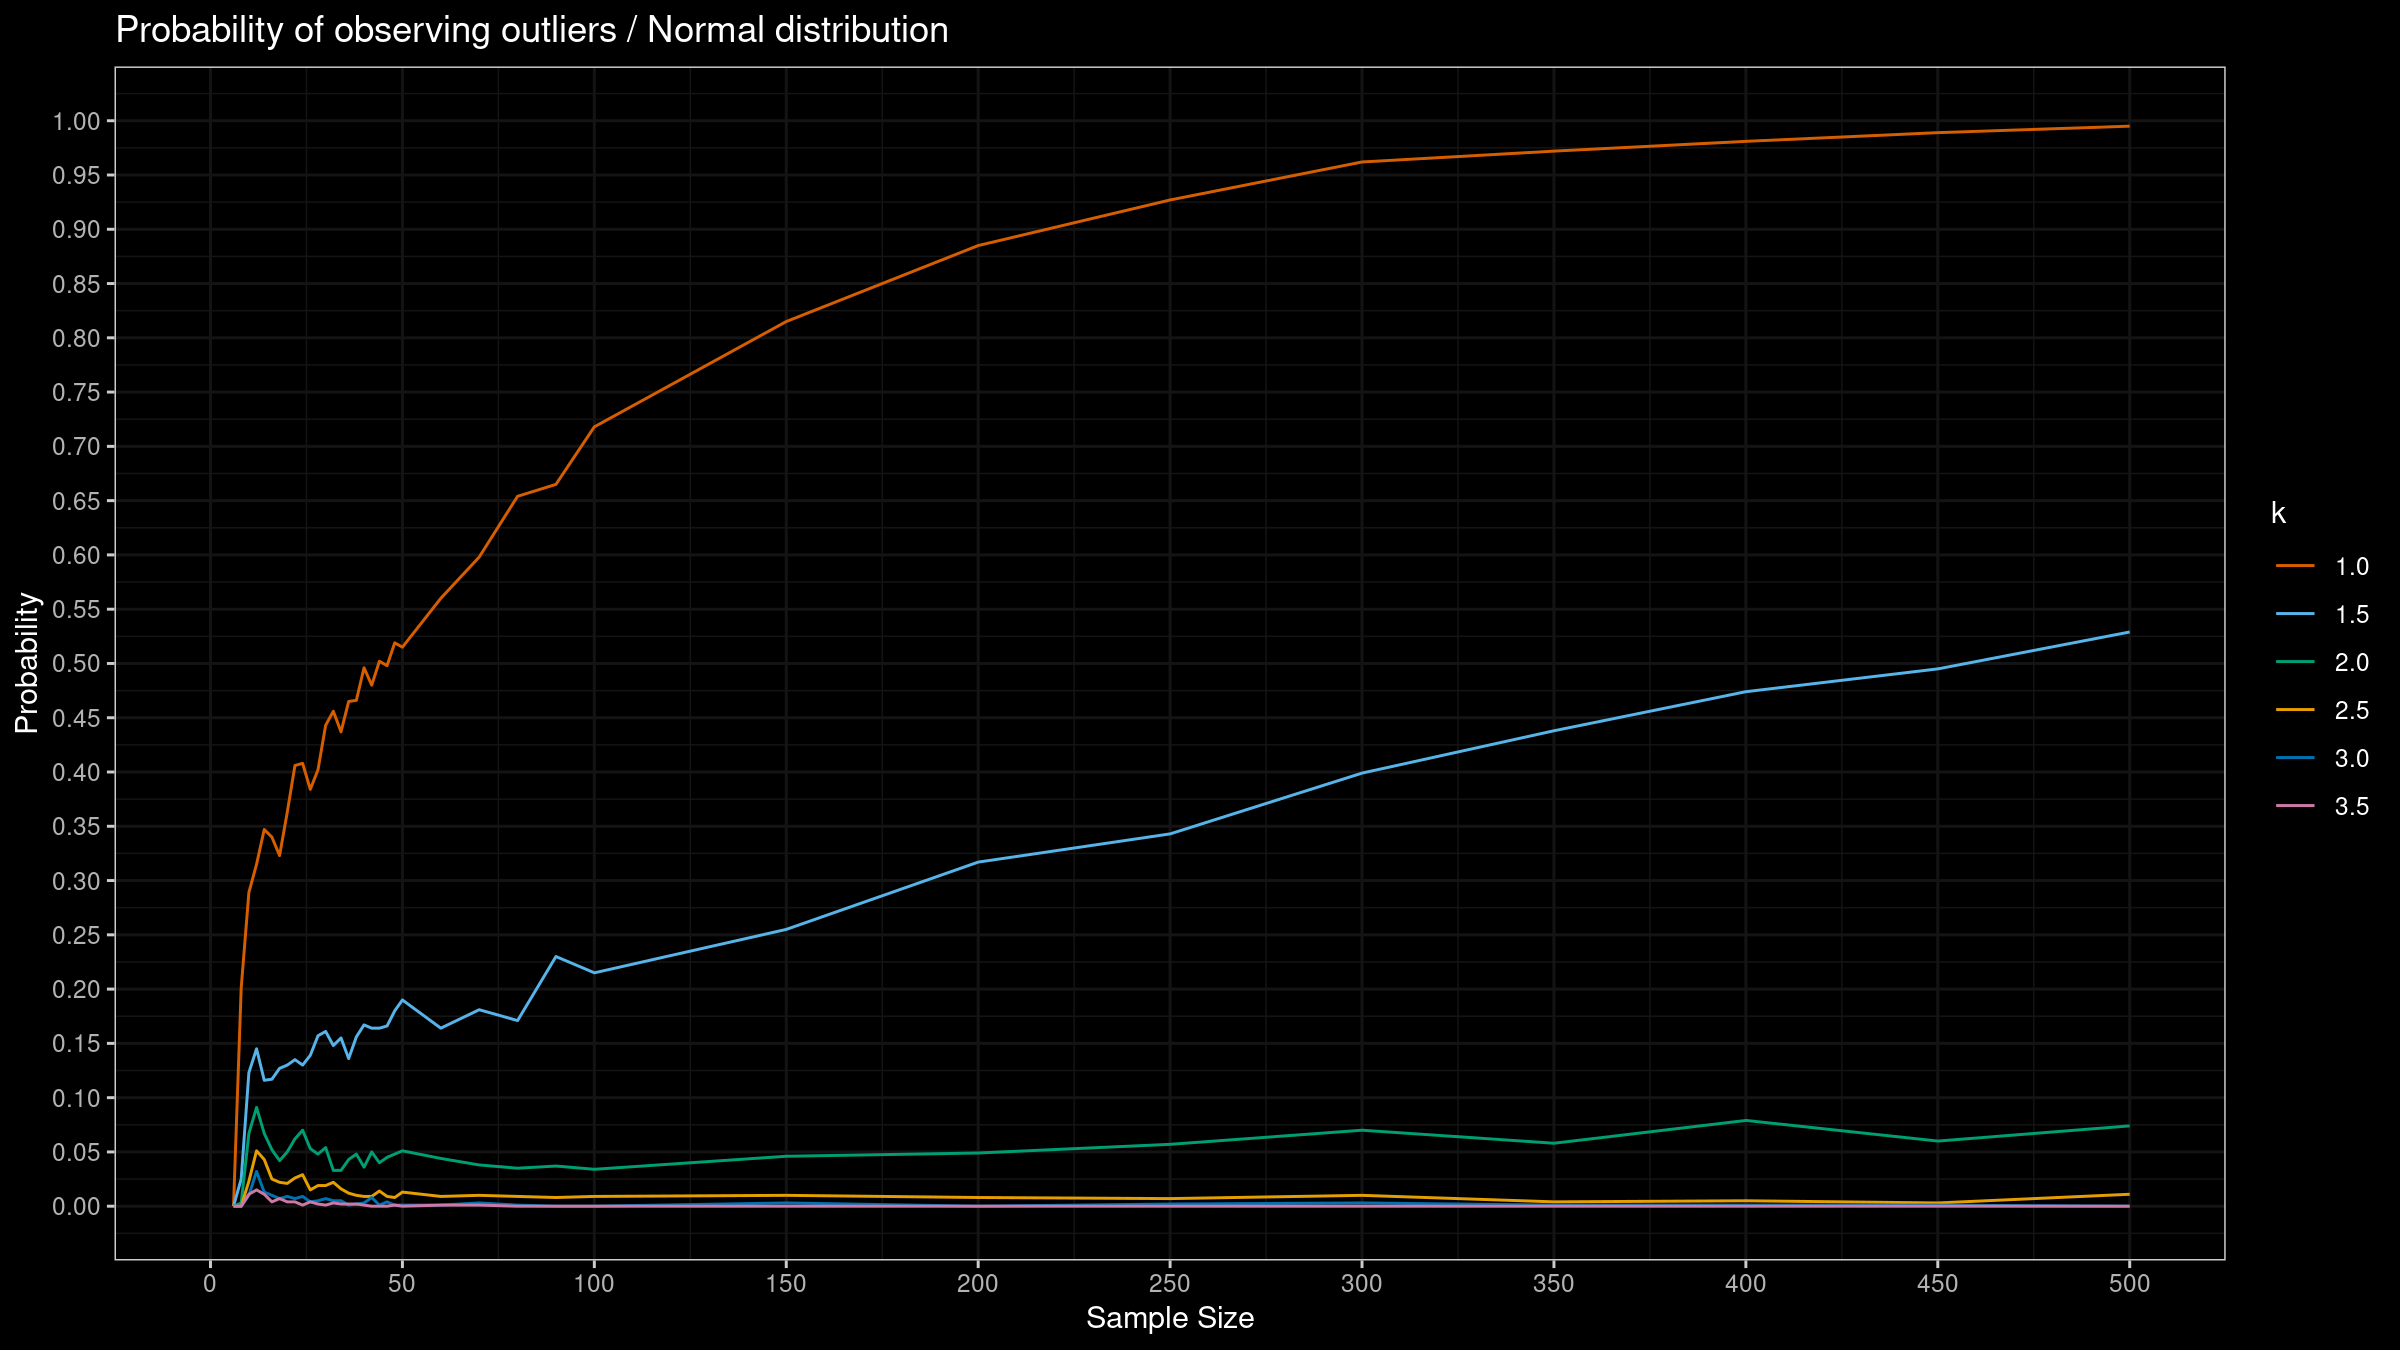
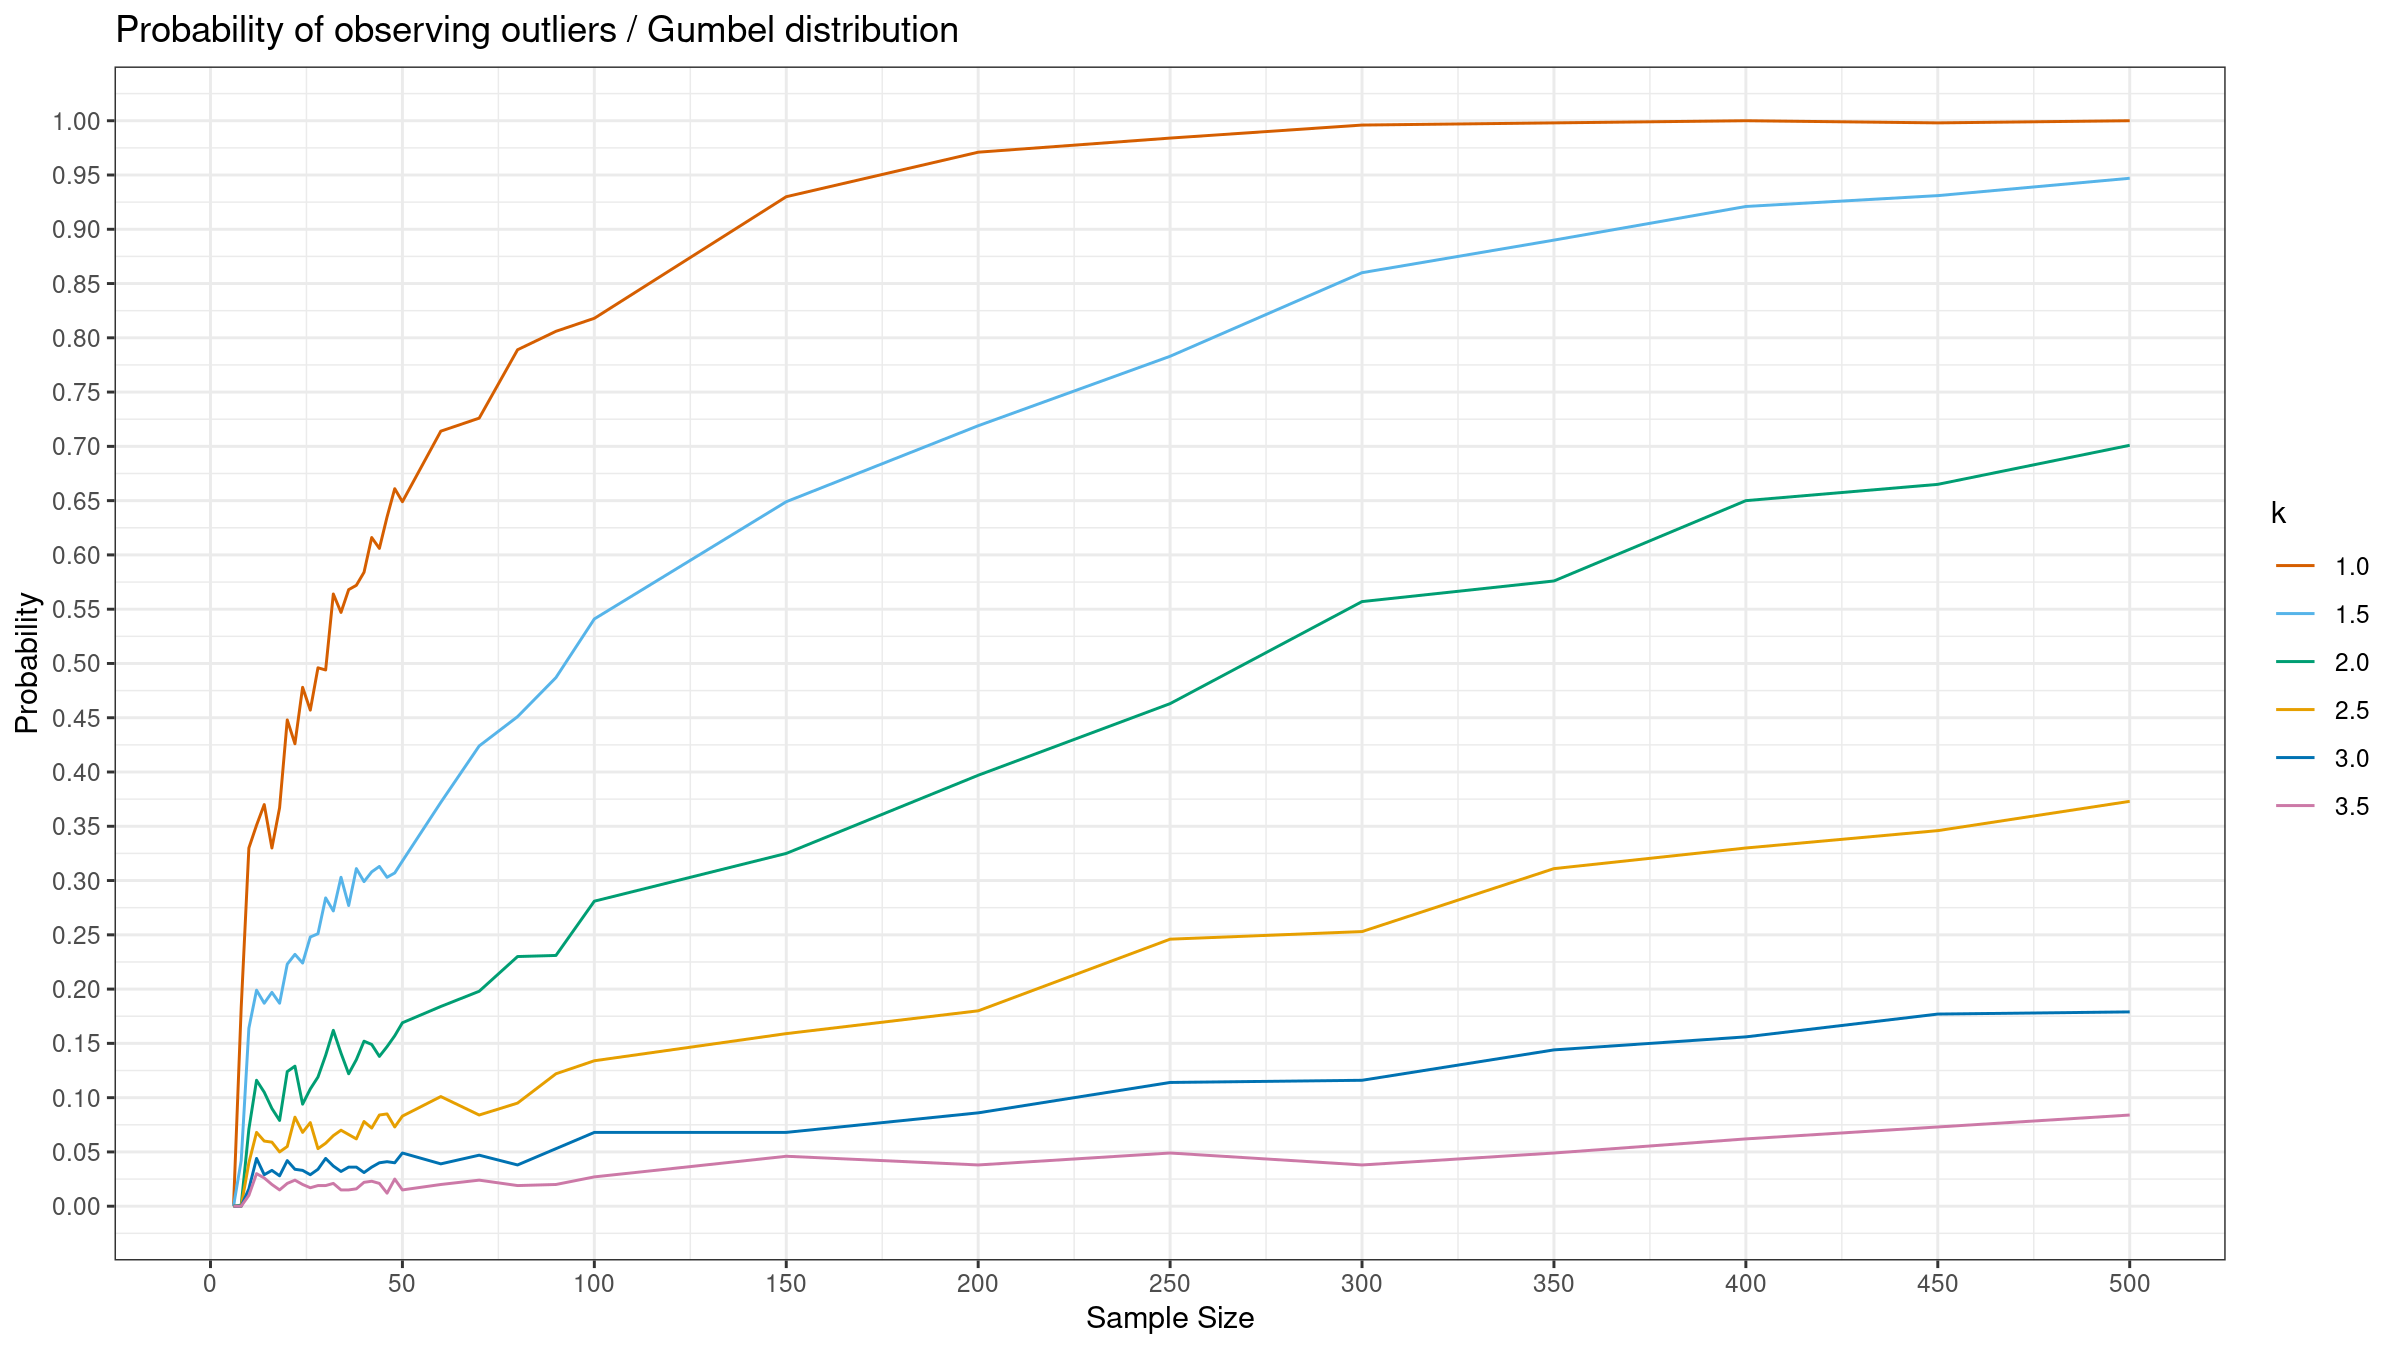
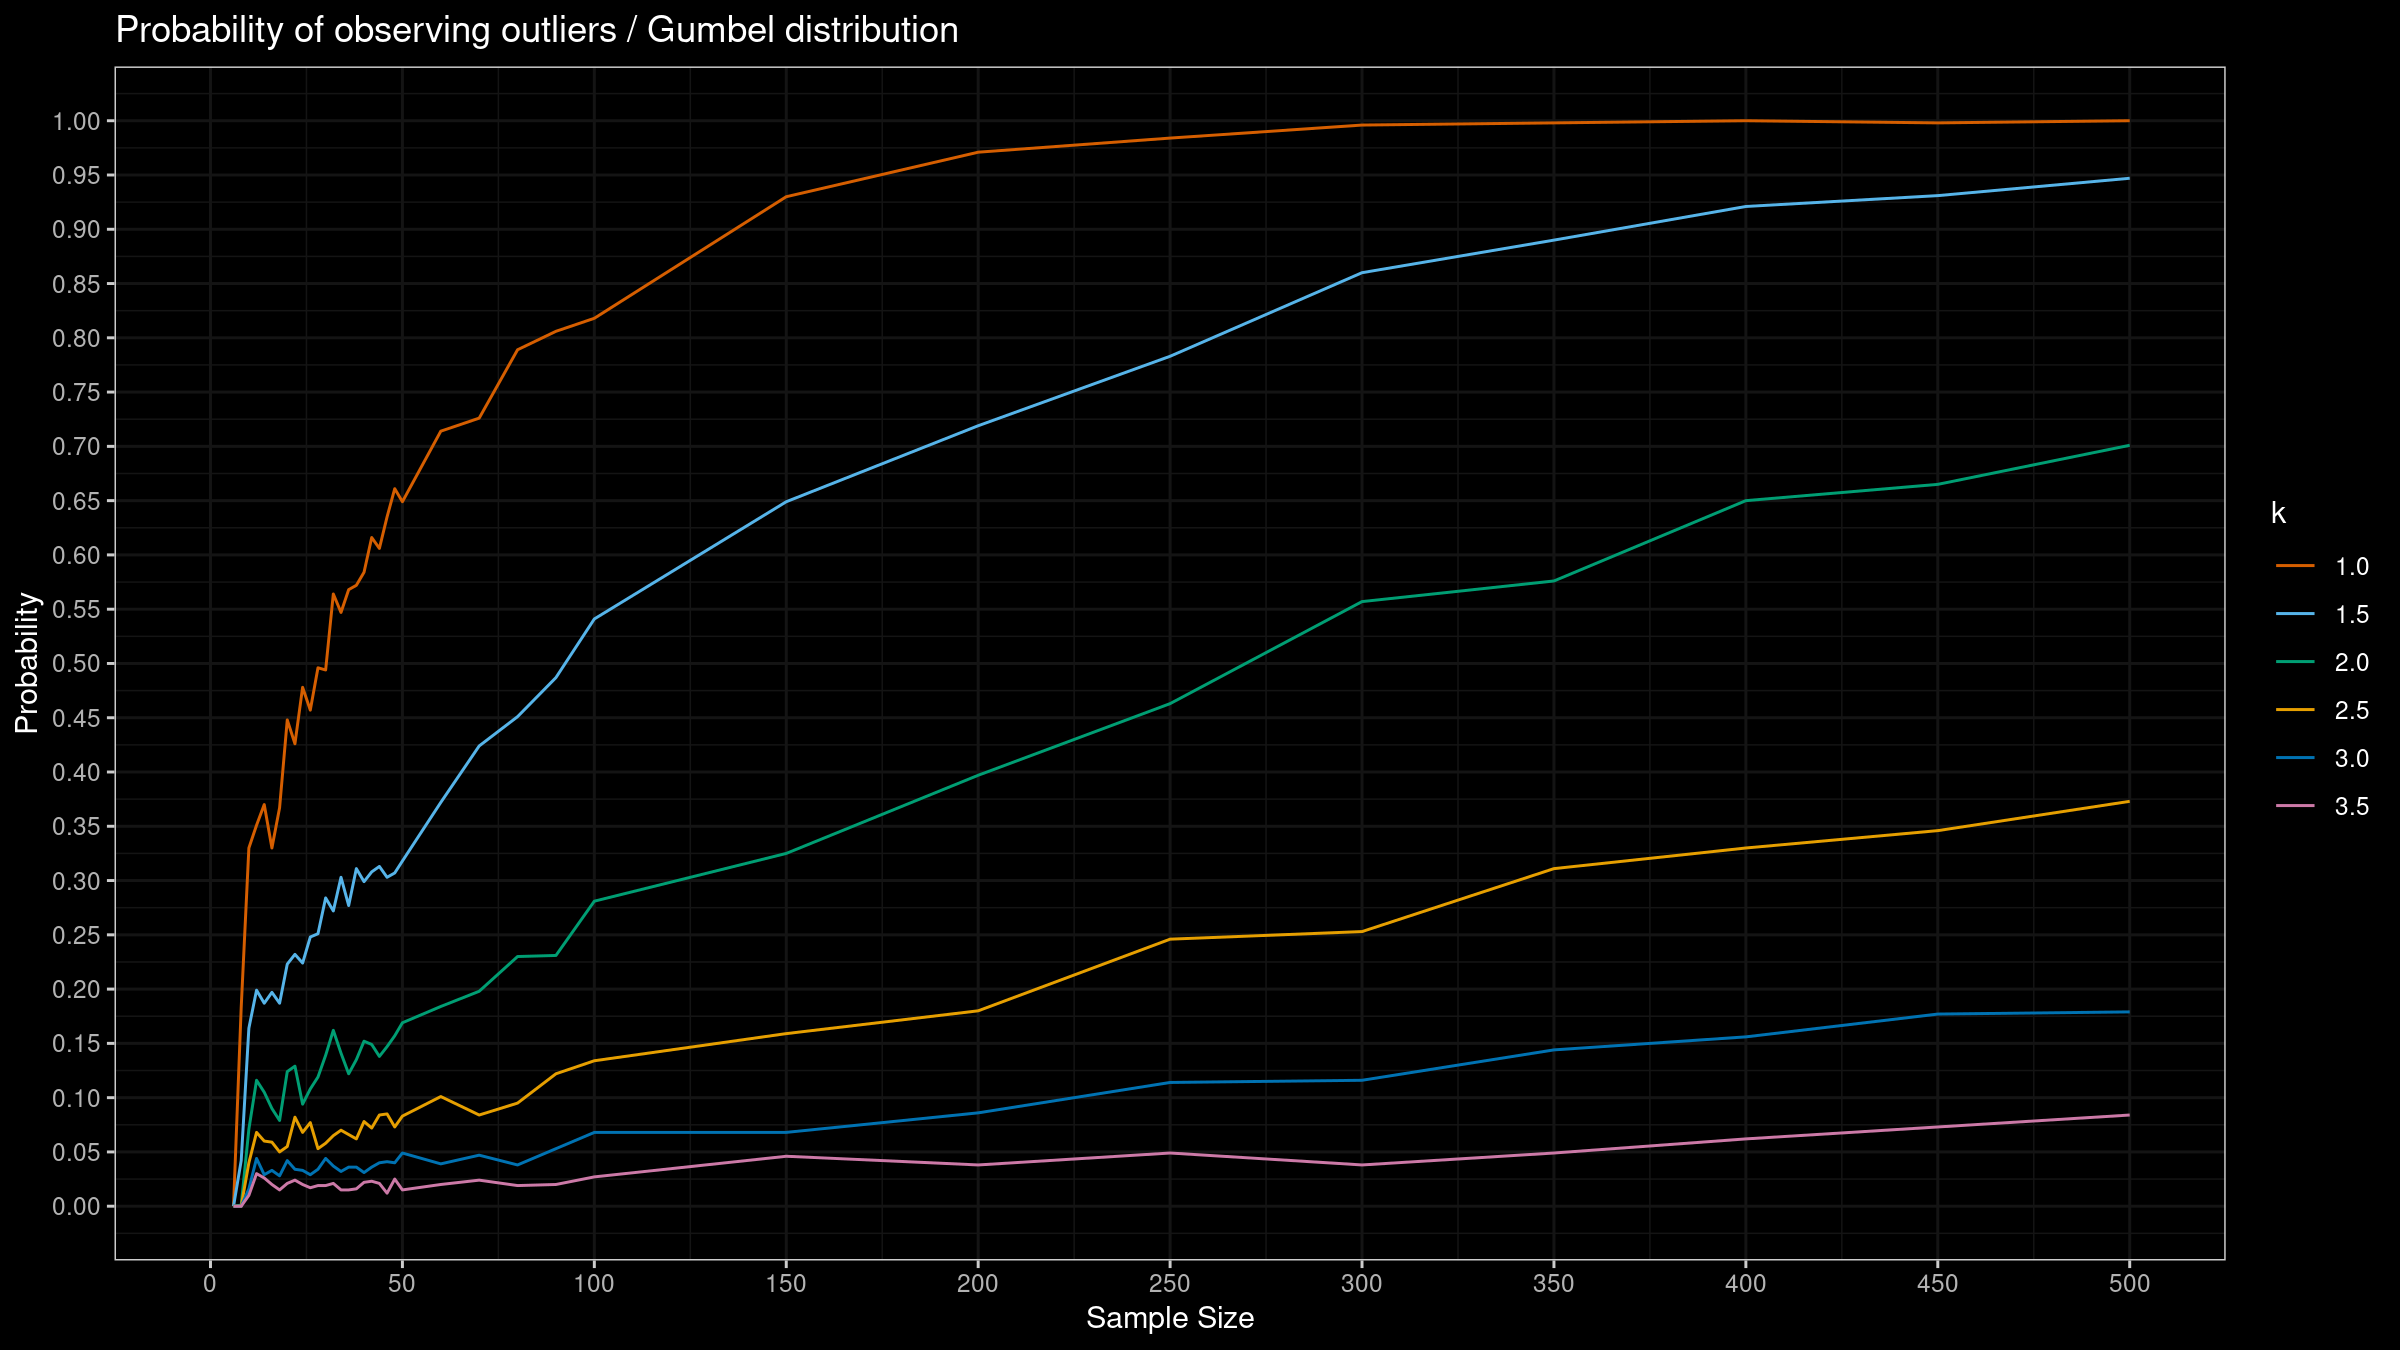
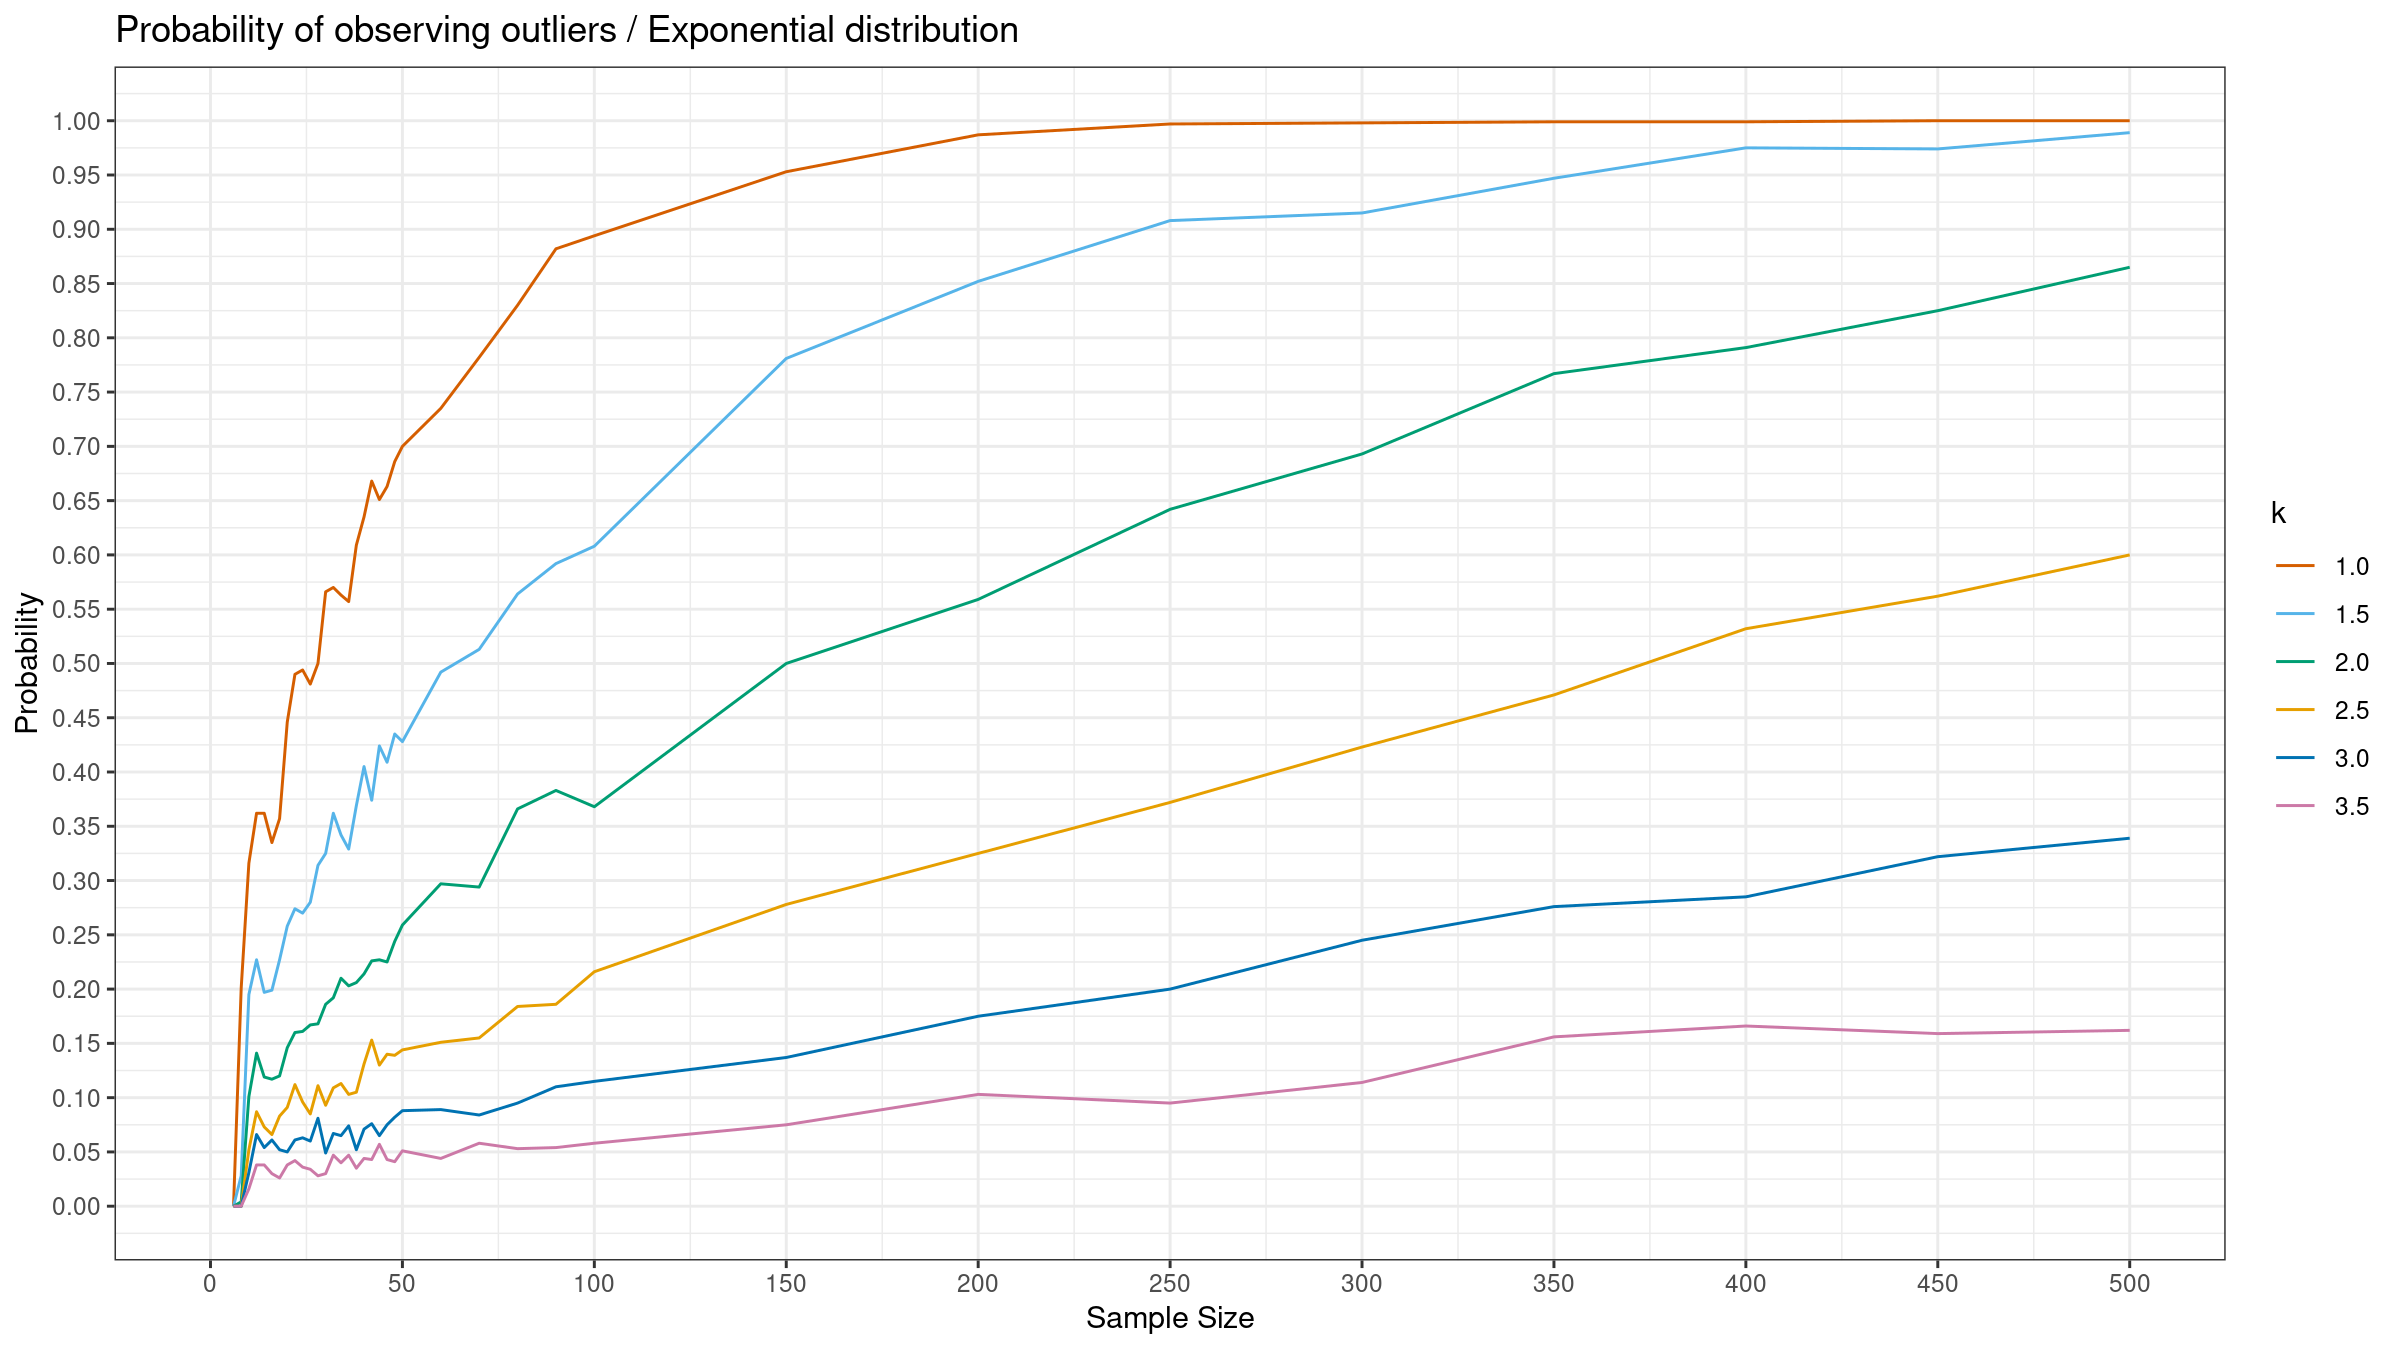
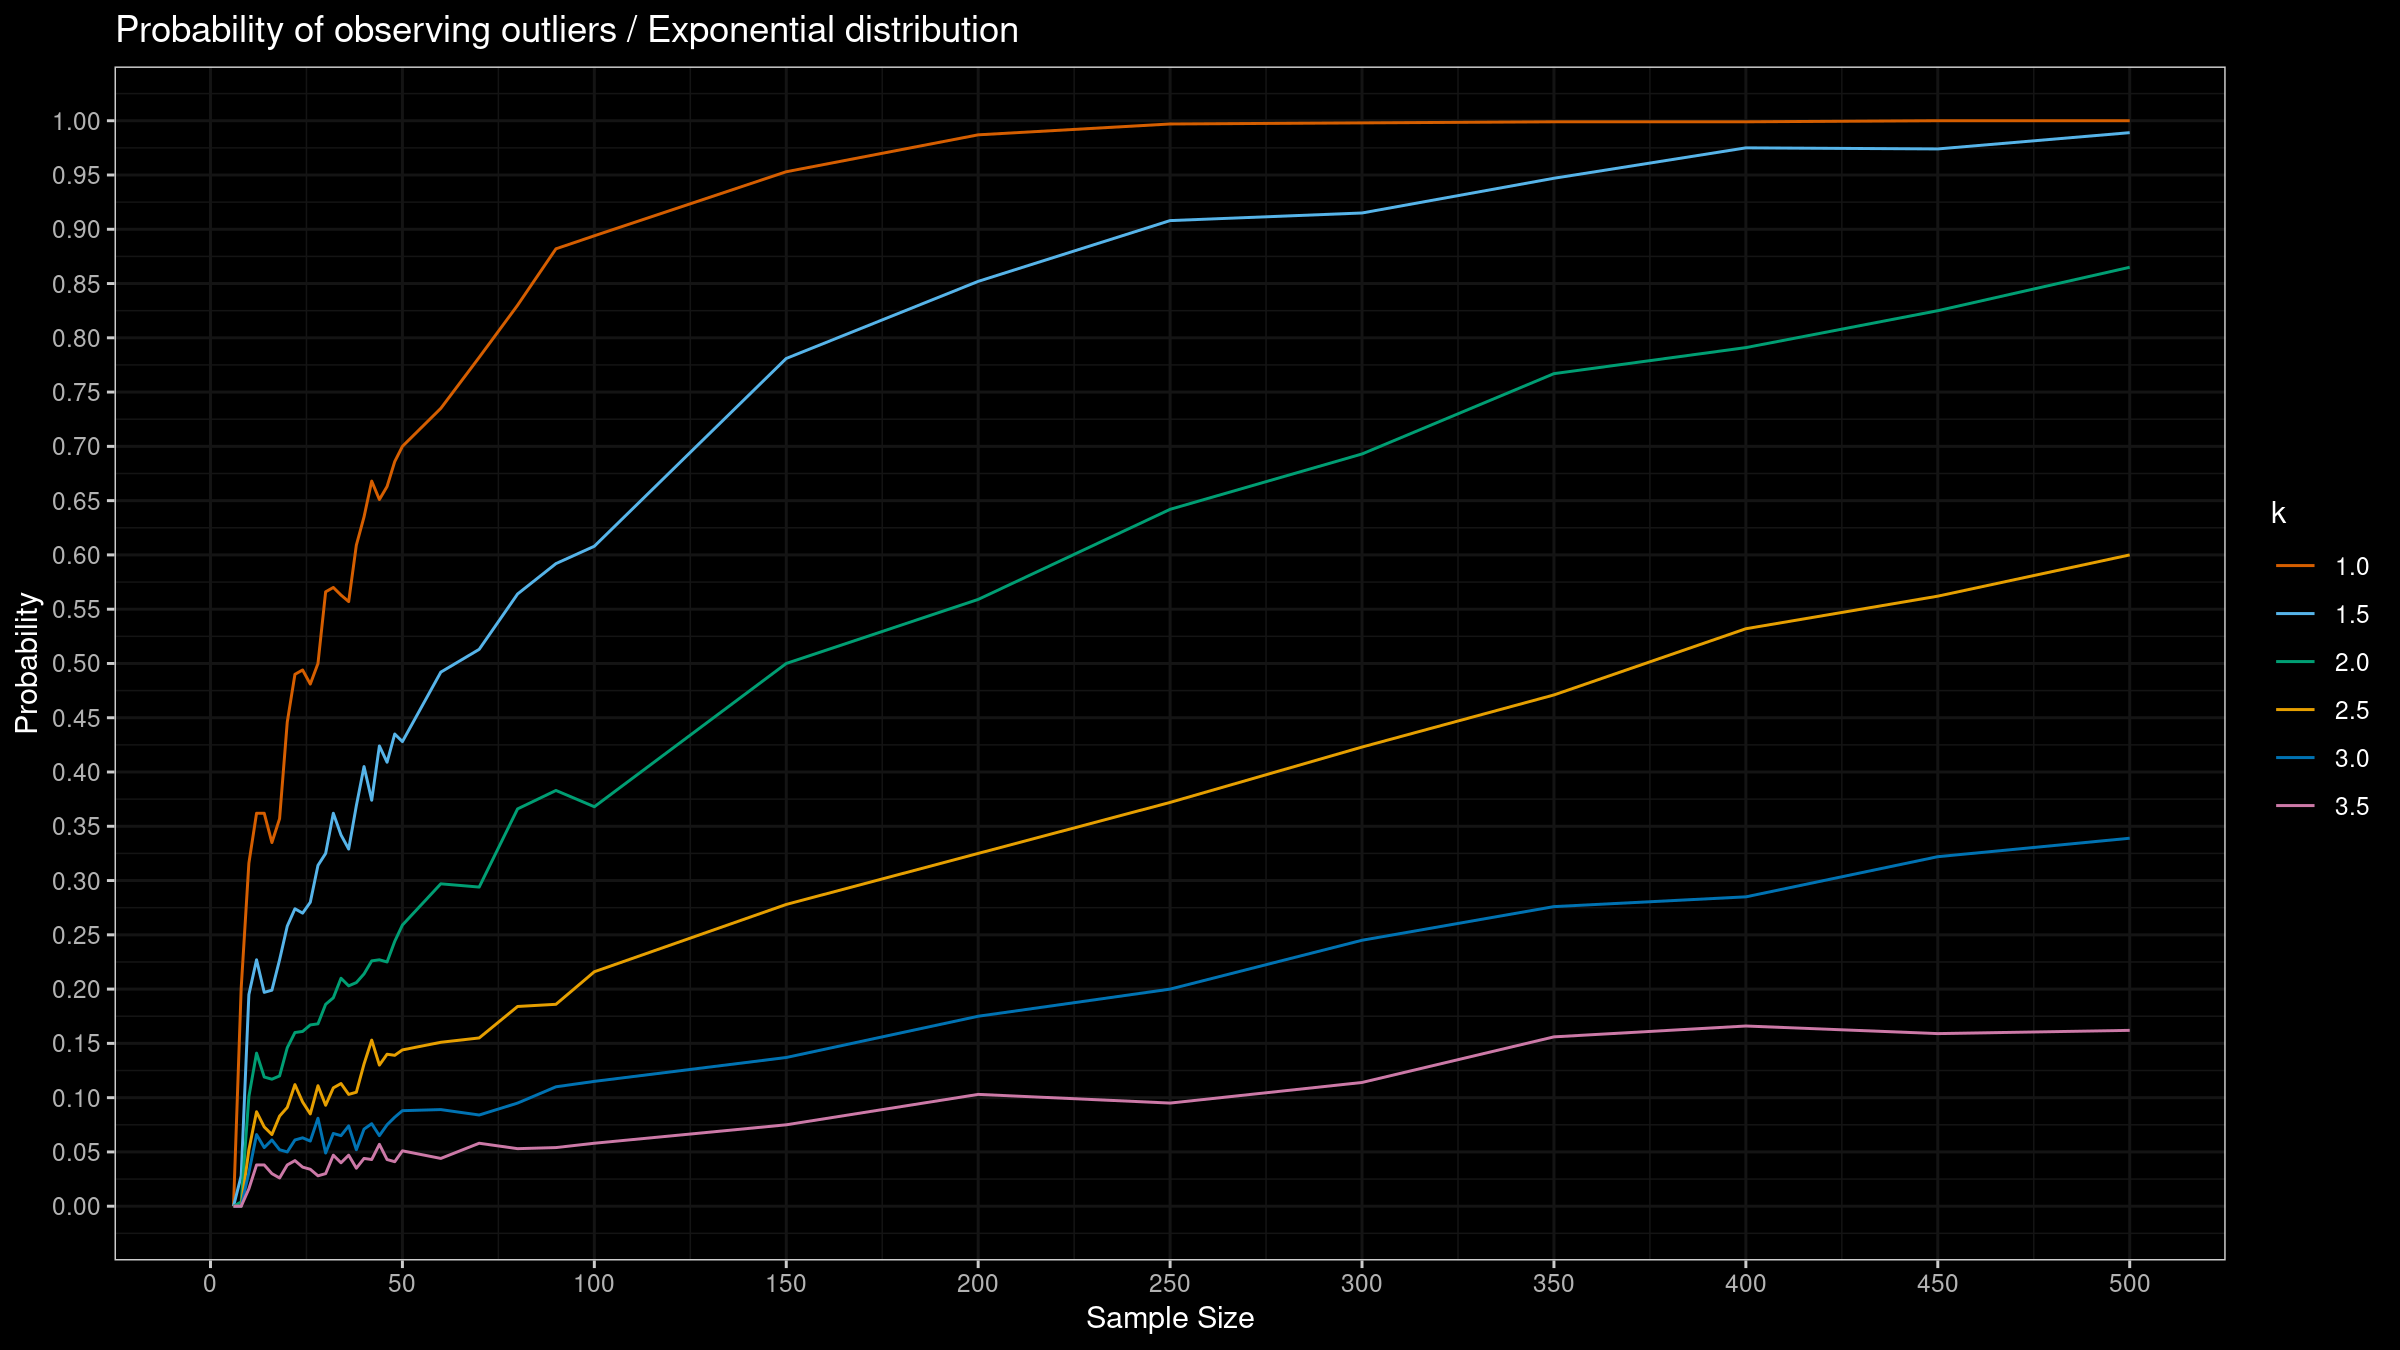
- Enumerate different distributions. We consider the standard normal distribution, the standard Gumbel distribution, and the standard exponential distribution.
- Enumerate different $k$ values. We consider $k \in \{ 1.0, 1.5, 2.0, 2.5, 3.0, 3.5 \}$.
- Enumerate different samples sizes from 6 to 500.
- Generate 1000 random samples from the given distribution of the given size.
- For each sample, detect outliers using the considered $k$ values.
- Evaluate the percentage of samples that contain at least one outlier.
Here are the results: