BenchmarkDotNet v0.10.12
BenchmarkDotNet v0.10.12 has been released! This release includes:
- Improved DisassemblyDiagnoser: BenchmarkDotNet contains an embedded disassembler so that it can print assembly code for all benchmarks; it’s not easy, but the disassembler evolves in every release.
- Improved MemoryDiagnoser: it has a better precision level, and it takes less time to evaluate memory allocations in a benchmark.
- New TailCallDiagnoser: now you get notifications when JIT applies the tail call optimizations to your methods.
- Better environment info: when your share performance results, it’s very important to share information about your environment. The library generates the environment summary for you by default. Now it contains information about the amount of physical CPU, physical cores, and logic cores. If you run a benchmark on a virtual machine, you will get the name of the hypervisor (e.g., Hyper-V, VMware, or VirtualBox).
- Better summary table: one of the greatest features of BenchmarkDotNet is the summary table. It shows all important information about results in a compact and understandable form. Now it has better customization options: you can display relative performance of different environments (e.g., compare .NET Framework and .NET Core) and group benchmarks by categories.
- New GC settings: now we support
NoAffinitize,HeapAffinitizeMask,HeapCount. - Other minor improvements and bug fixes
Diagnosers
Diagnosers are helpers which print additional information about your benchmarks.
Improved DisassemblyDiagnoser
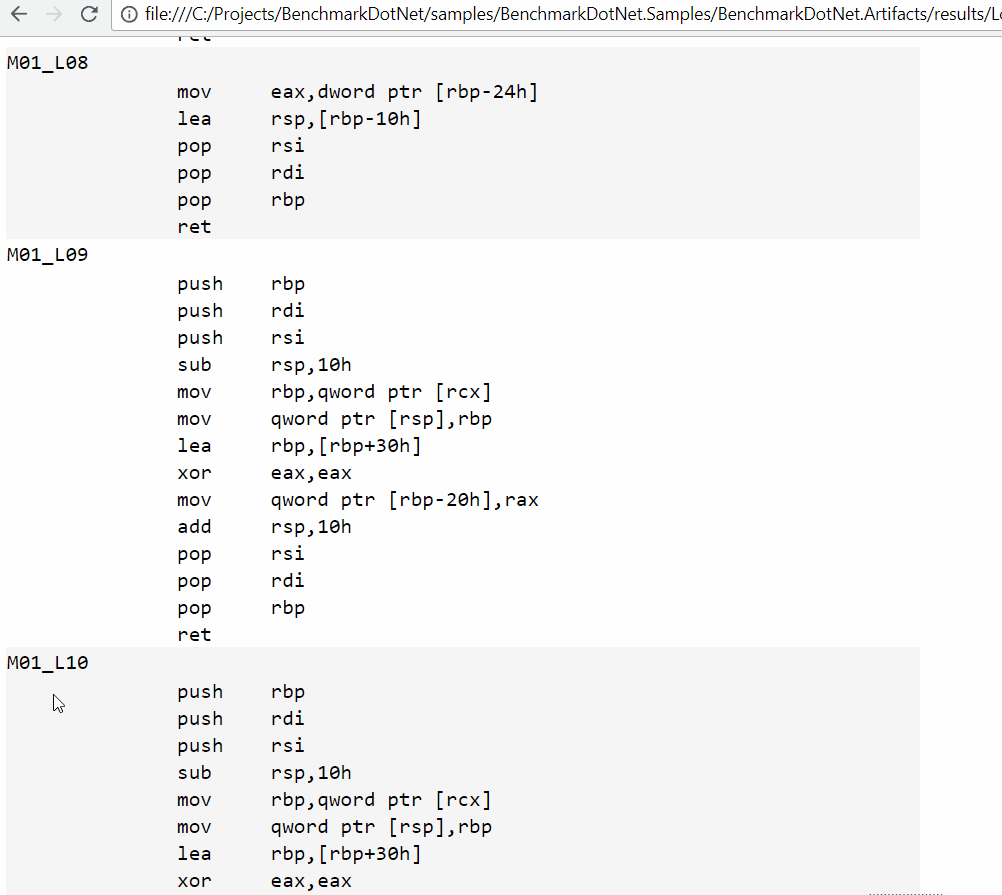
DisassemblyDiagnoser prints an assembly listing for your source code.
We already had this feature, but we continue to improve it.
Our goal is not just to provide a raw info about your code, but provide a comfortable way to explore the program internals.
In v0.10.12, Adam Sitnik (@adamsitnik) implemented
advanced support of labels for jump targets.
- When user hovers over a label, the mouse cursor changes to pointer and label get’s highlighted
- When user clicks a label, all usages gets highlighted
- When user presses F3, we jump to next usage of given label
Demo:
Improved MemoryDiagnoser
MemoryDiagnoser show the memory traffic for each benchmark and the GC collection count for each generation.
In this release, we improved accuracy and
reduce the total time which you should spend to get the results.
New TailCallDiagnoser
@GeorgePlotnikov implemented TailCallDiagnoser which
detects tail call optimizations and prints information about it.
This feature should be useful for F# developers.
Currently, it has some restrictions: it works only for x64 programs, and it’s Windows-only.
Demo:
[Diagnostics.Windows.Configs.TailCallDiagnoser]
[LegacyJitX86Job, LegacyJitX64Job, RyuJitX64Job]
public class Jit_TailCalling
{
    [Benchmark]
    public long Calc()
        => FactorialWithoutTailing(7) - FactorialWithTailing(7);

    private static long FactorialWithoutTailing(int depth)
        => depth == 0 ? 1 : depth * FactorialWithoutTailing(depth - 1);

    private static long FactorialWithTailing(int pos, int depth)
        => pos == 0 ? depth : FactorialWithTailing(pos - 1, depth * pos);

    private static long FactorialWithTailing(int depth)
        => FactorialWithTailing(1, depth);
}
TailCallDiagnosers prints the following lines:
// * Diagnostic Output - TailCallDiagnoser *
--------------------

--------------------
Jit_TailCalling.Calc: LegacyJitX64(Jit=LegacyJit, Platform=X64, Runtime=Clr)
--------------------

--------------------
Jit_TailCalling.Calc: LegacyJitX86(Jit=LegacyJit, Platform=X86, Runtime=Clr)
--------------------

--------------------
Jit_TailCalling.Calc: RyuJitX64(Jit=RyuJit, Platform=X64)
--------------------
Caller: <null>.<null> - <null>
Callee: BenchmarkDotNet.Samples.JIT.Jit_TailCalling.FactorialWithTailing - int64  (int32,int32)
Tail prefix: False
Tail call type: RecursiveLoop
-------------------
Better environment info
One of the most important parts of any performance report is the environment information. People should understand what kind of machine did you use for your benchmarks.
Irina Ananyeva (@morgan-kn) implemented a cool feature
which displays the amount of physical CPU, logical cores, and physical cores (an example: 1 CPU, 8 logical cores and 4 physical cores).
Now the environment info section looks like this (it works on Windows/Linux/macOS; .NET Framework/.NET Core/Mono):
BenchmarkDotNet=v0.10.12, OS=Windows 10 Redstone 3 [1709, Fall Creators Update] (10.0.16299.192)
Intel Core i7-6700HQ CPU 2.60GHz (Skylake), 1 CPU, 8 logical cores and 4 physical cores
Frequency=2531249 Hz, Resolution=395.0619 ns, Timer=TSC
.NET Core SDK=2.0.3
  [Host] : .NET Core 2.0.3 (Framework 4.6.25815.02), 64bit RyuJIT
  Clr    : .NET Framework 4.7 (CLR 4.0.30319.42000), 64bit RyuJIT-v4.7.2600.0
  Core   : .NET Core 2.0.3 (Framework 4.6.25815.02), 64bit RyuJIT
  Mono   : Mono 5.4.0 (Visual Studio), 64bit
Some people run benchmarks on virtual machines instead of real hardware,
and it’s also an important fact.
With a new feature by Łukasz Pyrzyk (@lukasz-pyrzyk),
a special label (like VM=VirtualBox) will be automatically added to the result.
Better summary table
The summary table tries to help you understand performance data in a quick way. In the old versions of BenchmarkDotNet, you can mark a method as a baseline and get “scaled” performance values for all other methods. In v0.10.12 (thanks Marc Gravell (@mgravell) for the idea)), you can introduce several baselines in a class (if you are using the benchmark categories) or mark a job as a baseline (it allows evaluating the relative performance of different environments).
Let’s look at a few examples.
Example 1: Methods
You can mark a method as a baseline with the help of [Benchmark(Baseline = true)].
public class Sleeps
{
    [Benchmark]
    public void Time50() => Thread.Sleep(50);

    [Benchmark(Baseline = true)]
    public void Time100() => Thread.Sleep(100);

    [Benchmark]
    public void Time150() => Thread.Sleep(150);
}
As a result, you will have additional Scaled column in the summary table:
|  Method |      Mean |     Error |    StdDev | Scaled |
|-------- |----------:|----------:|----------:|-------:|
|  Time50 |  50.46 ms | 0.0779 ms | 0.0729 ms |   0.50 |
| Time100 | 100.39 ms | 0.0762 ms | 0.0713 ms |   1.00 |
| Time150 | 150.48 ms | 0.0986 ms | 0.0922 ms |   1.50 |
Example 2: Methods with categories
The only way to have several baselines in the same class is to separate them by categories.
and mark the class with [GroupBenchmarksBy(BenchmarkLogicalGroupRule.ByCategory)].
[GroupBenchmarksBy(BenchmarkLogicalGroupRule.ByCategory)]
[CategoriesColumn]
public class Sleeps
{
    [BenchmarkCategory("Fast"), Benchmark(Baseline = true)]
    public void Time50() => Thread.Sleep(50);

    [BenchmarkCategory("Fast"), Benchmark]
    public void Time100() => Thread.Sleep(100);

    [BenchmarkCategory("Slow"), Benchmark(Baseline = true)]
    public void Time550() => Thread.Sleep(550);

    [BenchmarkCategory("Slow"), Benchmark]
    public void Time600() => Thread.Sleep(600);
}
Results:
|  Method | Categories |      Mean |     Error |    StdDev | Scaled |
|-------- |----------- |----------:|----------:|----------:|-------:|
|  Time50 |       Fast |  50.46 ms | 0.0745 ms | 0.0697 ms |   1.00 |
| Time100 |       Fast | 100.47 ms | 0.0955 ms | 0.0893 ms |   1.99 |
|         |            |           |           |           |        |
| Time550 |       Slow | 550.48 ms | 0.0525 ms | 0.0492 ms |   1.00 |
| Time600 |       Slow | 600.45 ms | 0.0396 ms | 0.0331 ms |   1.09 |
Example 3: Jobs
If you want to compare several runtime configurations,
you can mark one of your jobs with isBaseline = true.
[ClrJob(isBaseline: true)]
[MonoJob]
[CoreJob]
public class RuntimeCompetition
{
    [Benchmark]
    public int SplitJoin() => string.Join(",", new string[1000]).Split(',').Length;
}
Results:
    Method | Runtime |     Mean |     Error |    StdDev | Scaled | ScaledSD |
---------- |-------- |---------:|----------:|----------:|-------:|---------:|
 SplitJoin |     Clr | 19.42 us | 0.2447 us | 0.1910 us |   1.00 |     0.00 |
 SplitJoin |    Core | 13.00 us | 0.2183 us | 0.1935 us |   0.67 |     0.01 |
 SplitJoin |    Mono | 39.14 us | 0.7763 us | 1.3596 us |   2.02 |     0.07 |
New GC Settings
BenchmarkDotNet allows configuring GC Settings for each job.
Now we support a few additional settings:
NoAffinitize, HeapAffinitizeMask, HeapCount.
If you set them, the library generates app.config like this:
<configuration>
   <runtime>
      <GCHeapCount enabled="6"/>
      <GCNoAffinitize enabled="true"/>
      <GCHeapAffinitizeMask enabled="144"/>
   </runtime>
</configuration>
See the MSDN page for details.
Milestone details
In the v0.10.12 scope, 14 issues were resolved and 10 pull requests where merged. This release includes 42 commits by 9 contributors.
Resolved issues (14)
- #273 Create a tail call diagnoser
- #543 Run Disassembly Diagnoser without extra run (assignee: @adamsitnik)
- #546 Synthesizing labels for jump targets (assignee: @adamsitnik)
- #574 Display VM hypervisor in summary section (assignee: @lukasz-pyrzyk)
- #582 Print amount of logical and physical core (assignee: @morgan-kn)
- #599 Proper HTML escaping of BenchmarkAttribute Description
- #606 Improve Memory Diagnoser (assignee: @adamsitnik)
- #608 Properly escaping generated markdown (assignee: @AndreyAkinshin)
- #612 Disassembler DisassembleMethod fails with “Object reference not set to an instance of an object.”, (assignee: @adamsitnik)
- #617 Allow baseline per category (assignee: @AndreyAkinshin)
- #618 Enable ApprovalTests in .NET Core 2.0 tests (assignee: @AndreyAkinshin)
- #621 Try to search for missing references if build fails (assignee: @adamsitnik)
- #622 Support of new GC settings (assignee: @adamsitnik)
- #623 RPlotExporter uses wrong path to csv measurements (assignee: @AndreyAkinshin)
Merged pull requests (10)
- #573 Сreate a tail call diagnoser (by @GeorgePlotnikov)
- #576 Display VM name in summary section, fixes #574 (by @lukasz-pyrzyk)
- #595 Migrate all project to new project system. (by @mfilippov)
- #598 Added info about the new TailCallDiagnoser (by @GeorgePlotnikov)
- #603 Fix HTML Encoding for Html Exporter (by @Chrisgozd)
- #605 Grammar (by @onionhammer)
- #607 Print amount of logical and physical core #582 (by @morgan-kn)
- #615 Quick fix Disassembler.Program.GetMethod when more than one method found just return null (by @nietras)
- #619 Logical group support, fixes #617 (by @AndreyAkinshin)
- #620 New README.md (by @AndreyAkinshin)
Commits (42)
- 6f587d Migrate all project to new project system. (by @mfilippov)
- 47ba57 added info about the new TailCallDiagnoser (by @GeorgePlotnikov)
- c1a4b2 Сreate a tail call diagnoser (#573) (by @GeorgePlotnikov)
- ebe3e2 Merge pull request #598 from GeorgePlotnikov/patch-1 (by @adamsitnik)
- 6249f0 some polishing of the JIT diagnosers (by @adamsitnik)
- 119231 Fix HTML Encoding for Html Exporter (#603), fixes #599 (by @Chrisgozd)
- fe3f30 Disassembly Prettifier, fixes #546 (by @adamsitnik)
- 3eb63f Merge pull request #595 from mfilippov/new-fs-vb-proj (by @adamsitnik)
- 16d03f make our F# samples work for .NET Core 2.0 (by @adamsitnik)
- d06de7 bring back our old Visual Basic and F# integration tests (by @adamsitnik)
- 63249b “Kaby Lake R” and “Coffee Lake” support in ProcessorBrandStringHelper (by @AndreyAkinshin)
- a8a09e disassembly prettifier: highlighting references to labels, jumping to next on… (by @adamsitnik)
- e6d747 Grammar (by @onionhammer)
- fef4aa Merge pull request #605 from onionhammer/patch-1 (by @adamsitnik)
- ffacd7 don’t require extra run for DisassemblyDiagnoser, fixes #543, #542 (by @adamsitnik)
- bcac26 revert last commit change (run global setup regardless of Jitting) (by @adamsitnik)
- 3e87d8 don’t perform an extra run to get GC stats for .NET Core, part of #550 (by @adamsitnik)
- f87dbc obtain GC stats in separate iteration run, no overhead, support for iteration… (by @adamsitnik)
- e5fe0f update to C# 7.1 so we can use all the latest features (by @adamsitnik)
- bc50b2 build benchmarks in Parallel, part of #550 (by @adamsitnik)
- e59590 Display VM name in summary section, fixes #574 (#576) (by @lukasz-pyrzyk)
- 8908f8 fix GetMethod (by @nietras)
- 4ca82d Merge pull request #615 from nietras/disassembler-more-than-one-method-fix (by @adamsitnik)
- 387ae5 be more defensive when trying to read source code with disassembler, part of … (by @adamsitnik)
- 703815 docs: how to contribute to disassembler (by @adamsitnik)
- 242671 Enable ApprovalTests in .NET Core 2.0 tests, fixes #618 (by @AndreyAkinshin)
- c4d21b Print amount of logical and physical core #582 (#607) (by @morgan-kn)
- e33e84 Add HtmlReady dialect for MarkdownExporter, fixes #608 (by @AndreyAkinshin)
- cf167b Enable html escaping for GitHub markdown dialect, fixes #608 (by @AndreyAkinshin)
- 8bb28b Logical group support, fixes #617 (by @AndreyAkinshin)
- ae87c6 Merge pull request #619 from dotnet/logical-groups (by @adamsitnik)
- 14e90b parallel build post fix: don’t write the compilation errors to NullLogger, re… (by @adamsitnik)
- db4ae8 Try to search for missing references if build fails, fixes #621 (by @adamsitnik)
- 0eba0f Support of new GC settings, fixes #622 (by @adamsitnik)
- e31b2d Revert Samples/Program.cs (by @AndreyAkinshin)
- 7f126b Add logs in RPlotExporter (by @AndreyAkinshin)
- f8a447 Fix path to csv in RPlotExporter, fixes #623 (by @AndreyAkinshin)
- 273f50 New plots in RPlotExporter (by @AndreyAkinshin)
- f293f0 New README.md (#620) (by @AndreyAkinshin)
- 5e3366 Update copyright year in docs (by @AndreyAkinshin)
- ab7458 Update index in docs (by @AndreyAkinshin)
- 4616d4 Set library version: 0.10.12 (by @AndreyAkinshin)
Contributors (9)
- Adam Sitnik (@adamsitnik)
- Andrey Akinshin (@AndreyAkinshin)
- Christopher Gozdziewski (@Chrisgozd)
- Erik O’Leary (@onionhammer)
- George Plotnikov (@GeorgePlotnikov)
- Irina Ananyeva (@morgan-kn)
- Łukasz Pyrzyk (@lukasz-pyrzyk)
- Mikhail Filippov (@mfilippov)
- nietras (@nietras)
Thank you very much!