Challenges of change point detection in CI performance data
Change point detection is a popular task in various disciplines.
There are many algorithms that solve this problem.
For example, in Selective review of offline change point detection methods
By Charles Truong, Laurent Oudre, Nicolas Vayatis
·
2020truong2020,
the authors presented a classification of different approaches and discussed 35 algorithms.
However, not all the algorithms fit all the situations.
In this post, we consider the problem of change point detection in time series based on software performance measurements obtained from a continuous integration (CI) server. Examples of data sources are CI builds, unit tests, benchmarks, performance tests, and so on. We would like to automatically find performance degradations in such time series. Unfortunately, most of the available algorithms do not provide decent solutions for this problem. In this post, I discuss some challenges that arise when we are looking for change points in CI performance data.
Basic requirements
We start with a list of basic requirements we have for performance change point detection.
- Unknown number of change points
Many change point detectors require the exact number of expected change points in advance. We do not know this number, so we need a detector that does not need this information. - Computational efficiency
When we work with a huge enterprise project, we may want to analyze millions of long-lasting time series on daily basis. In this case, the detector’s computational efficiency is quite important. Even $O(N^2)$ could become a non-acceptable bottleneck. Therefore, we would like to have something around $O(N \log N)$. However, the exact requirements depend on the amount of data we want to analyze. - Nonparametric distributions
Some change point detectors require normally-distributed data so that they could track the changes in the mean or the standard deviation. In the world of performance measurements, there are too many non-normal distributions which we would like to support as well. - Multimodal distribution support
Some of the performance distributions are multimodal. A change could be defined by a shift of a single mode. We would like to support such scenarios. - Heavy-tail distribution support
Some of the performance distributions are heavy-tailed. It means that we could expect some extreme outliers. A performance change point detector should be robust so that its reliability is not affected by extreme values. - Stability/consistency/persistency
Let’s say we analyzed a series of performance measurements, found some change points and sent corresponding alerts. Next, we extended the data sample with new freshly gathered measurements and repeated the analysis. What if the previous results don’t match the current ones? E.g., some change points may appear, disappear, or displace. Should we send new alerts about freshly discovered two-week-old changes? Such inconsistencies may bring a lot of problems and false-positive alerts. A well-behaved performance change point detector shouldn’t change the previously detected points, the results of different runs should be consistent with each other.
Next, we discuss some advanced challenges that should be properly solved.
Change point classification
There are various types of changes. When we start looking for change points, typically we expect to find accelerations (performance becomes better) or degradations (performance becomes worse). Unfortunately, in real life, not all the changes could be unambiguously classified as accelerations or degradations. Let’s look at the following picture:
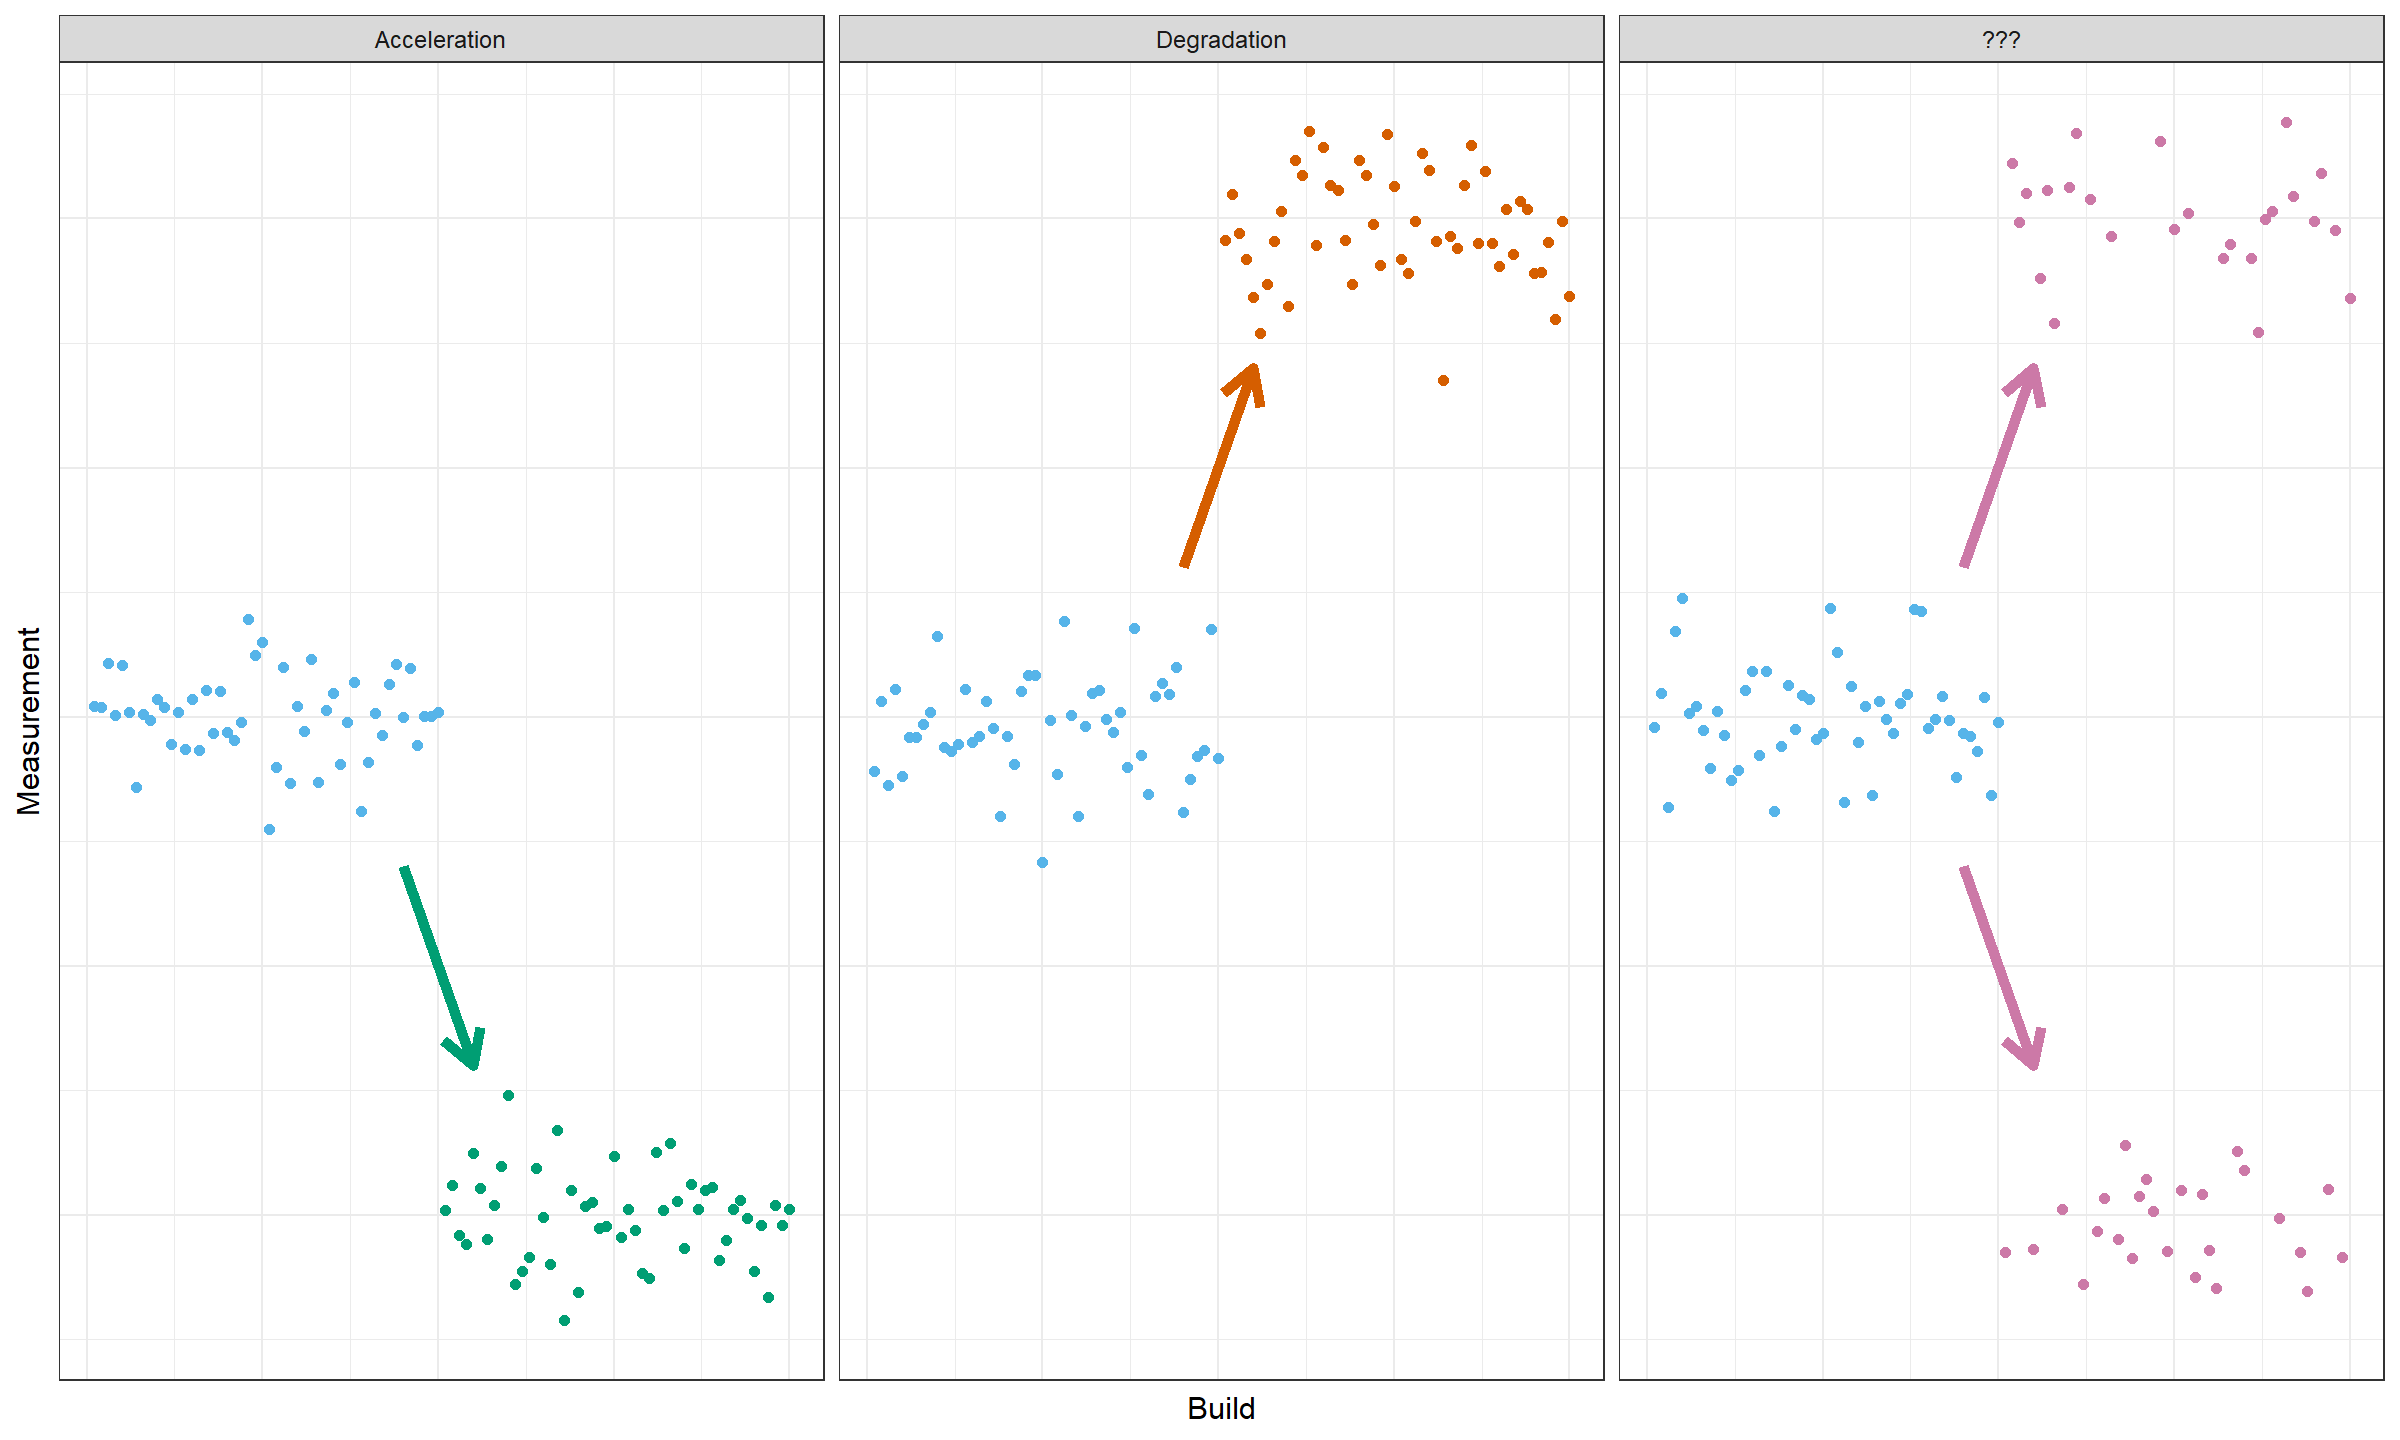

On the third plot, an unimodal distribution is split into two modes. It means that one part of a distribution accelerated and the other one degraded. It’s a common effect in the performance world that could appear due to various reasons like trade-off changes (e.g., changes in a caching strategy) or multithreading nondeterminism (e.g., unintentional race conditions).
We should learn how to classify different types of changes properly and we should specify formal alert criteria. What kind of changes do we want to be aware of?
Ranking
Not all the change points are equally important. If we automatically discover hundreds or thousands of changes, we don’t always have the physical ability to review all of them. Therefore, we need some ranking strategy so that we can present only the most important and critical changes. In addition to external business requirements, we may consider introducing two following properties of each change point:
- Detection confidence: how sure we are that we correctly find this particular change point?
- Change magnitude: what is the size of the change? (Could be expressed using absolute/relative units or effect size.)
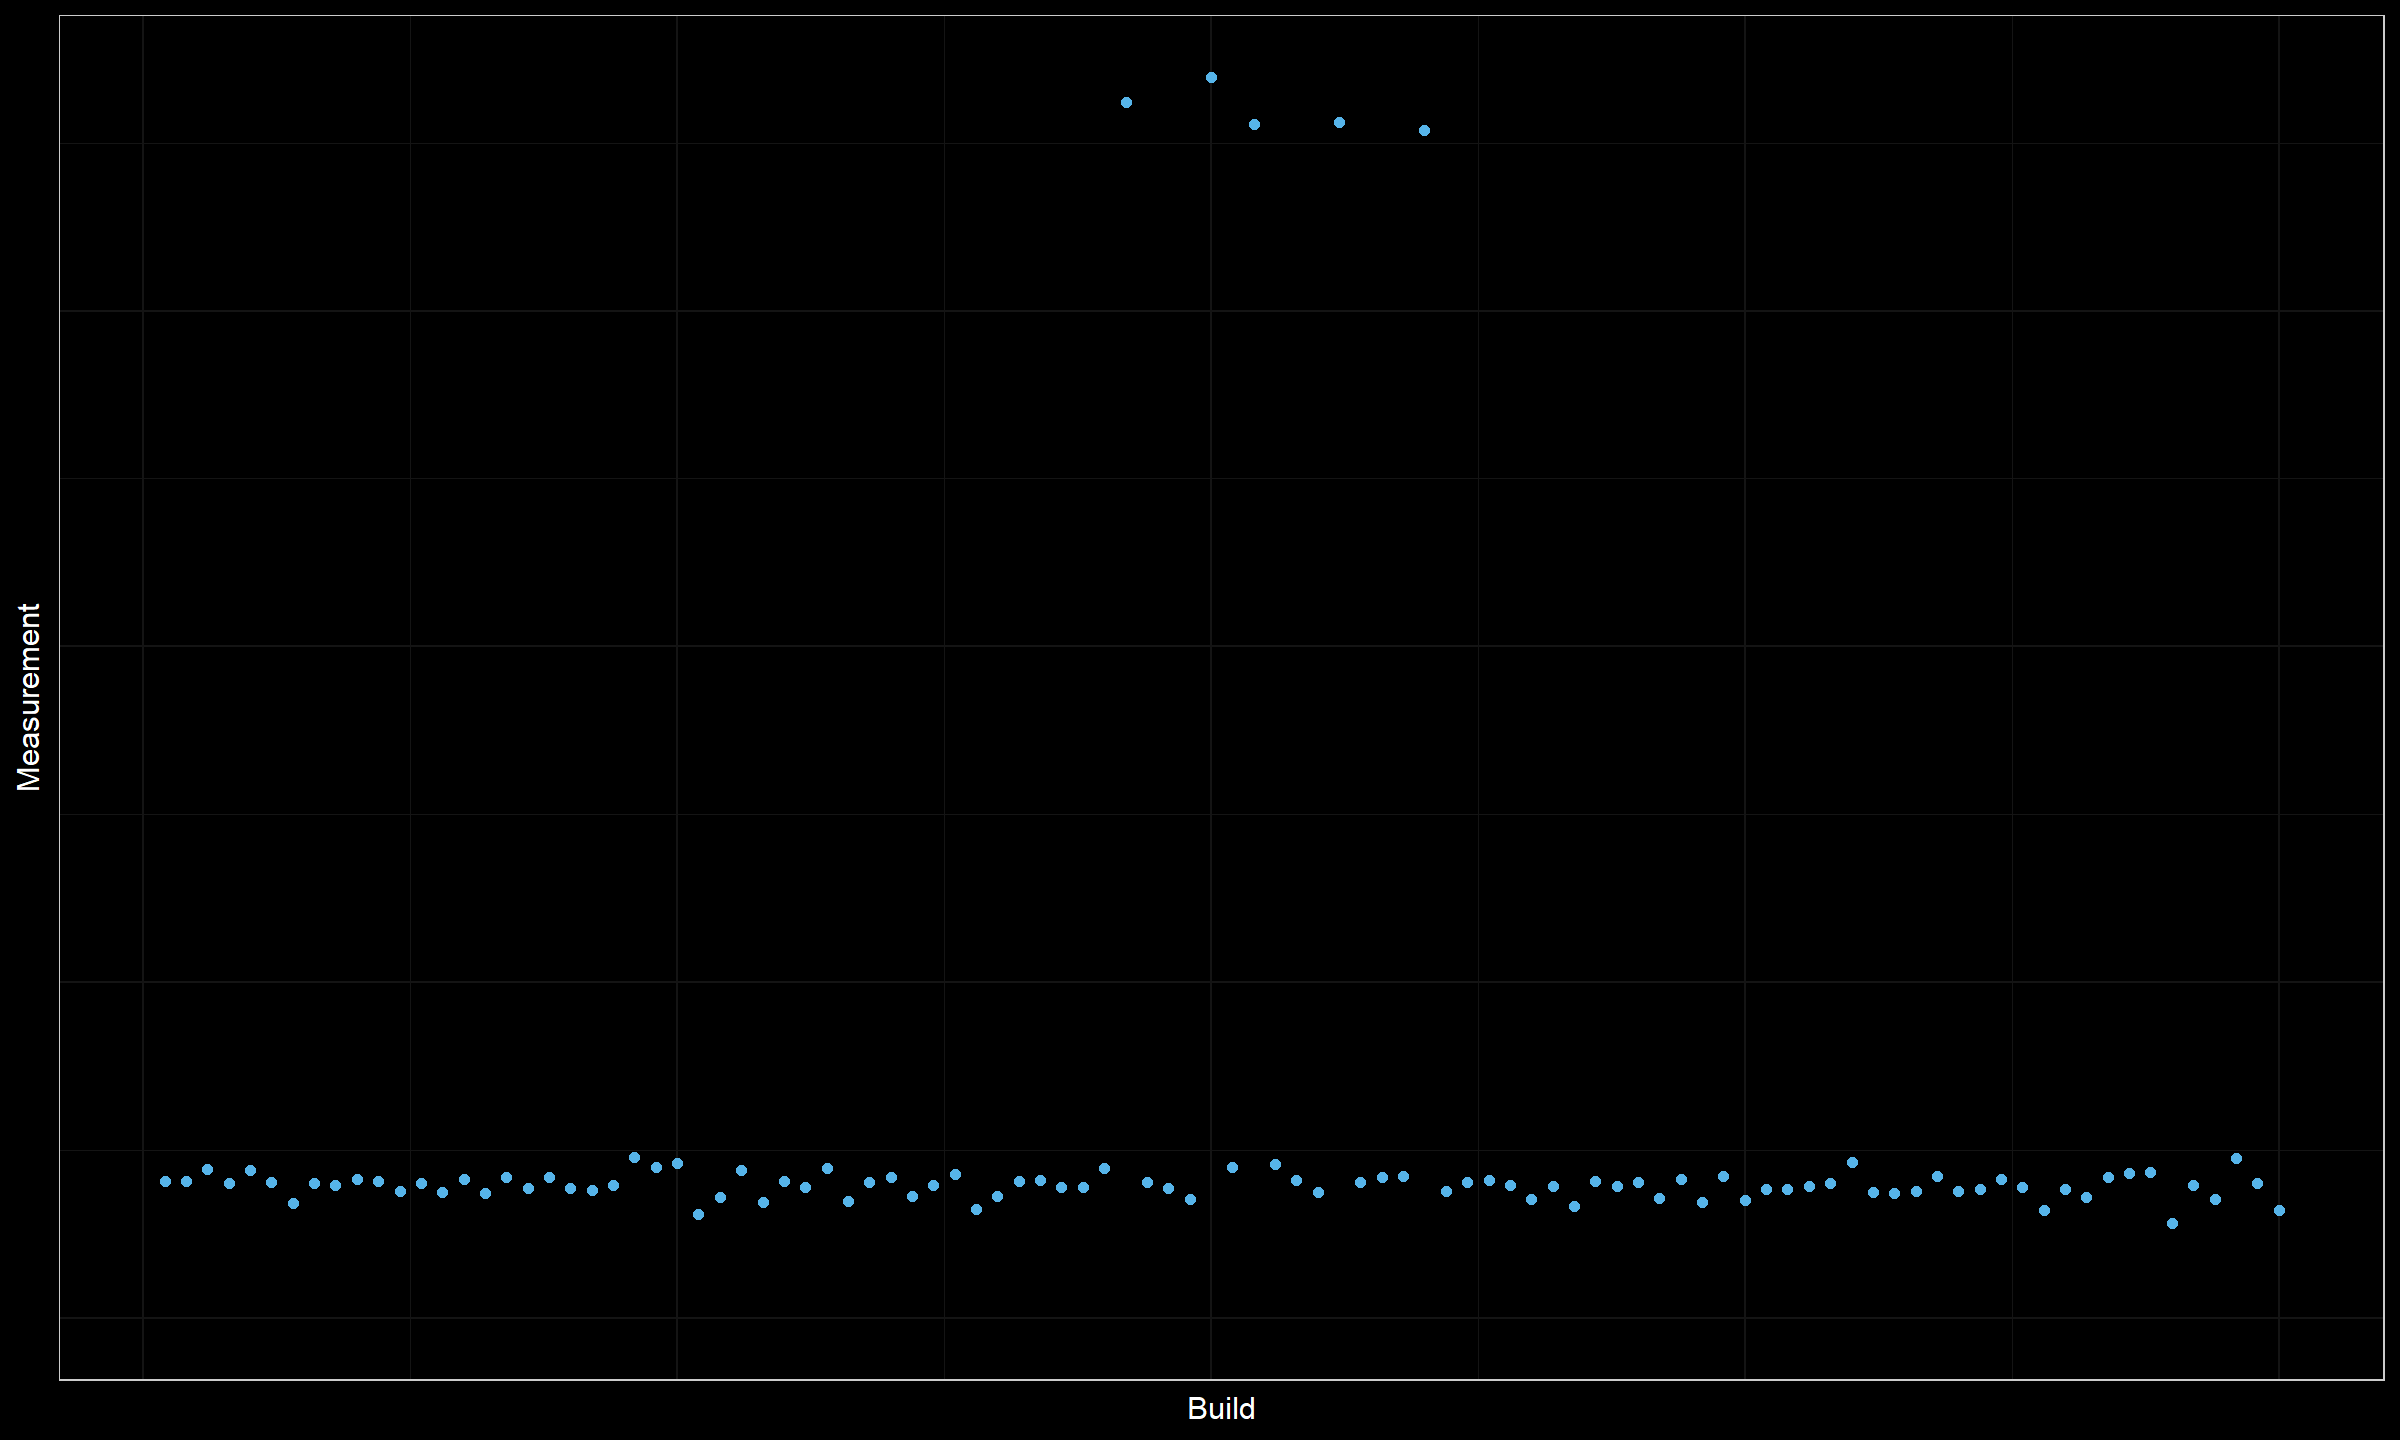
Let’s consider a few examples. Here is the first one:
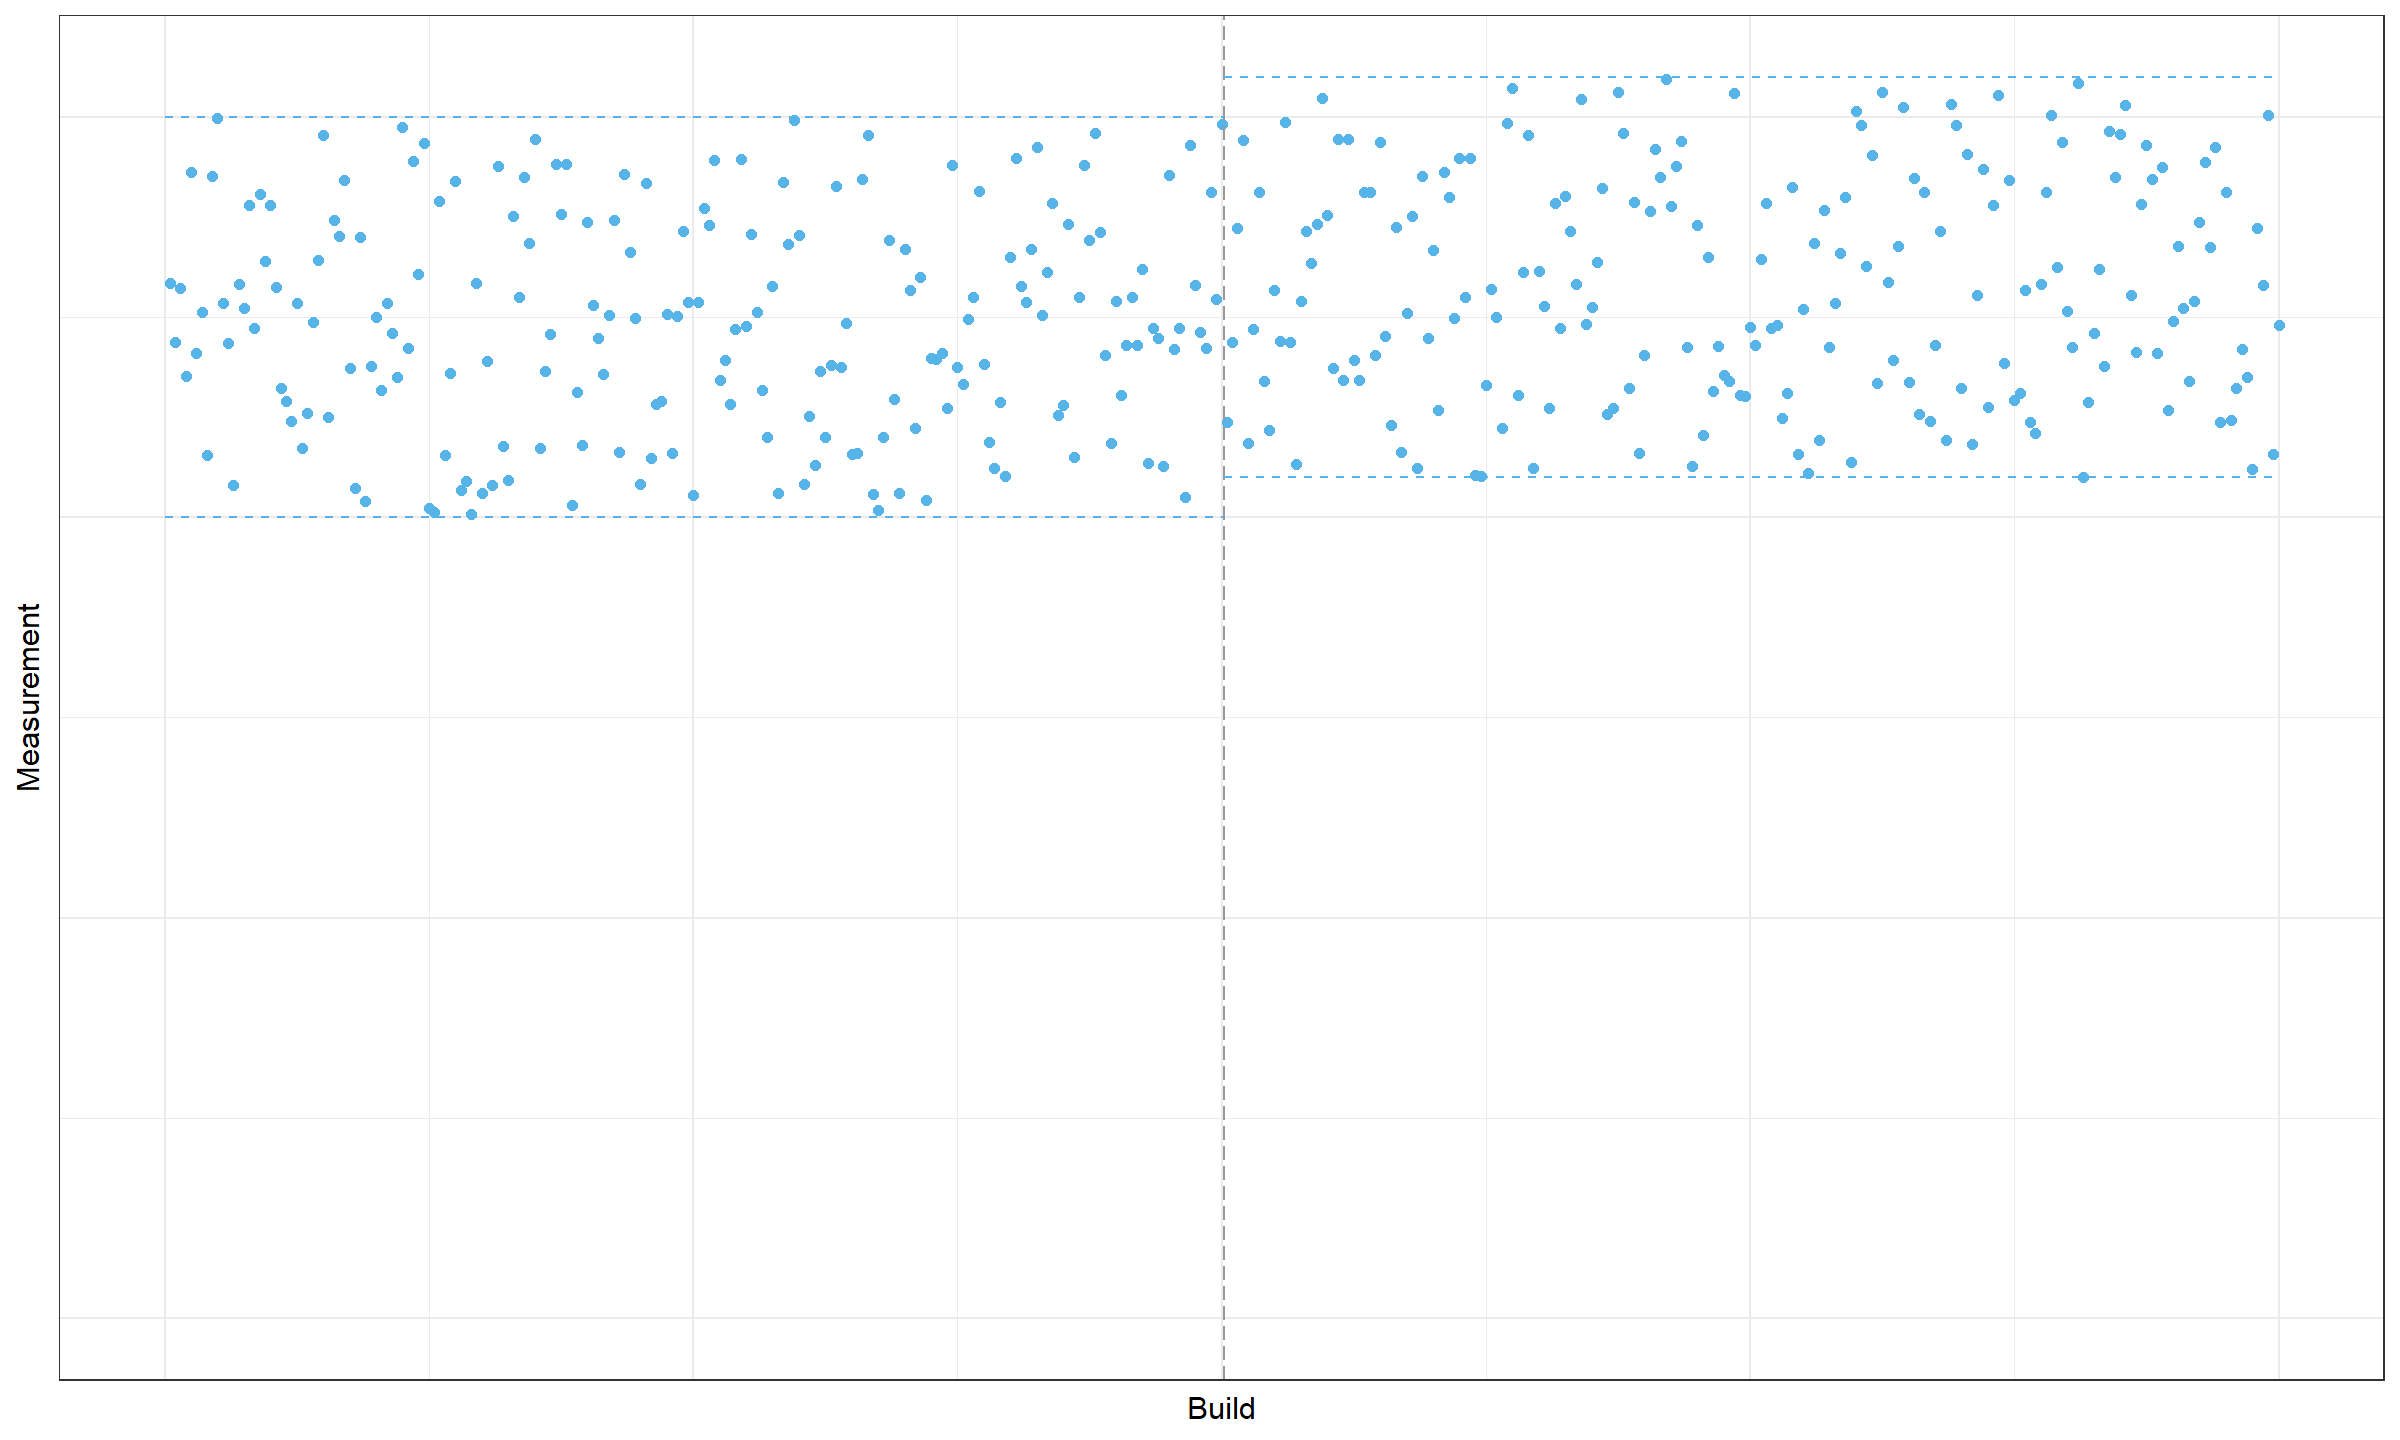
Here we are quite confident that we correctly found a change point in the middle of the chart. However, the change magnitude is not so high. It could be a practically insignificant degradation that could be safely ignored.
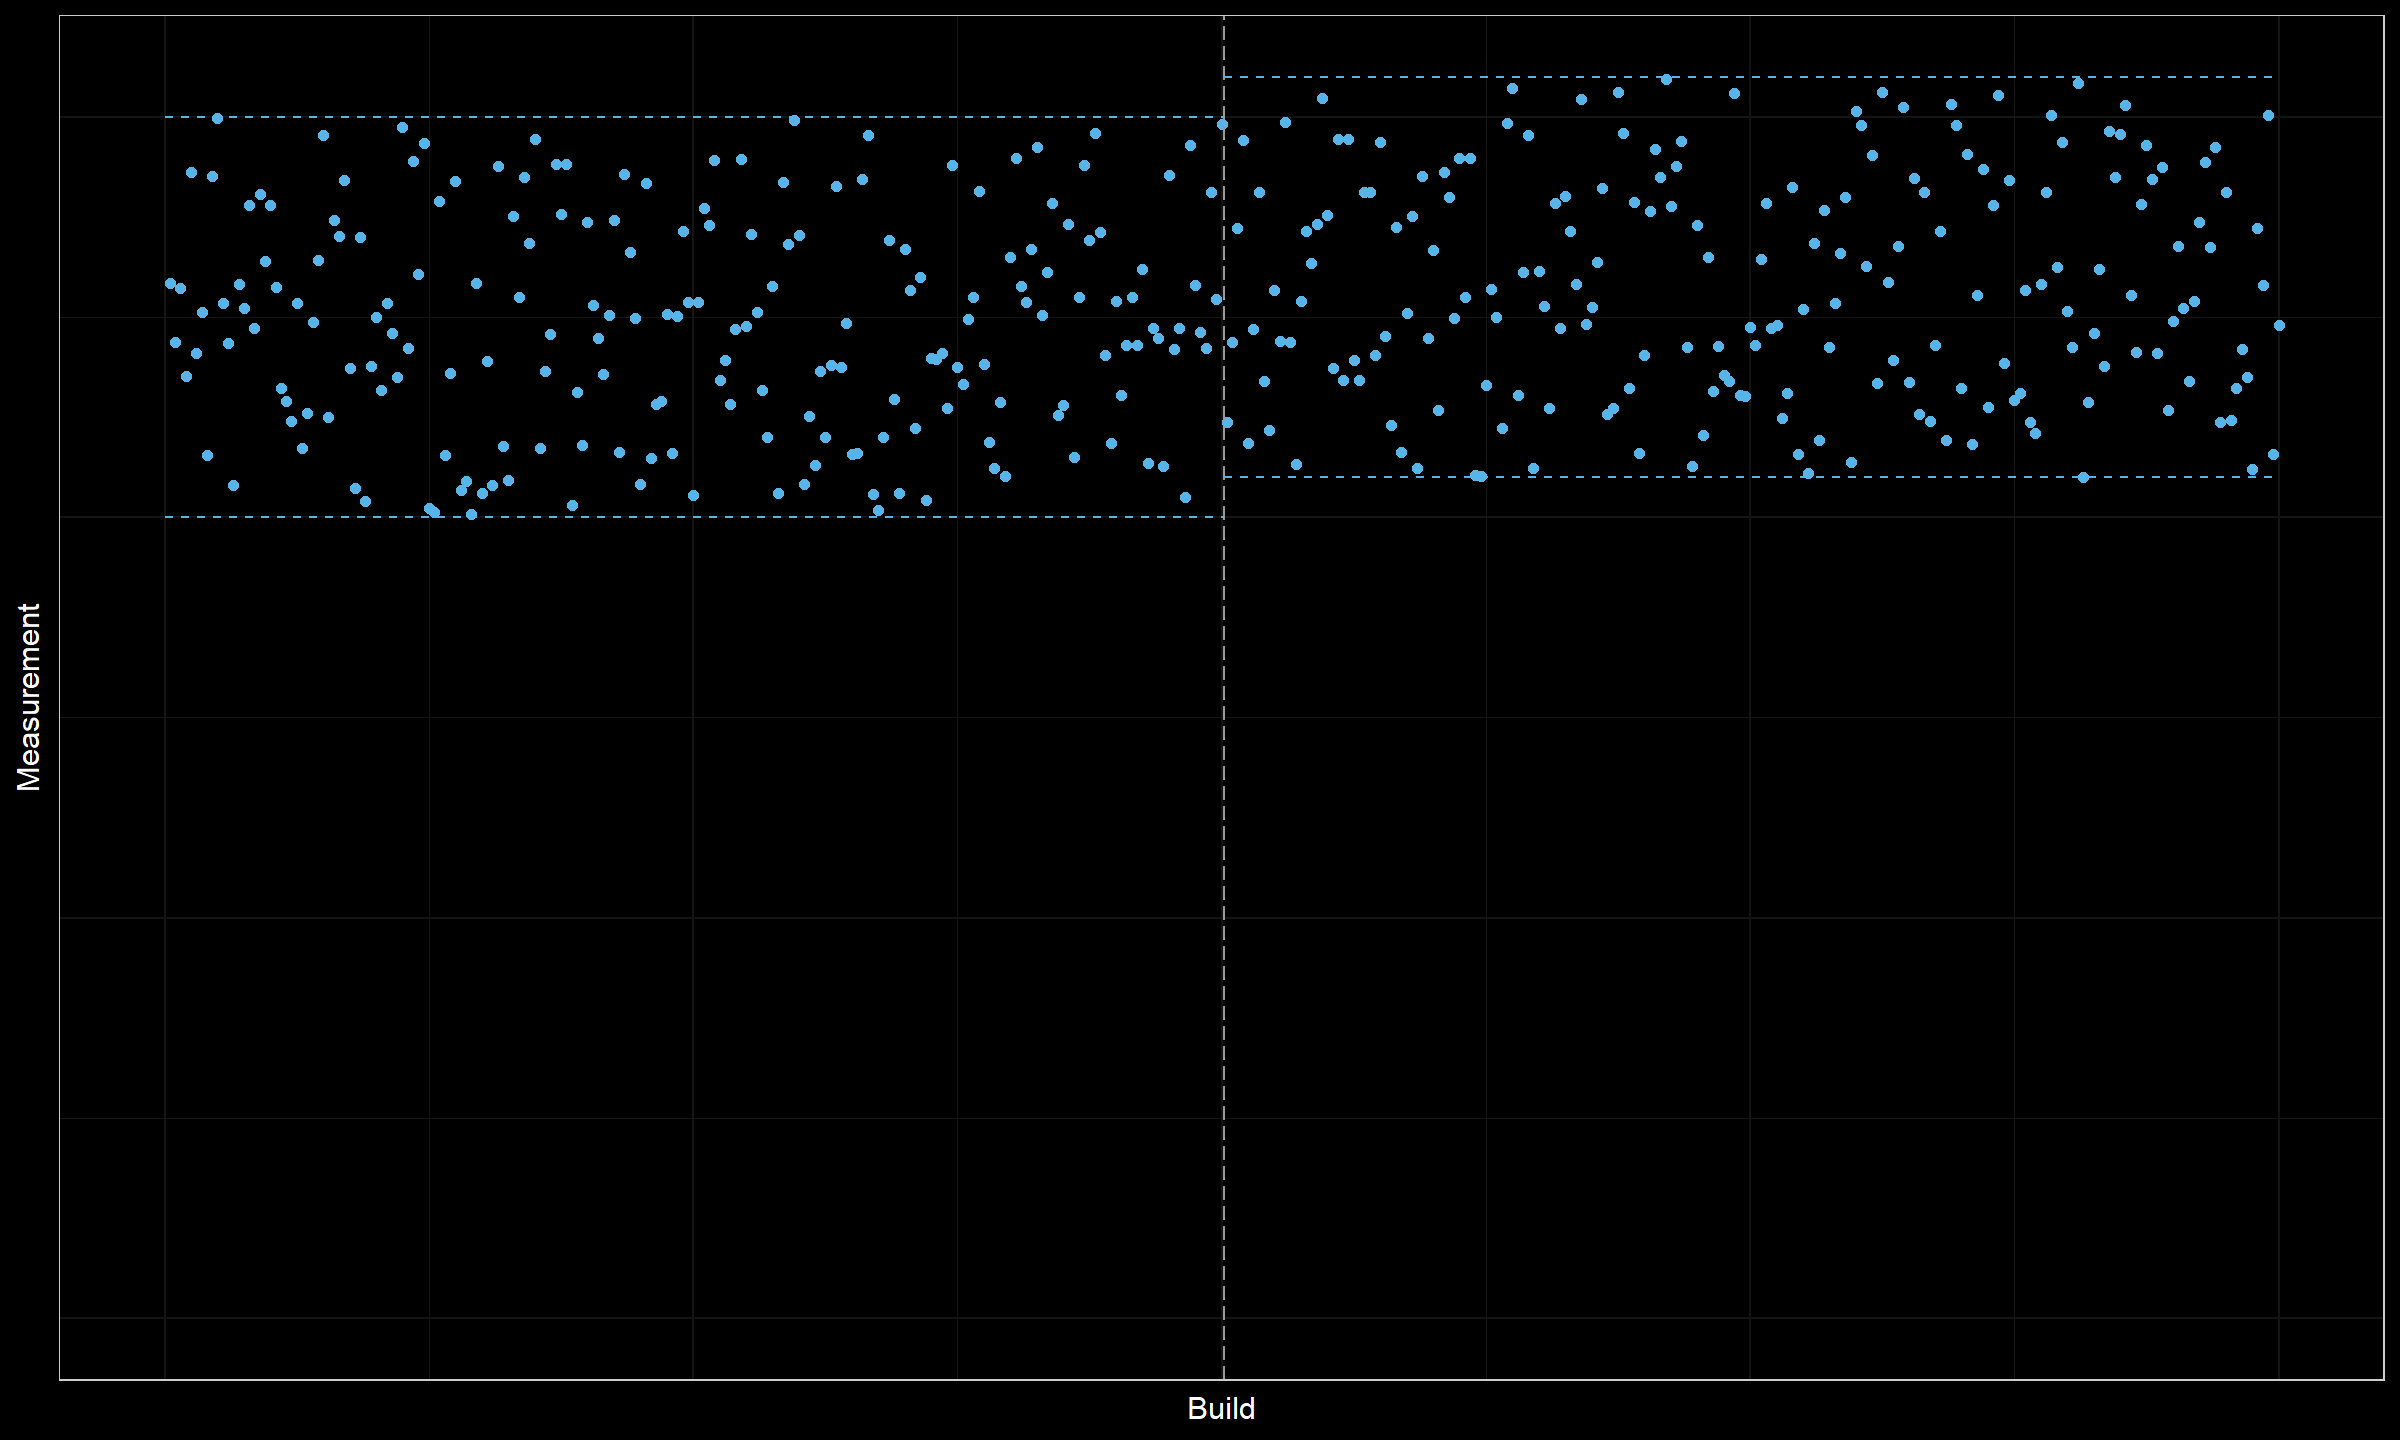
Here is another example:
Here we have five outliers in the middle of the plot. It could be an actual change in the values of higher distribution percentiles that should be marked with two change points. However, it could be just a random deviation that could be safely ignored. While the change magnitude is high, we are not sure that this is an actual change that should be detected.
Metadata support
Sometimes, it’s possible to get some valuable insights from the metadata of raw performance measurements. Let’s consider the following plot:

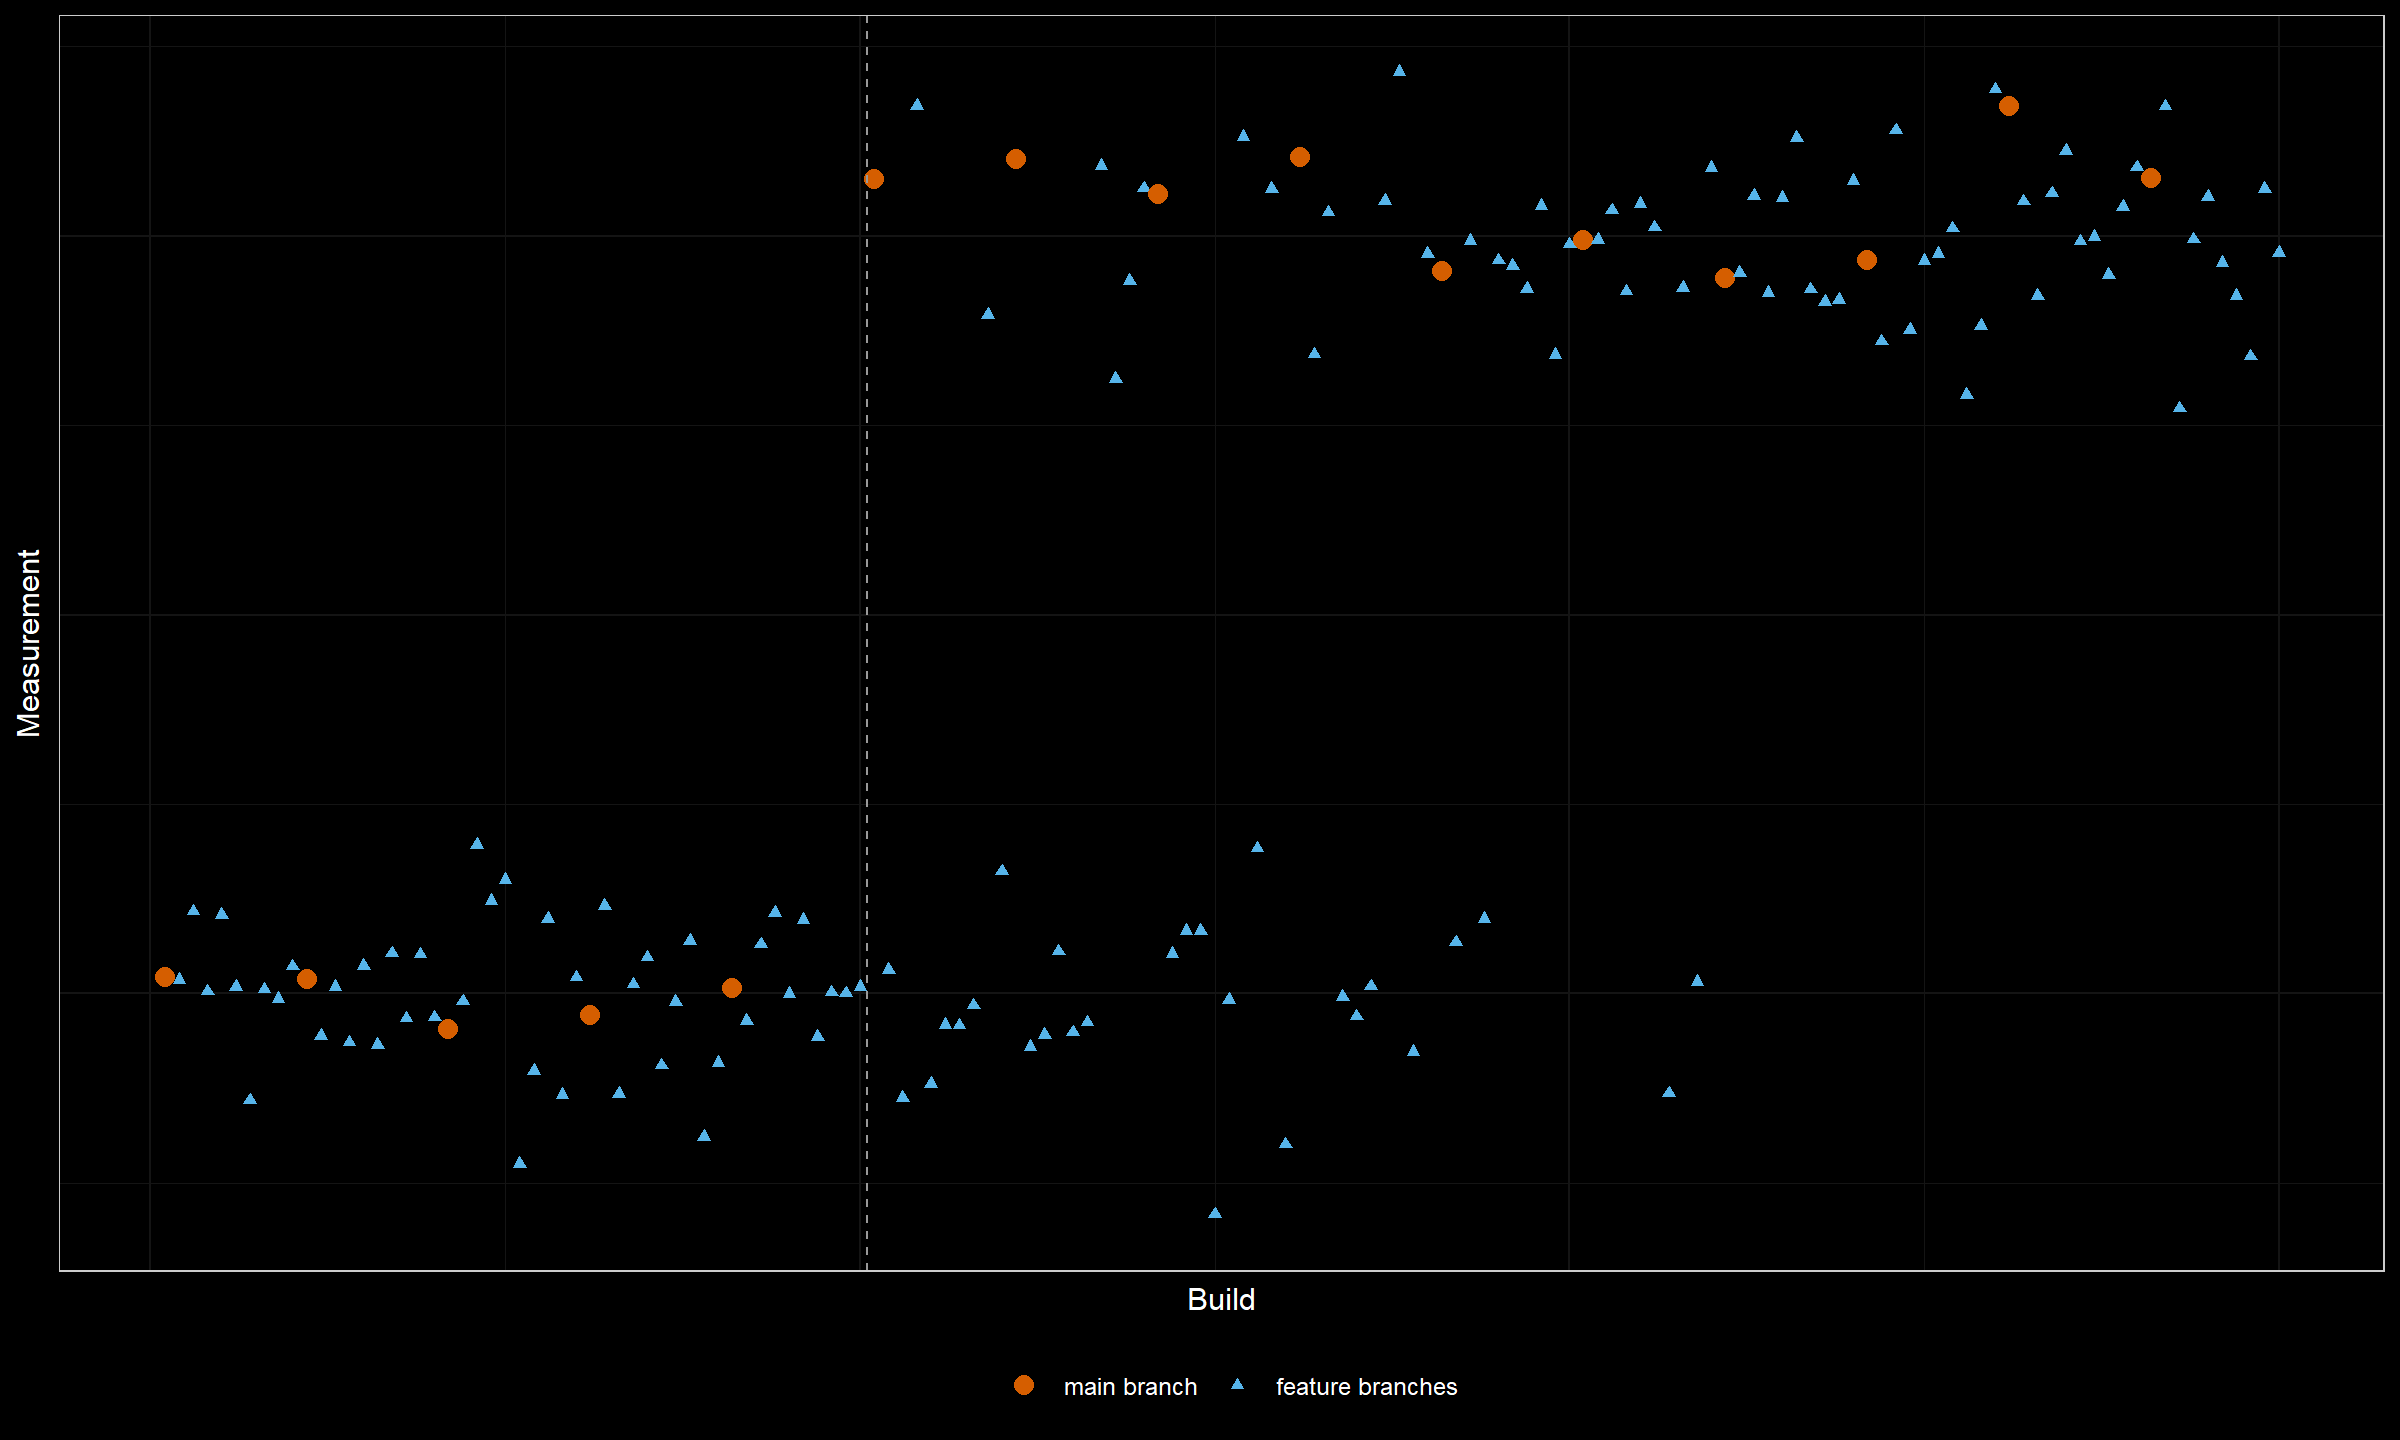
This plot combines the measurements from the main branch and all the other feature branches. Typically, we have a small number of measurements in the main branch which is not always enough to reliably detect change points. We could extend the data set with measurements from the feature branches in order to obtain more reliable conclusions. Unfortunately, this trick reduces the detection accuracy. Indeed, once a change happens in the main branch, some feature branches based on the obsolete commits may produce “old-style” measurements. It leads to a situation where we can say that we have an obvious change here, but we can’t reliably detect its exact location. Using additional metadata with branch names allows getting better results in terms of detection confidence and location accuracy.
Matching multiple time series
Now imagine that we try to find change points in multiple data series (e.g., in different unit tests):
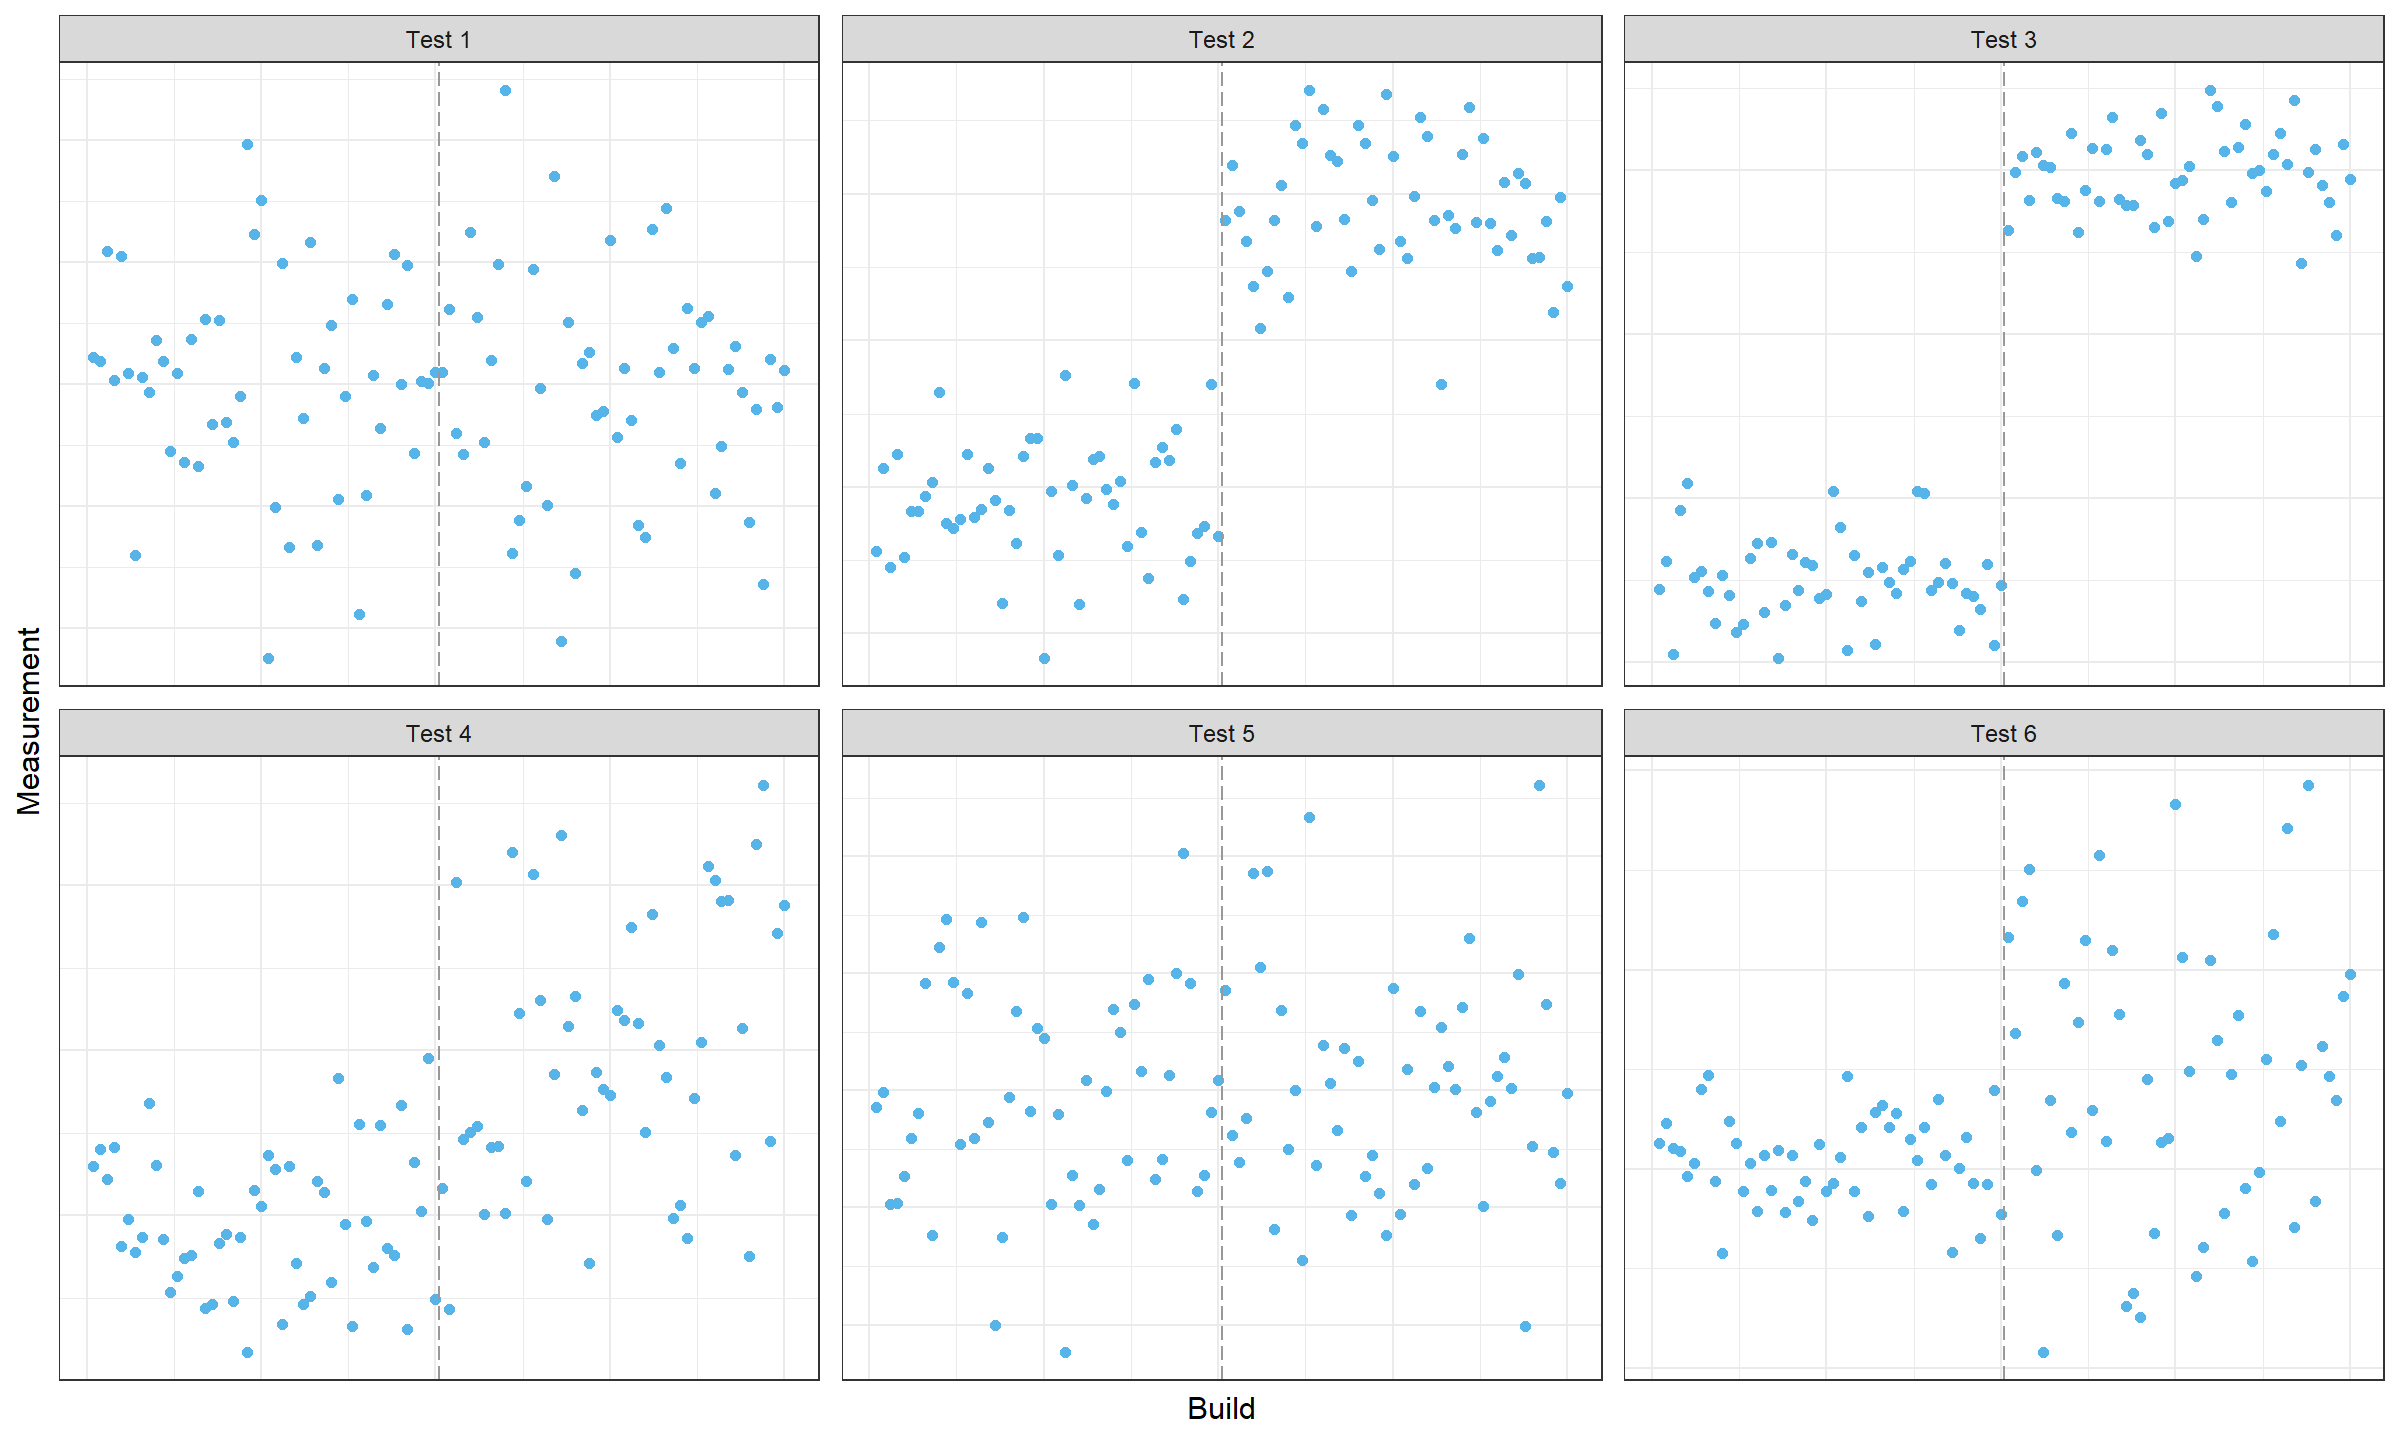

In some tests, we don’t discover any changes. In other tests, we discover changes, but we are not sure about their locations, so it’s hard to detect the exact commit that produced these changes. A good alert message based on such data should include possible culprit commits and the list of the affected tests. This task could be considered as multivariate change point detection with partially missing data (some test runs may fail and we have to exclude the corresponding measurements from the analysis).
Distance between change points
Let’s consider another timeline plot:
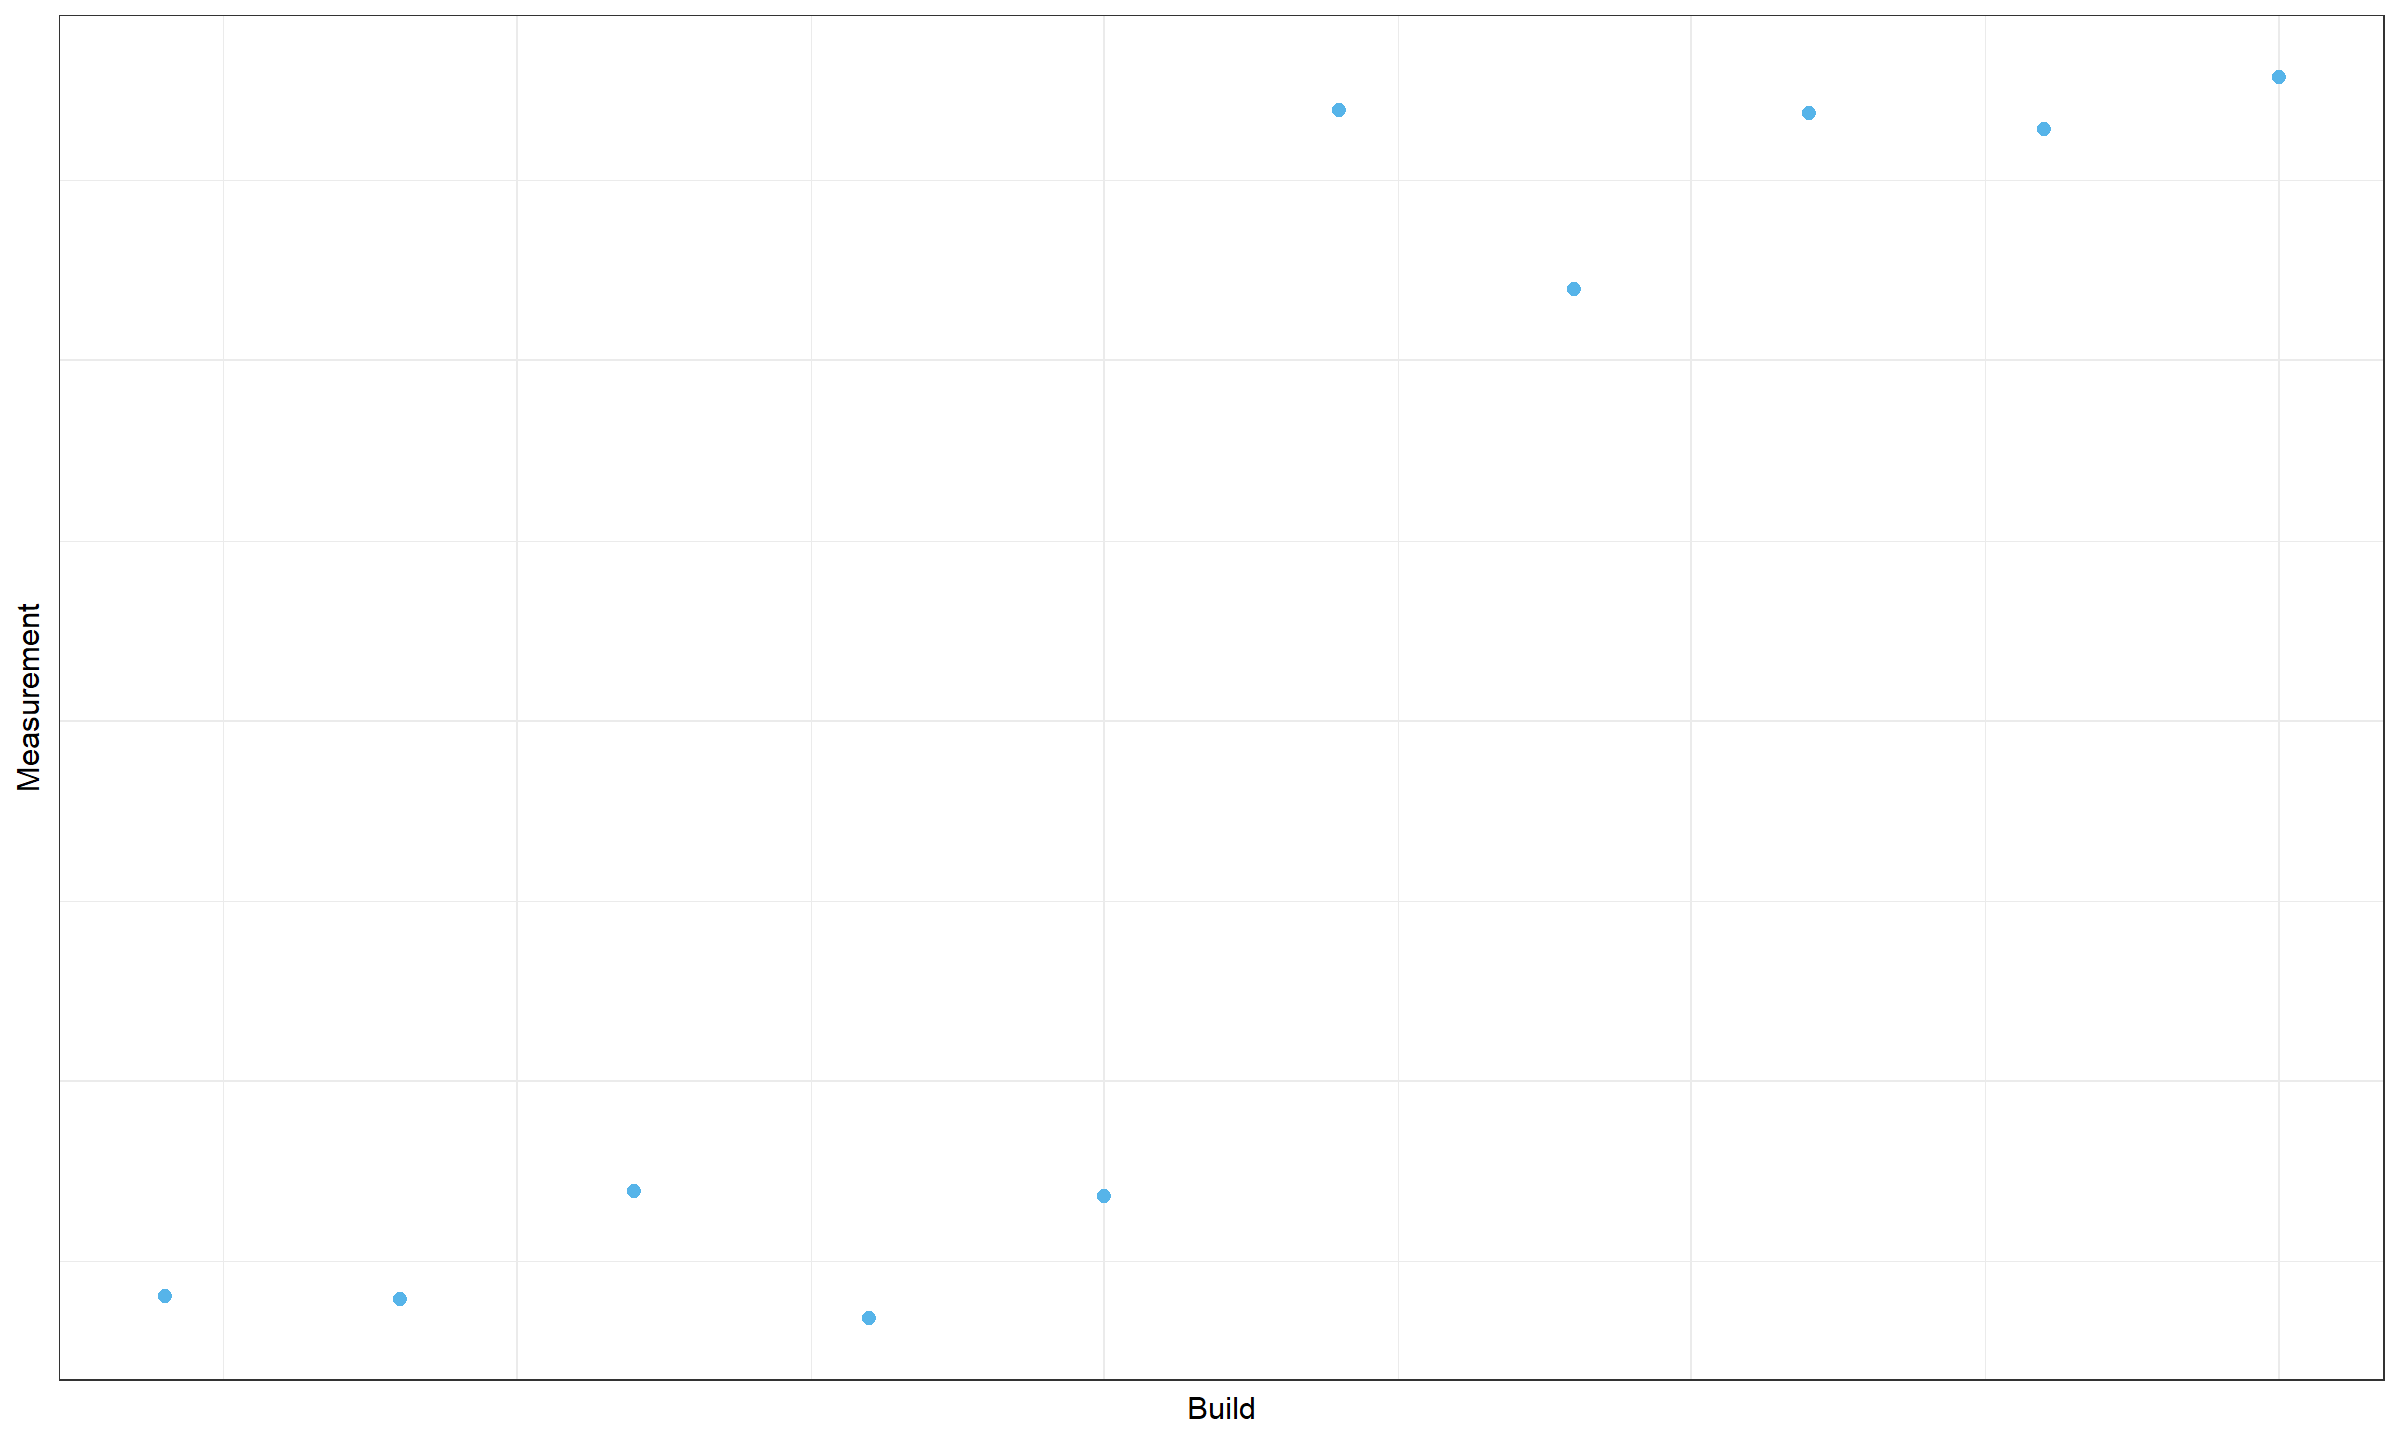
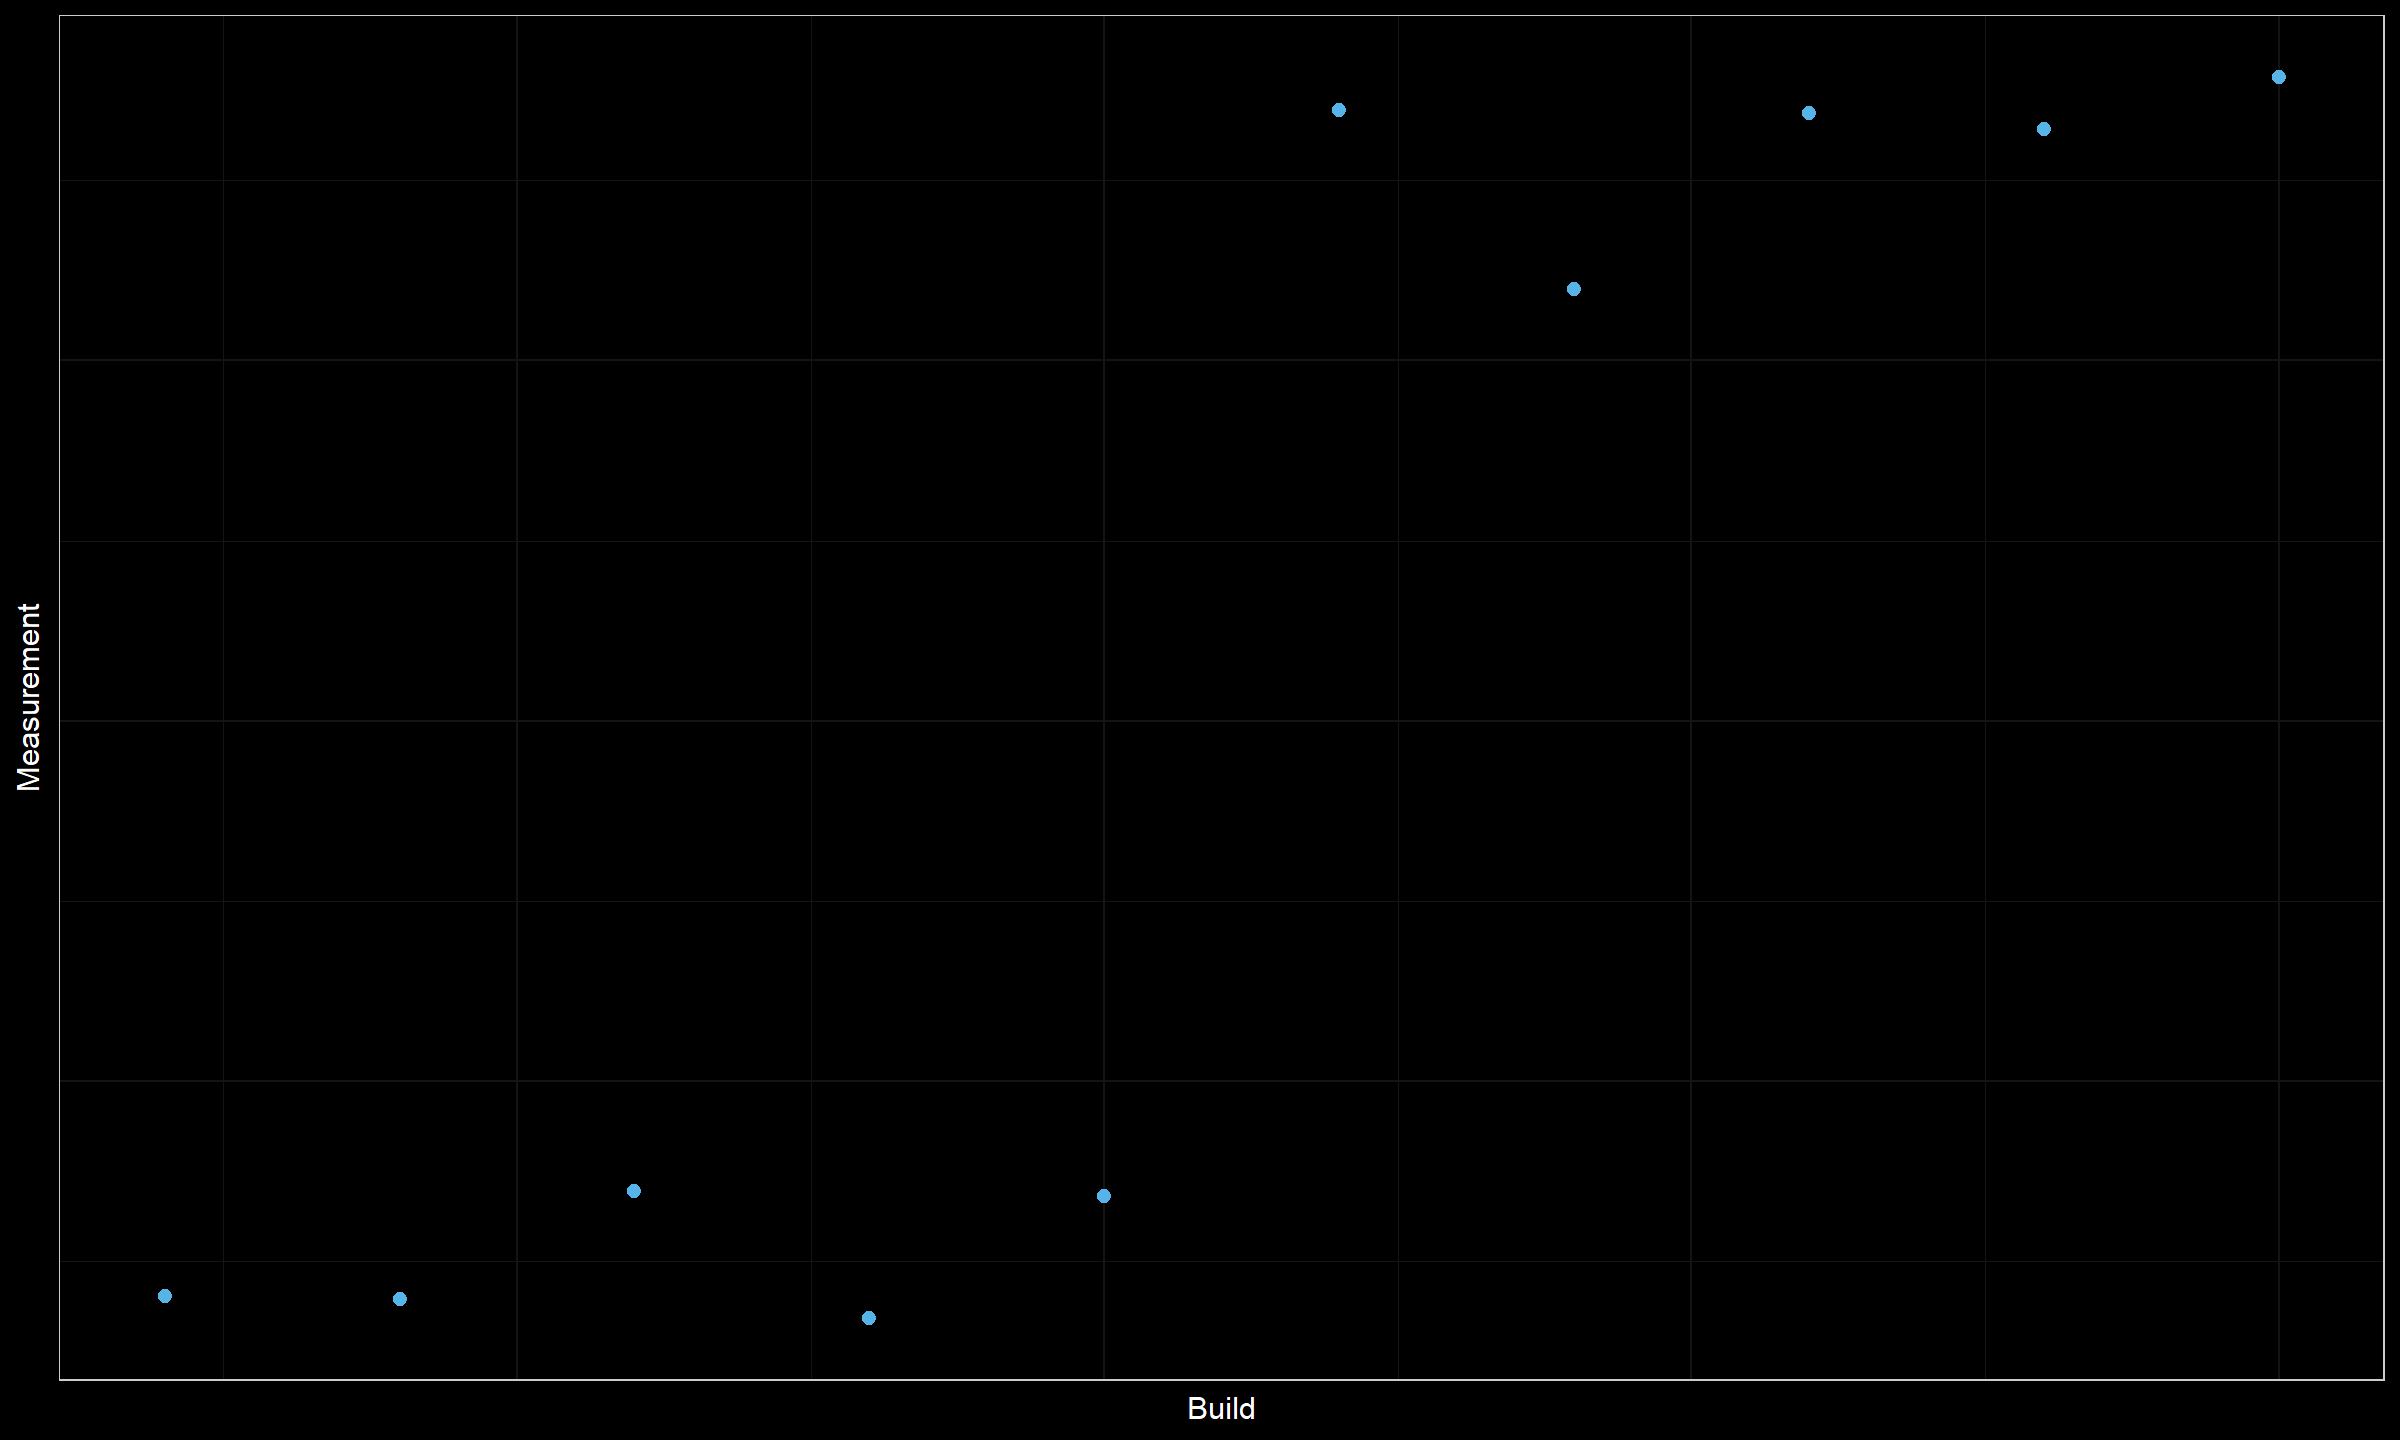
Do we have a change point here? We can’t reliably claim this because the data set is quite small. Such a picture could be obtained by chance. When we analyze thousands of time series, there is a high probability of obtaining small “pseudo-clusters” without any actual changes in the source code.
A typical solution for such kind of problem is to introduce a requirement for minimum cluster size (or for the minimum distance between change points). Usually, I require 20-30 measurements between change points to keep the false-positive rate low.
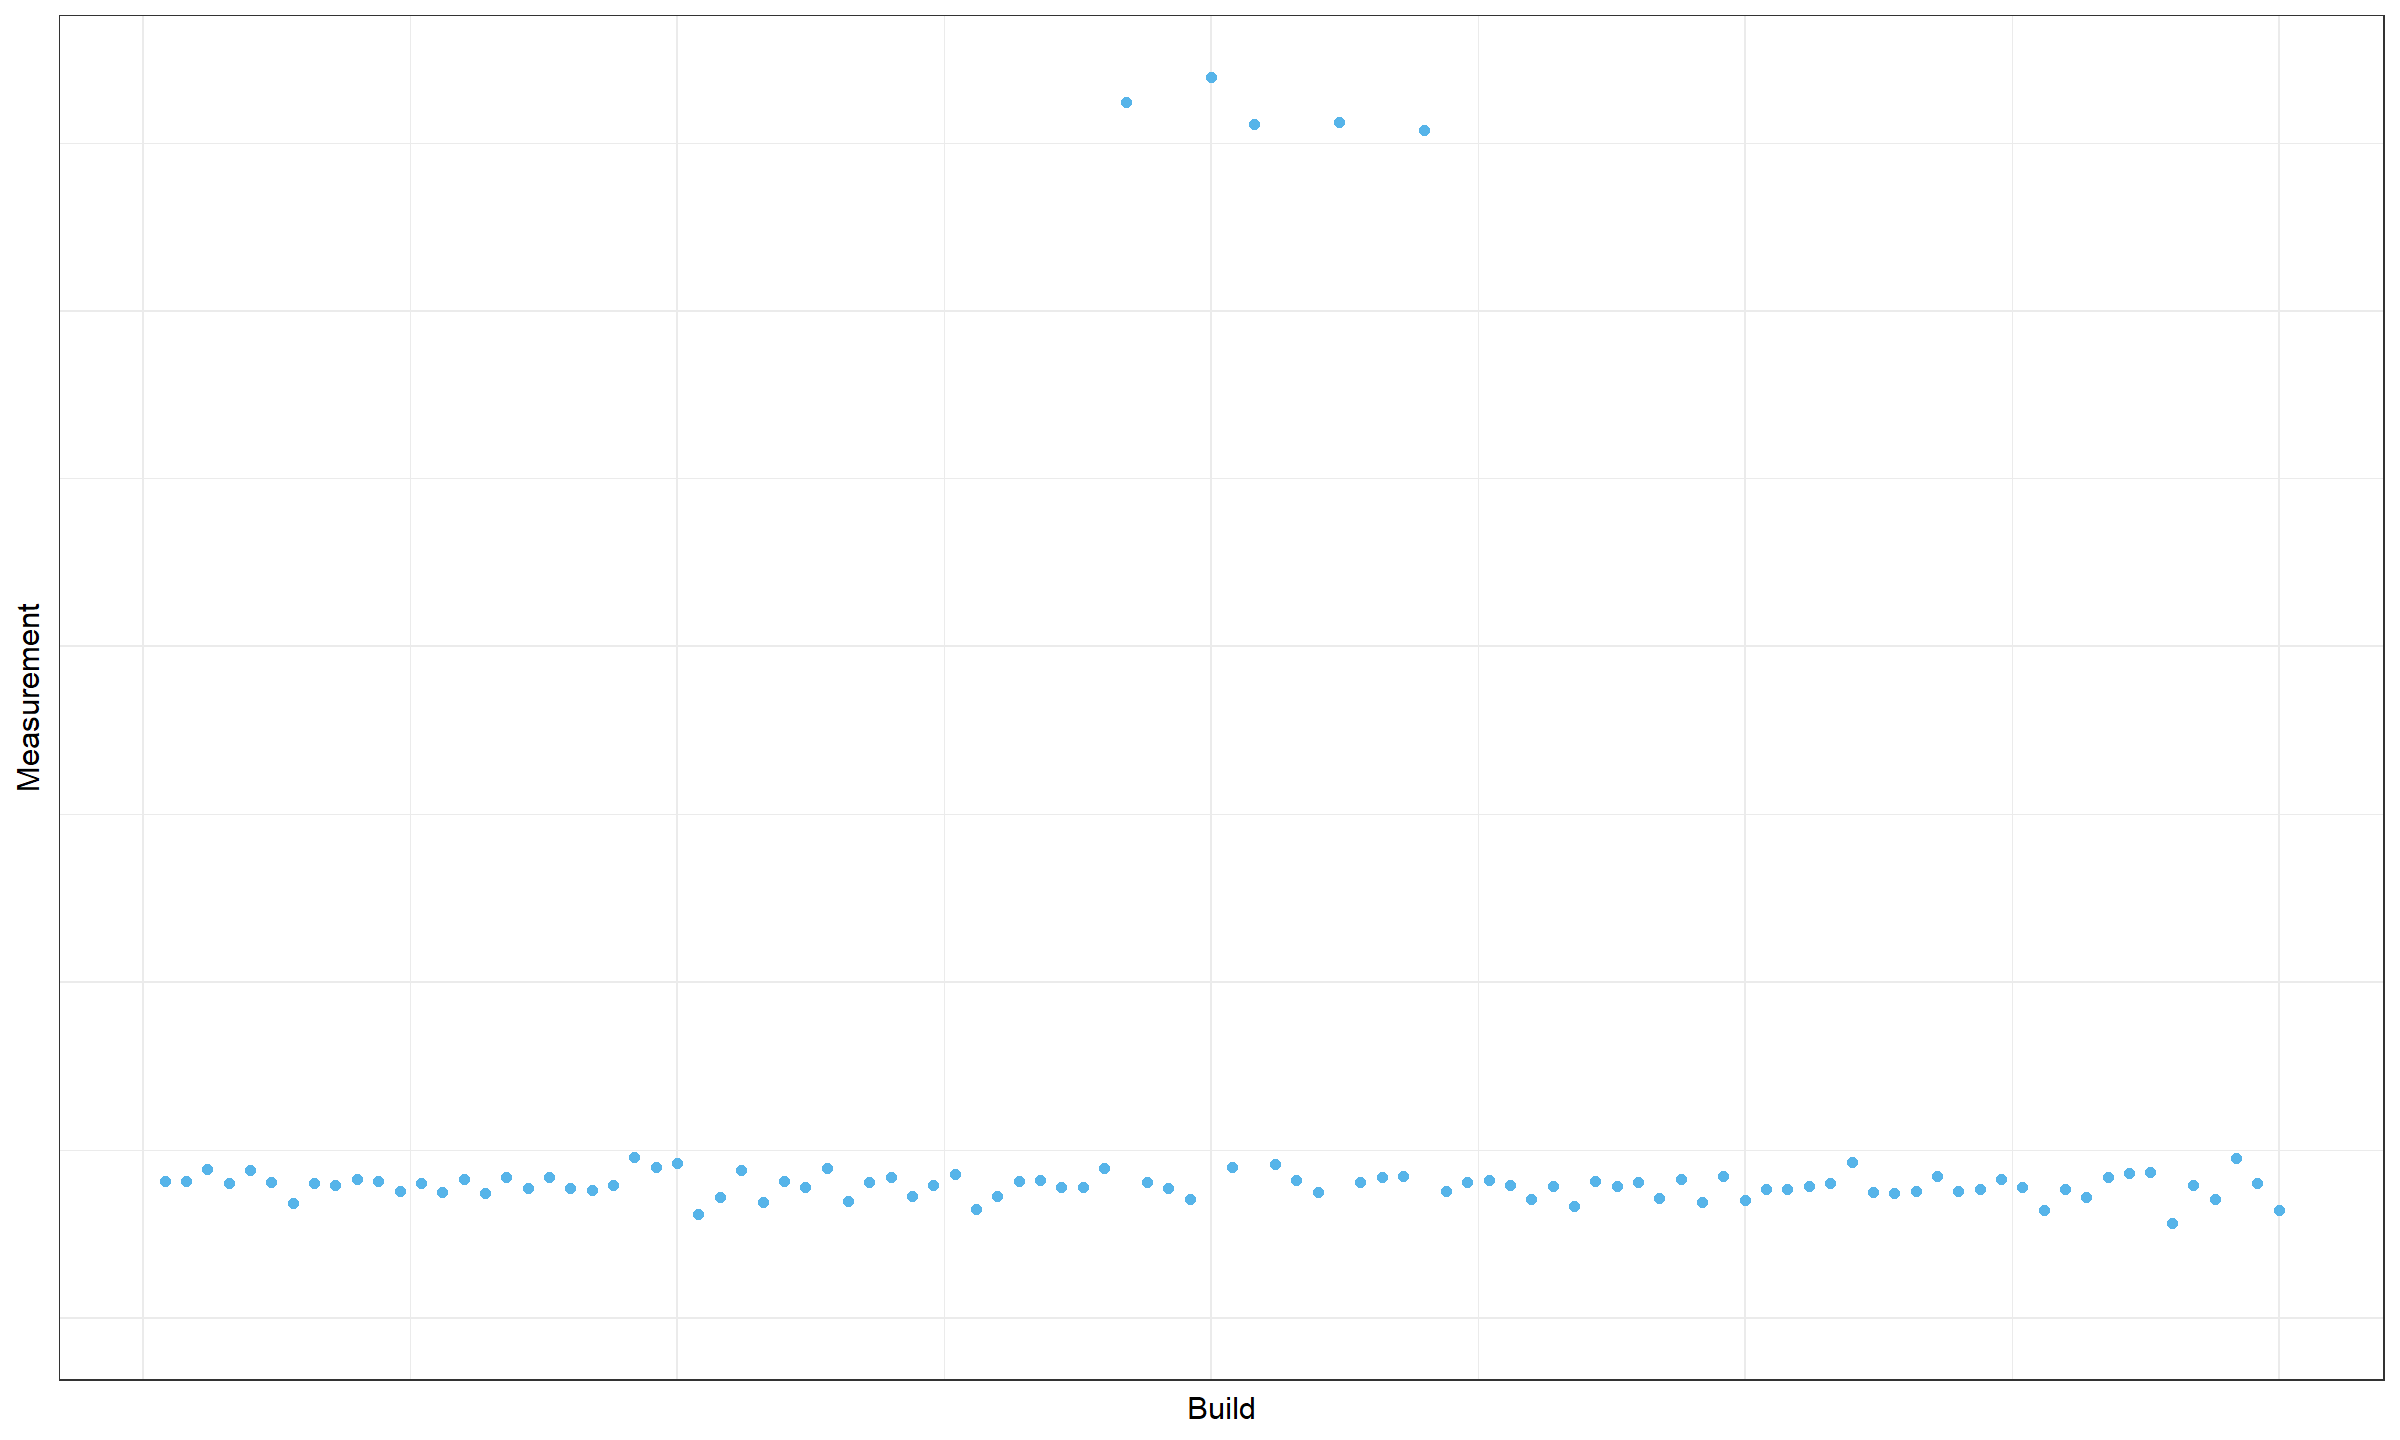
Now let’s consider another timeline plot:
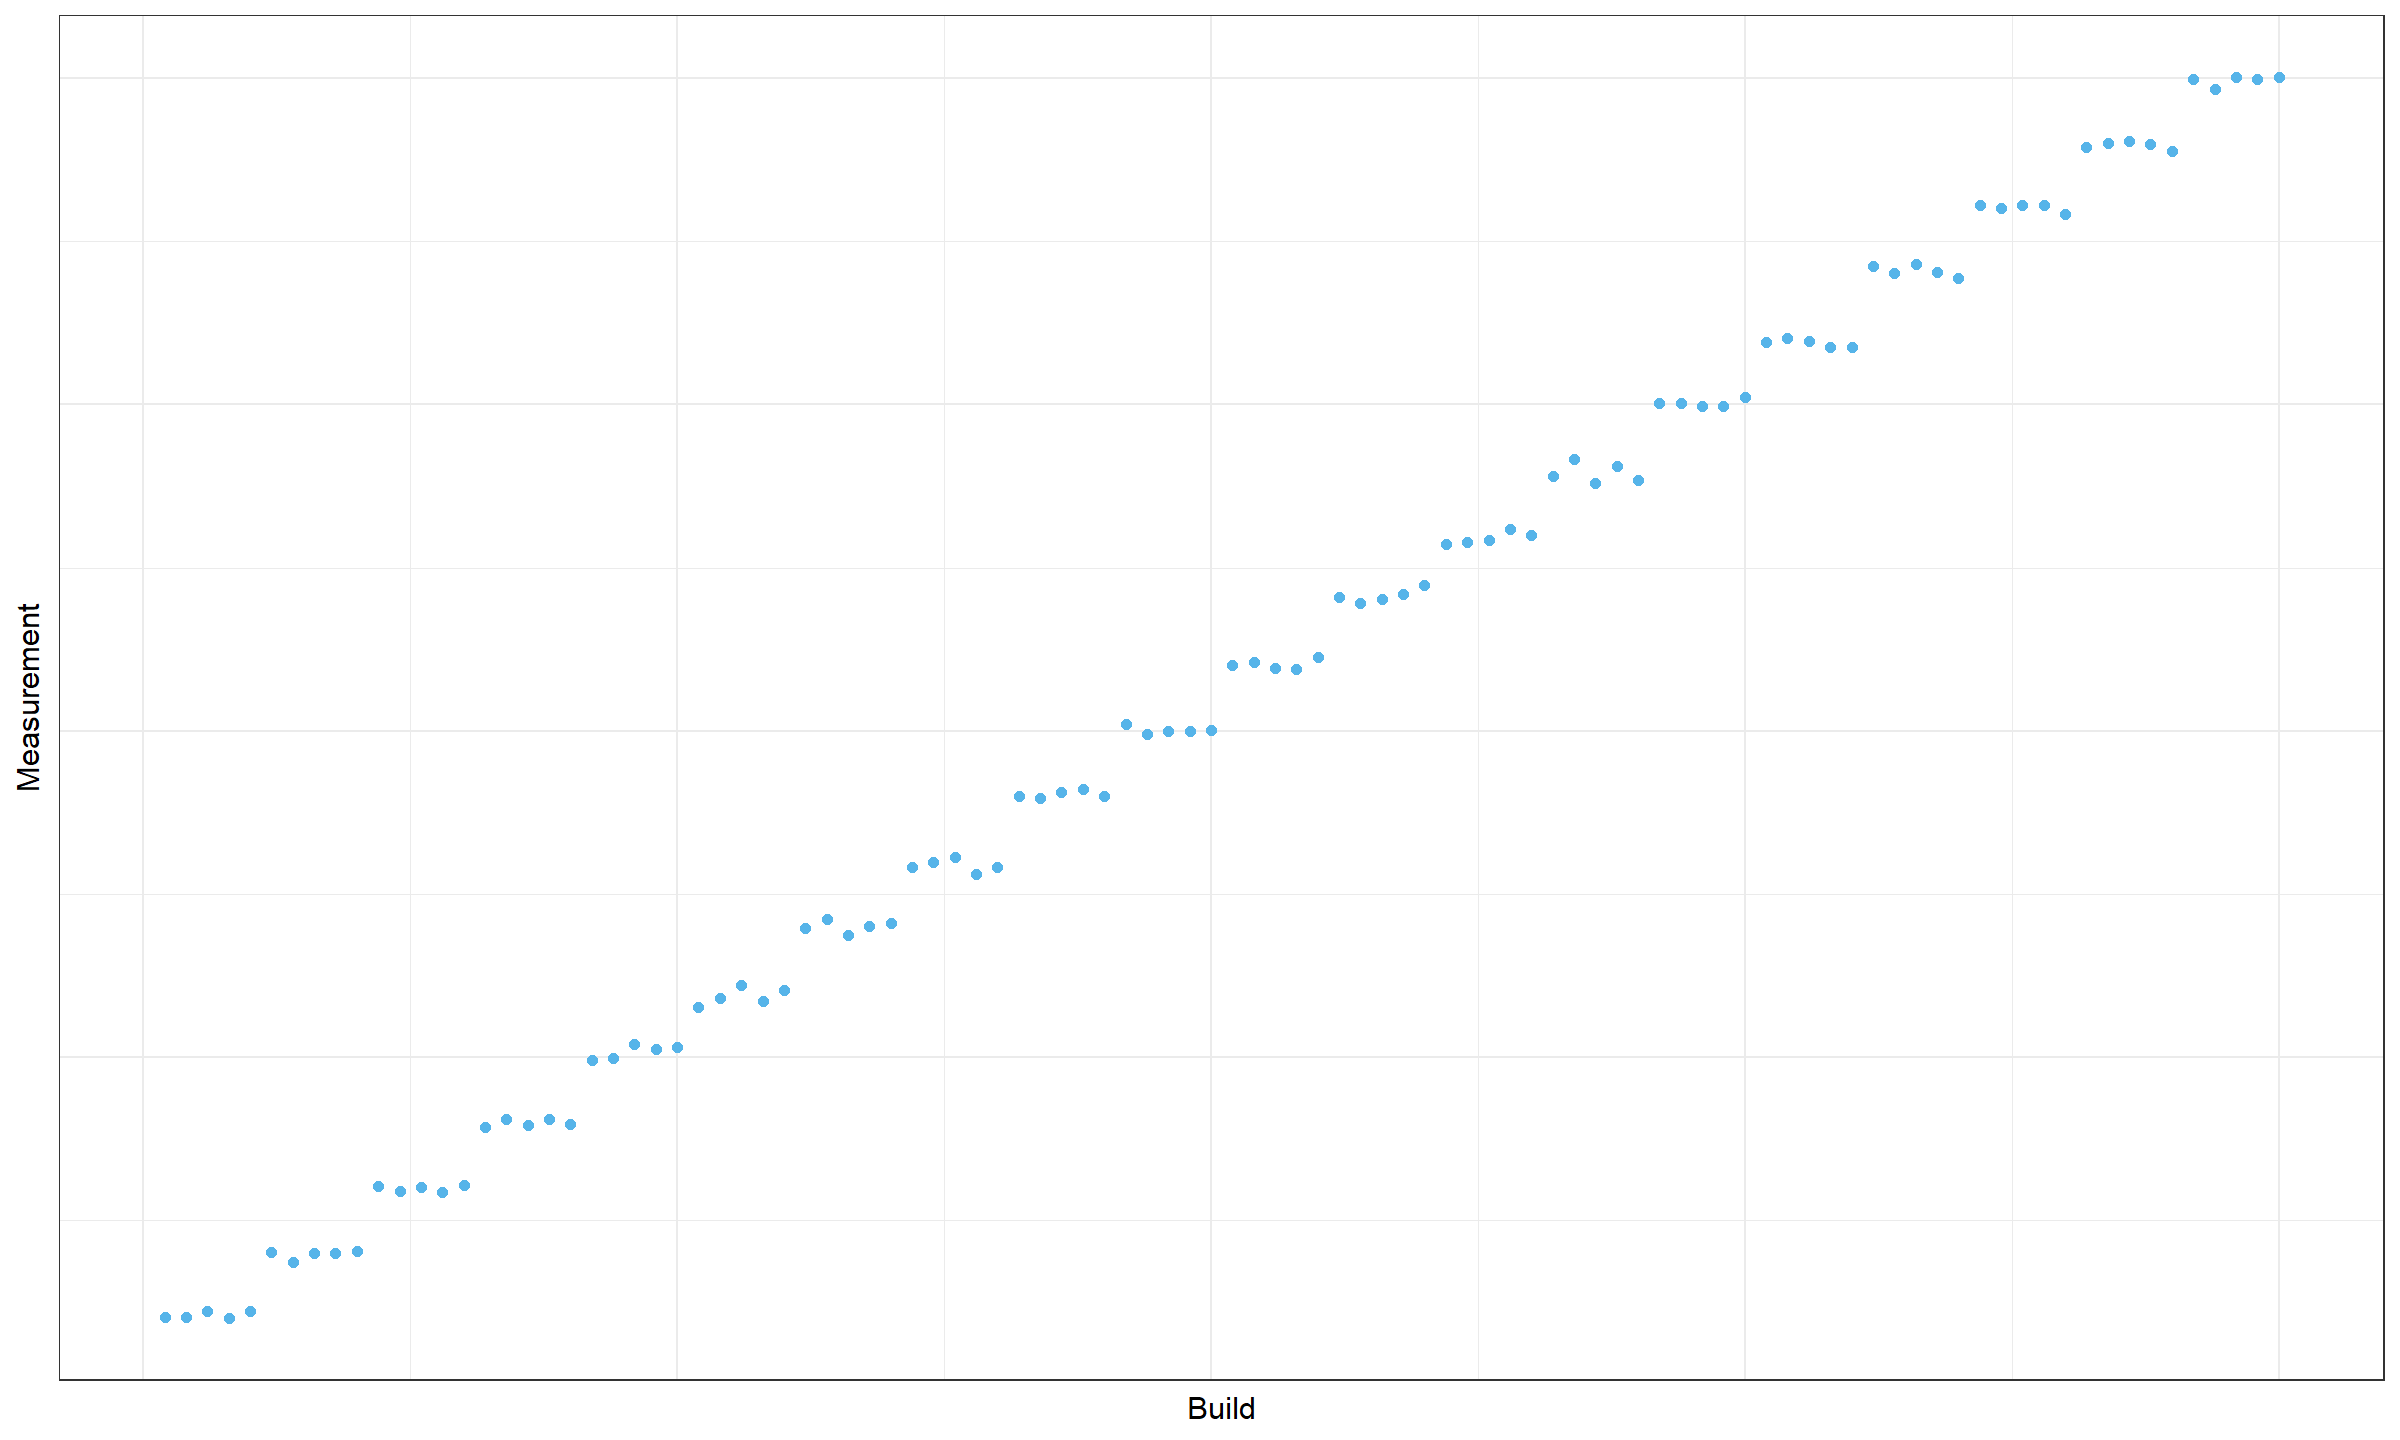
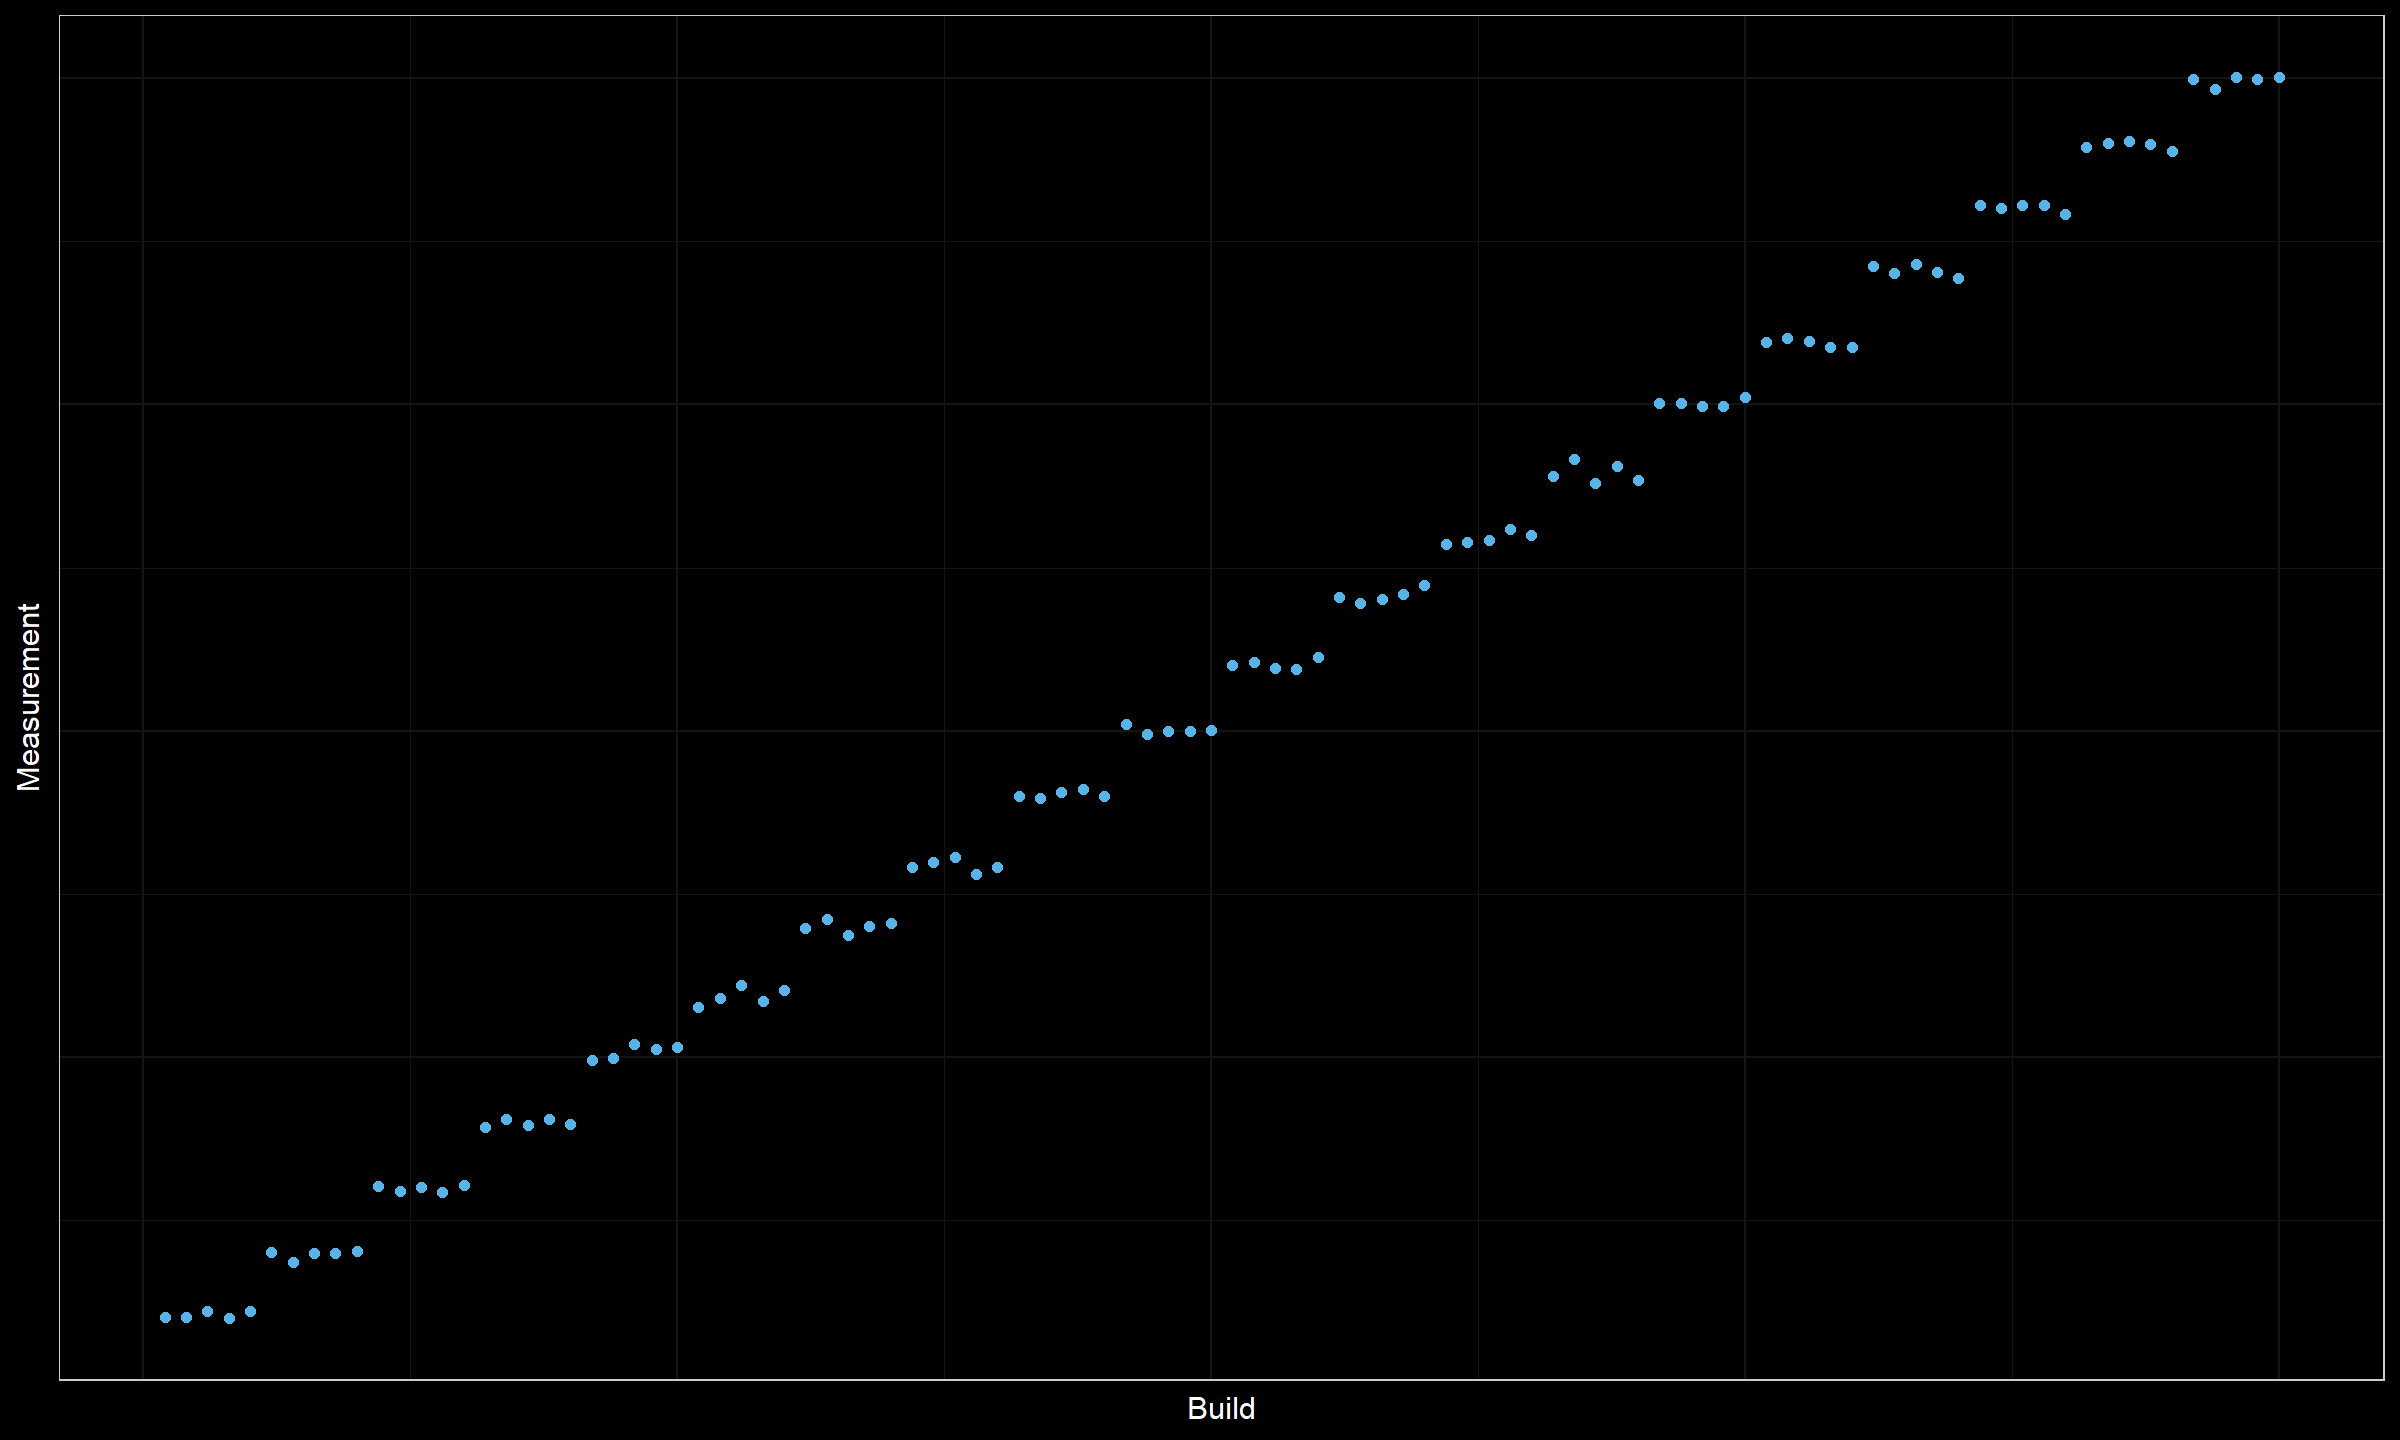
Obviously, we have a series of degradations here. However, all the obtained clusters are too small (only five data points in each cluster). With a requirement on the distance between change points, we will not be able to mark all the suspicious places as change points. Moreover, some of them may be pseudo-changes that were obtained by chance from the same sources. It’s also impossible to rank these suspicious change point candidates, all of them look almost the same.
Meanwhile, we have an obvious problem here. This problem should be definitely reported. But how should we choose the location of change points to report? We could pick random ones according to the requirement on the distance between change points, but how do we guarantee the persistence of the results? If we pick different partitions each time, it would lead to a huge number of alters (a situation that we want to avoid).
Conclusion
Change point detection is a difficult problem in any context. Additional task specifications from the domain area may make this problem even more difficult. Partial solutions may be useless if they produce too many false-positive alerts. How to choose a proper algorithm that satisfies all the requirements at the same time? It’s an excellent question. Unfortunately, I don’t have a silver bullet that fits any context and works without problems. However, I have some approaches that could be “good enough” under special circumstances. In future posts, I will speculate about some of the possible solutions.