Exploring the power curve of the Cucconi test
The Cucconi test is a nonparametric two-sample test that compares both location and scale. It is a classic example of the family of tests that perform such a comparison simultaneously instead of combining the results of a location test and a scale test. Intuitively, such an approach should fit well unimodal distributions. Moreover, it has the potential to outperform more generic nonparametric tests that do not rely on the unimodality assumption.
In this post, we briefly show the equations behind the Cucconi test and present a power curve that compares it with the Student’s t-test and the Mann-Whitney U test under normality.
The Cucconi test
Let $\mathbf{x} = (x_1, x_2, \ldots, x_n)$ and $\mathbf{y} = (y_1, y_2, \ldots, y_m)$ be random samples. Let $N=n+m$. Let $\mathbf{S} = (S_1, S_2, \ldots, S_m)$ be a vector of $\mathbf{y}$ ranks in the pooled sample $(\mathbf{x}, \mathbf{y})$. The Cucconi test statistic is defined as follows:
$$ C = \frac{U^2 + V^2 - 2\rho UV}{2(1-\rho^2)}, $$where
$$ U = \frac{ 6 \Sigma_{j=1}^{m} S_j^2 - m(N+1)(2N+1) }{ \sqrt{nm(N+1)(2N+1)(8N+11)/5} }, $$$$ V = \frac{ 6 \Sigma_{j=1}^{m} (N+1-S_j)^2 - m(N+1)(2N+1) }{ \sqrt{nm(N+1)(2N+1)(8N+11)/5} }, $$$$ \rho = \frac{2(N^2-4)}{(2N+1)(8N+11)} - 1. $$Here is a brief explanation of the above terms:
- $U$ captures the squared ranks of observations from the sample $\mathbf{y}$ within the pooled sample $(\mathbf{x}, \mathbf{y})$. Intuitively, it can be thought of as a reflection of how the ranks of the $\mathbf{y}$ sample observations deviate from their expected values under the null hypothesis of no difference in location and scale between the two samples. A larger absolute value of $U$ suggests a significant deviation.
- $V$, in contrast to $U$, captures the squared contrary ranks of the sample $\mathbf{y}$ within the pooled sample $(\mathbf{x}, \mathbf{y})$. Like $U$, it indicates deviations in rank but from the opposite perspective.
- $\rho$ is the correlation coefficient between $U$ and $V$.
Power curve
Here is the power curve by effect size for the two-sided Student’s t-test, Mann-Whitney U test, and Cucconi test under normality ($n=5$, $\alpha = 0.05$):
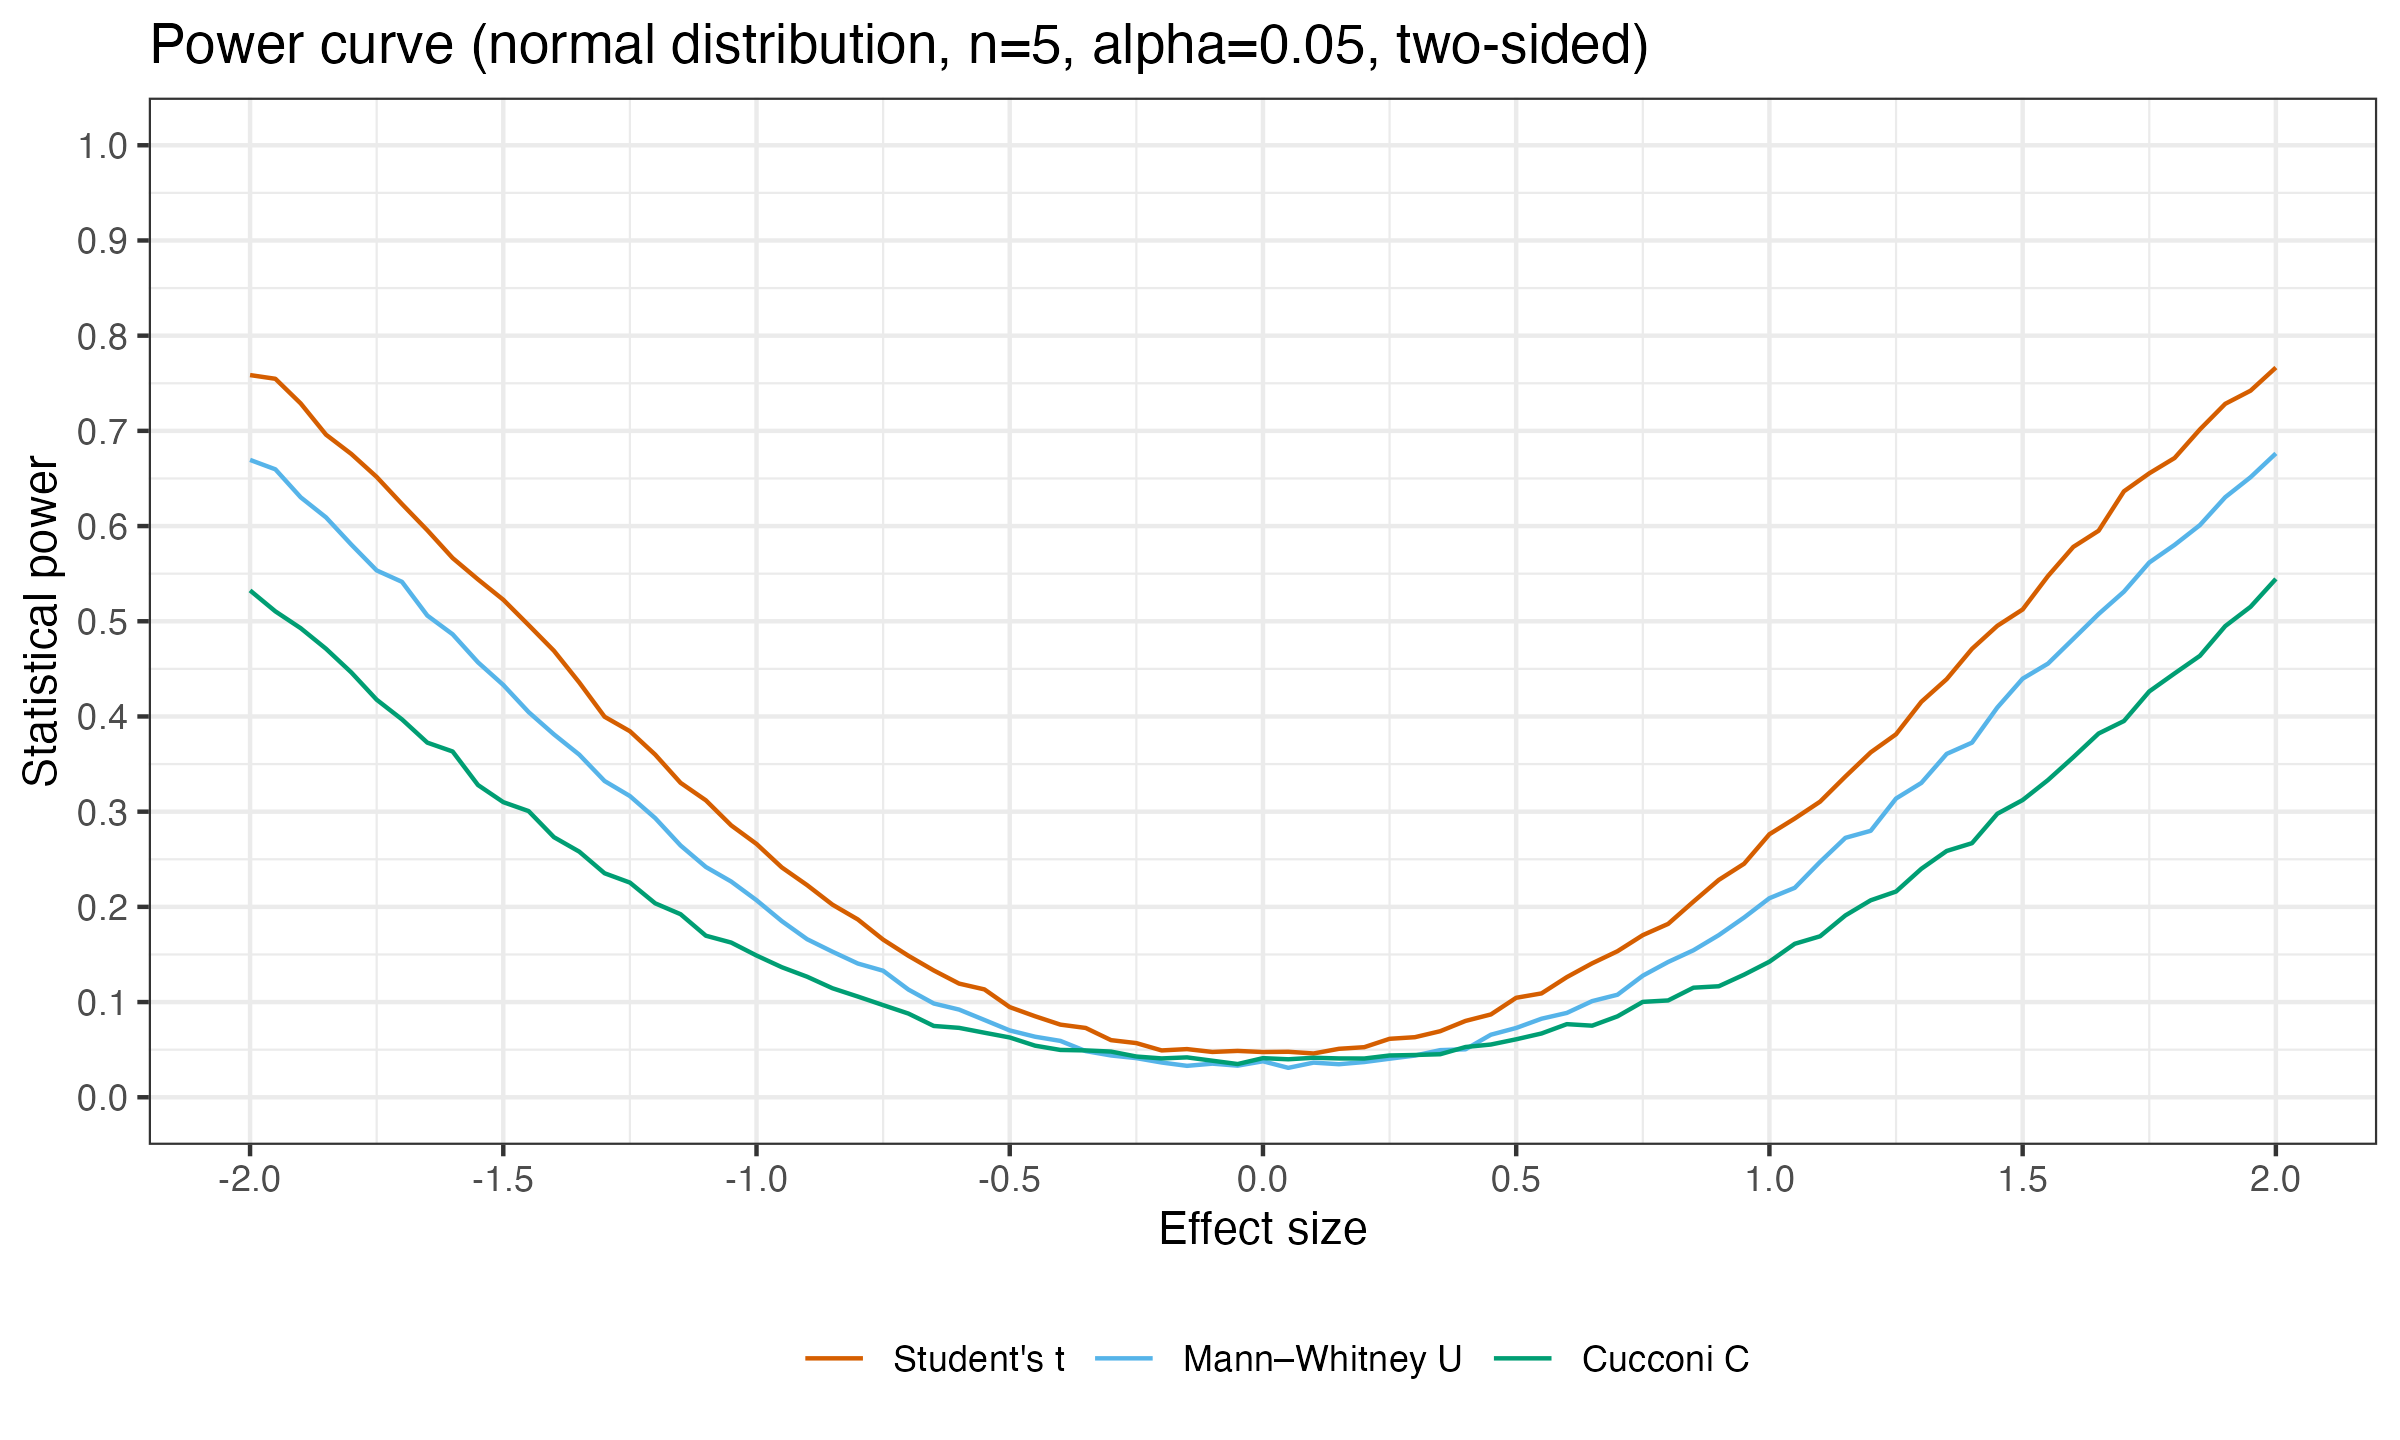
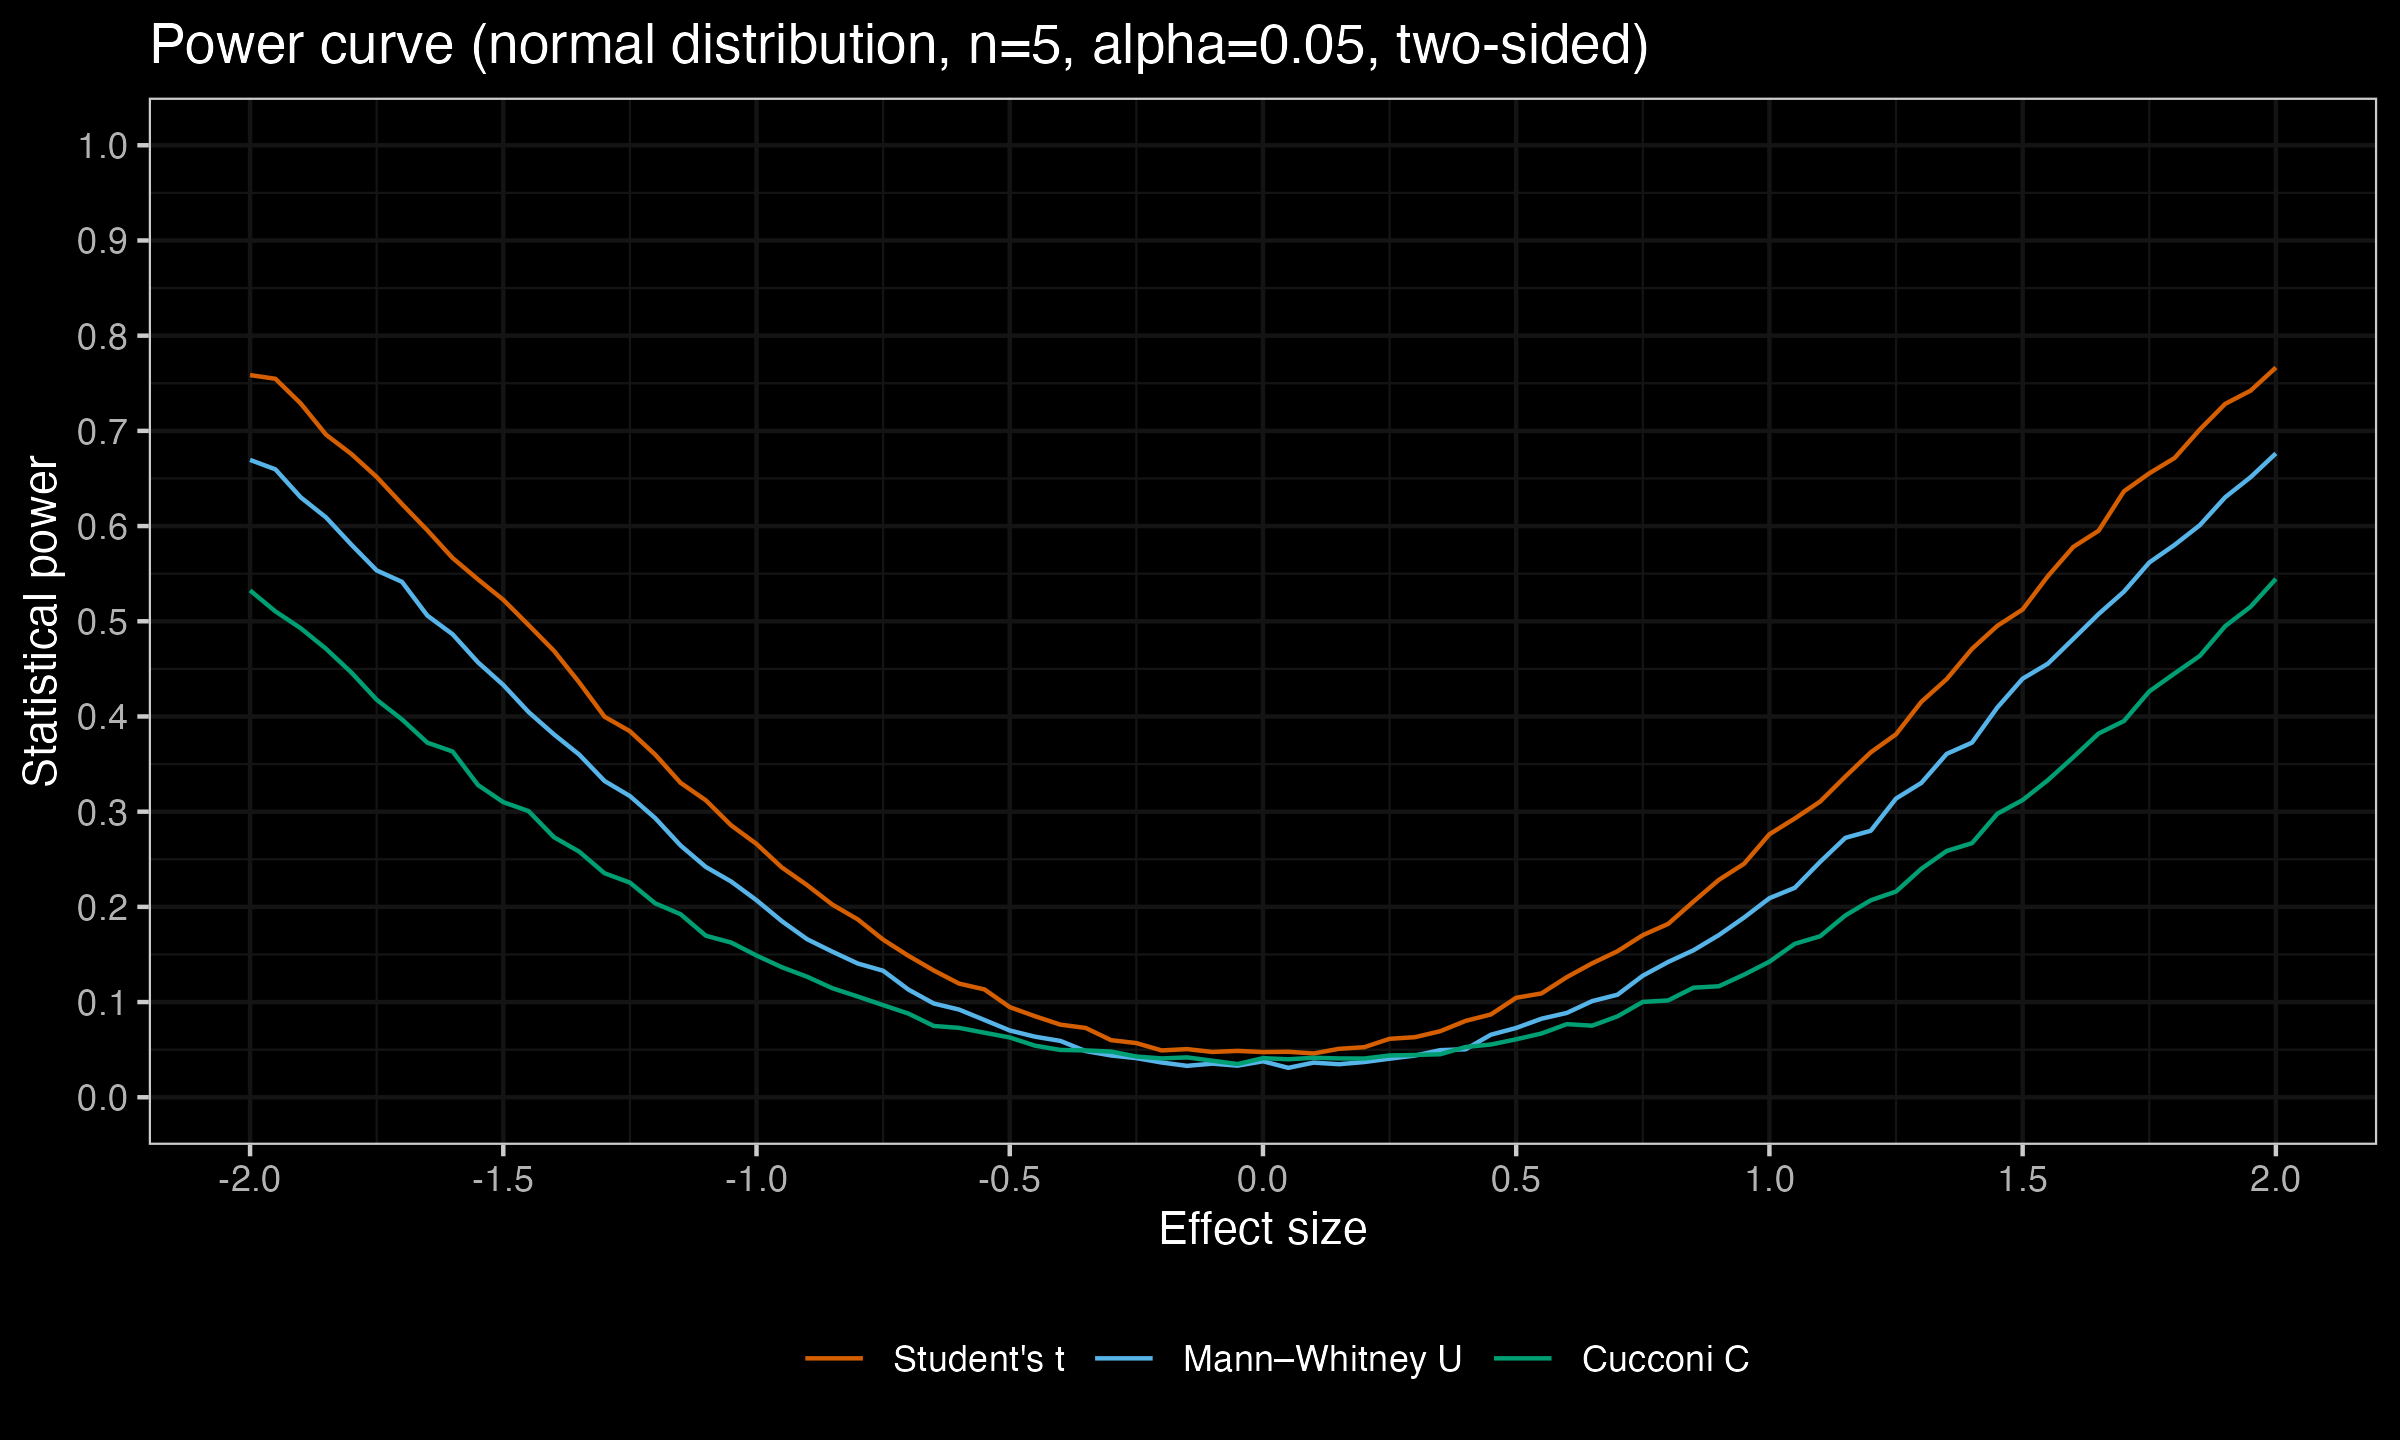
As we can see, in this particular study, the Cucconi test is the worst one: it has the lowest statistical power. In all the other experiments I tried, the Mann-Whitney U test always outperforms the Cucconi test.
Conclusion
From the power curve results and various experiments, it becomes evident that the Cucconi test falls short of expectations, especially when juxtaposed against the Mann-Whitney U test, which consistently exhibits superior performance. Nevertheless, the underlying concept of the Cucconi test — combining both location and scale comparisons — is both intriguing and theoretically sound. This lays the groundwork for the potential formulation of more robust tests that capitalize on the same principle.
In the forthcoming posts, I’ll venture into further exploration of nonparametric tests, specifically focusing on the Lepage-type tests.
References
- [Cucconi1968]
Cucconi, Odoardo (1968). “Un nuovo test non parametrico per il confronto tra due gruppi campionari”. Giornale Degli Economisti. 27 (3/4): 225–248.
https://www.jstor.org/stable/23241361 - [Marozzi2009]
Marozzi, Marco. “Some notes on the location–scale Cucconi test.” Journal of Nonparametric Statistics 21, no. 5 (2009): 629-647.
DOI: 10.1080/10485250902952435 - [Marozzi2013]
Marozzi, Marco. “Nonparametric simultaneous tests for location and scale testing: a comparison of several methods.” Communications in Statistics-Simulation and Computation 42, no. 6 (2013): 1298-1317.
DOI: 10.1080/03610918.2012.665546