Dynamical System Case Study 2 (Piecewise linear LLL-system)
We consider the following dynamical system:
$$ \begin{cases} \dot{x}_1 = L(a_1, k_1, x_3) - k_1 x_1,\\ \dot{x}_2 = L(a_2, k_2, x_1) - k_2 x_2,\\ \dot{x}_3 = L(a_3, k_3, x_2) - k_3 x_3, \end{cases} $$where $L$ is a piecewise linear function:
$$ L(a, k, x) = \begin{cases} ak & \quad \textrm{for}\; 0 \leq x \leq 1,\\ 0 & \quad \textrm{for}\; 1 < x. \end{cases} $$In this case study, we build a Shiny application that draws 3D phase portraits of this system for various sets of input parameters.
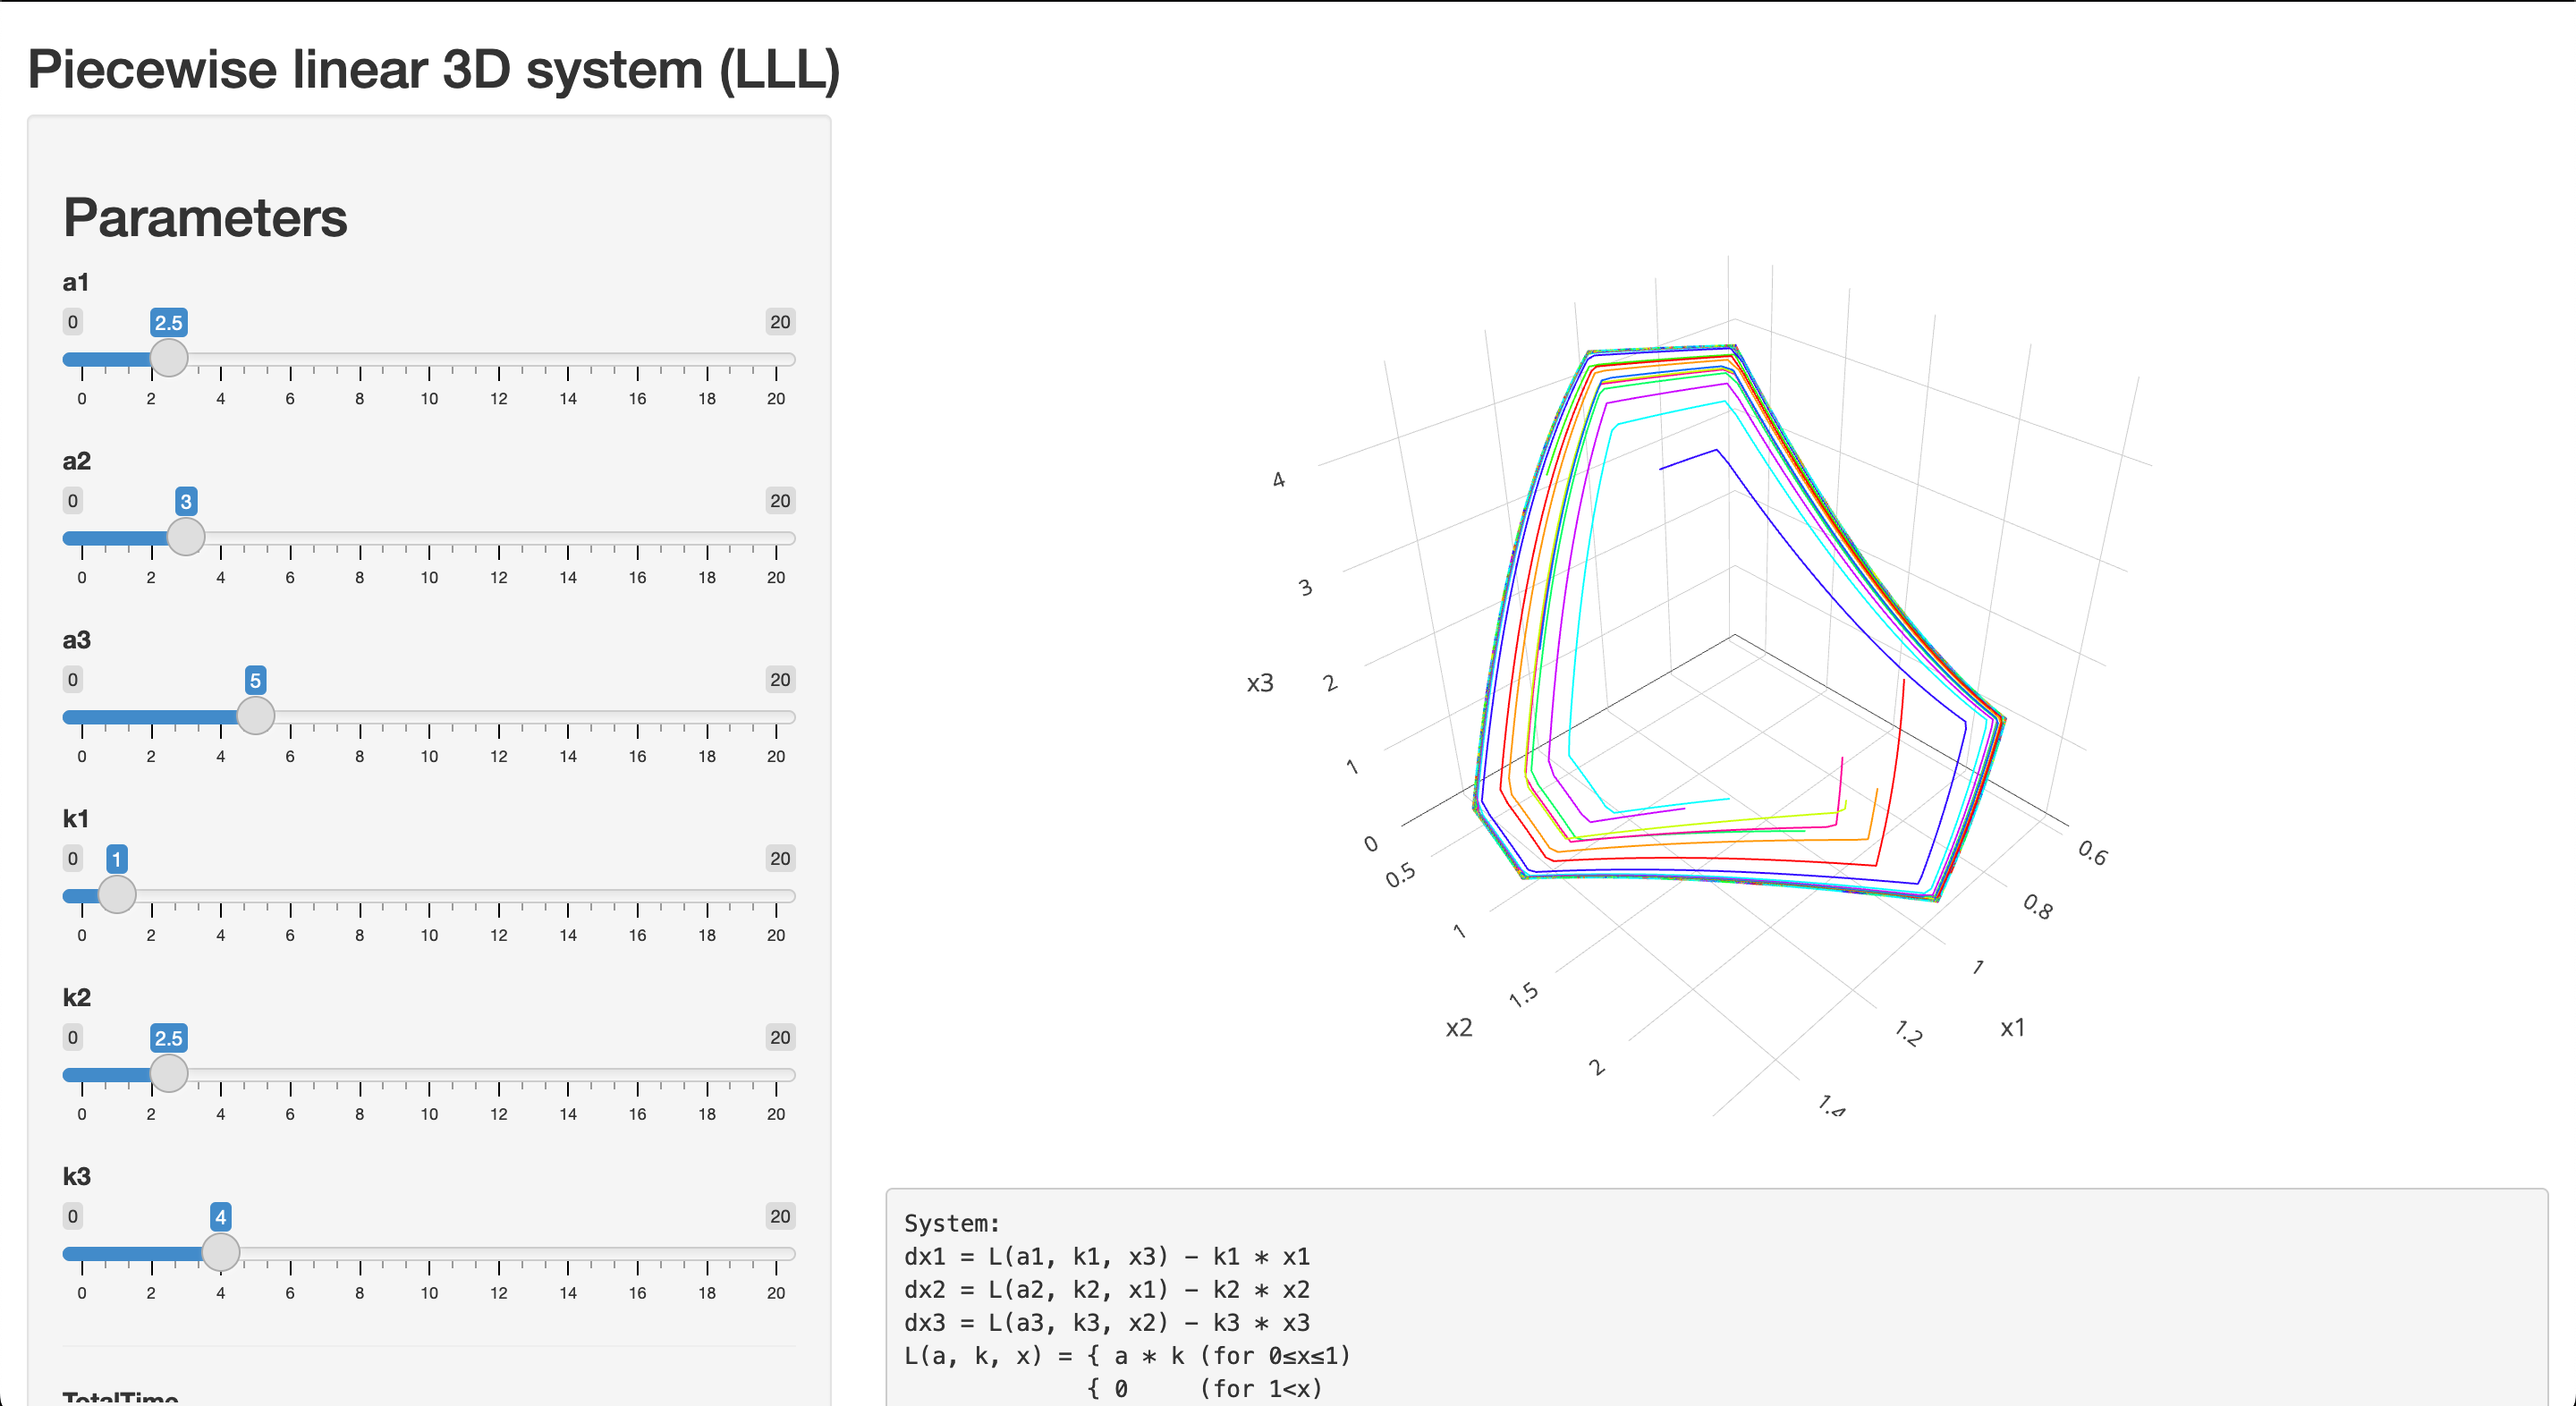
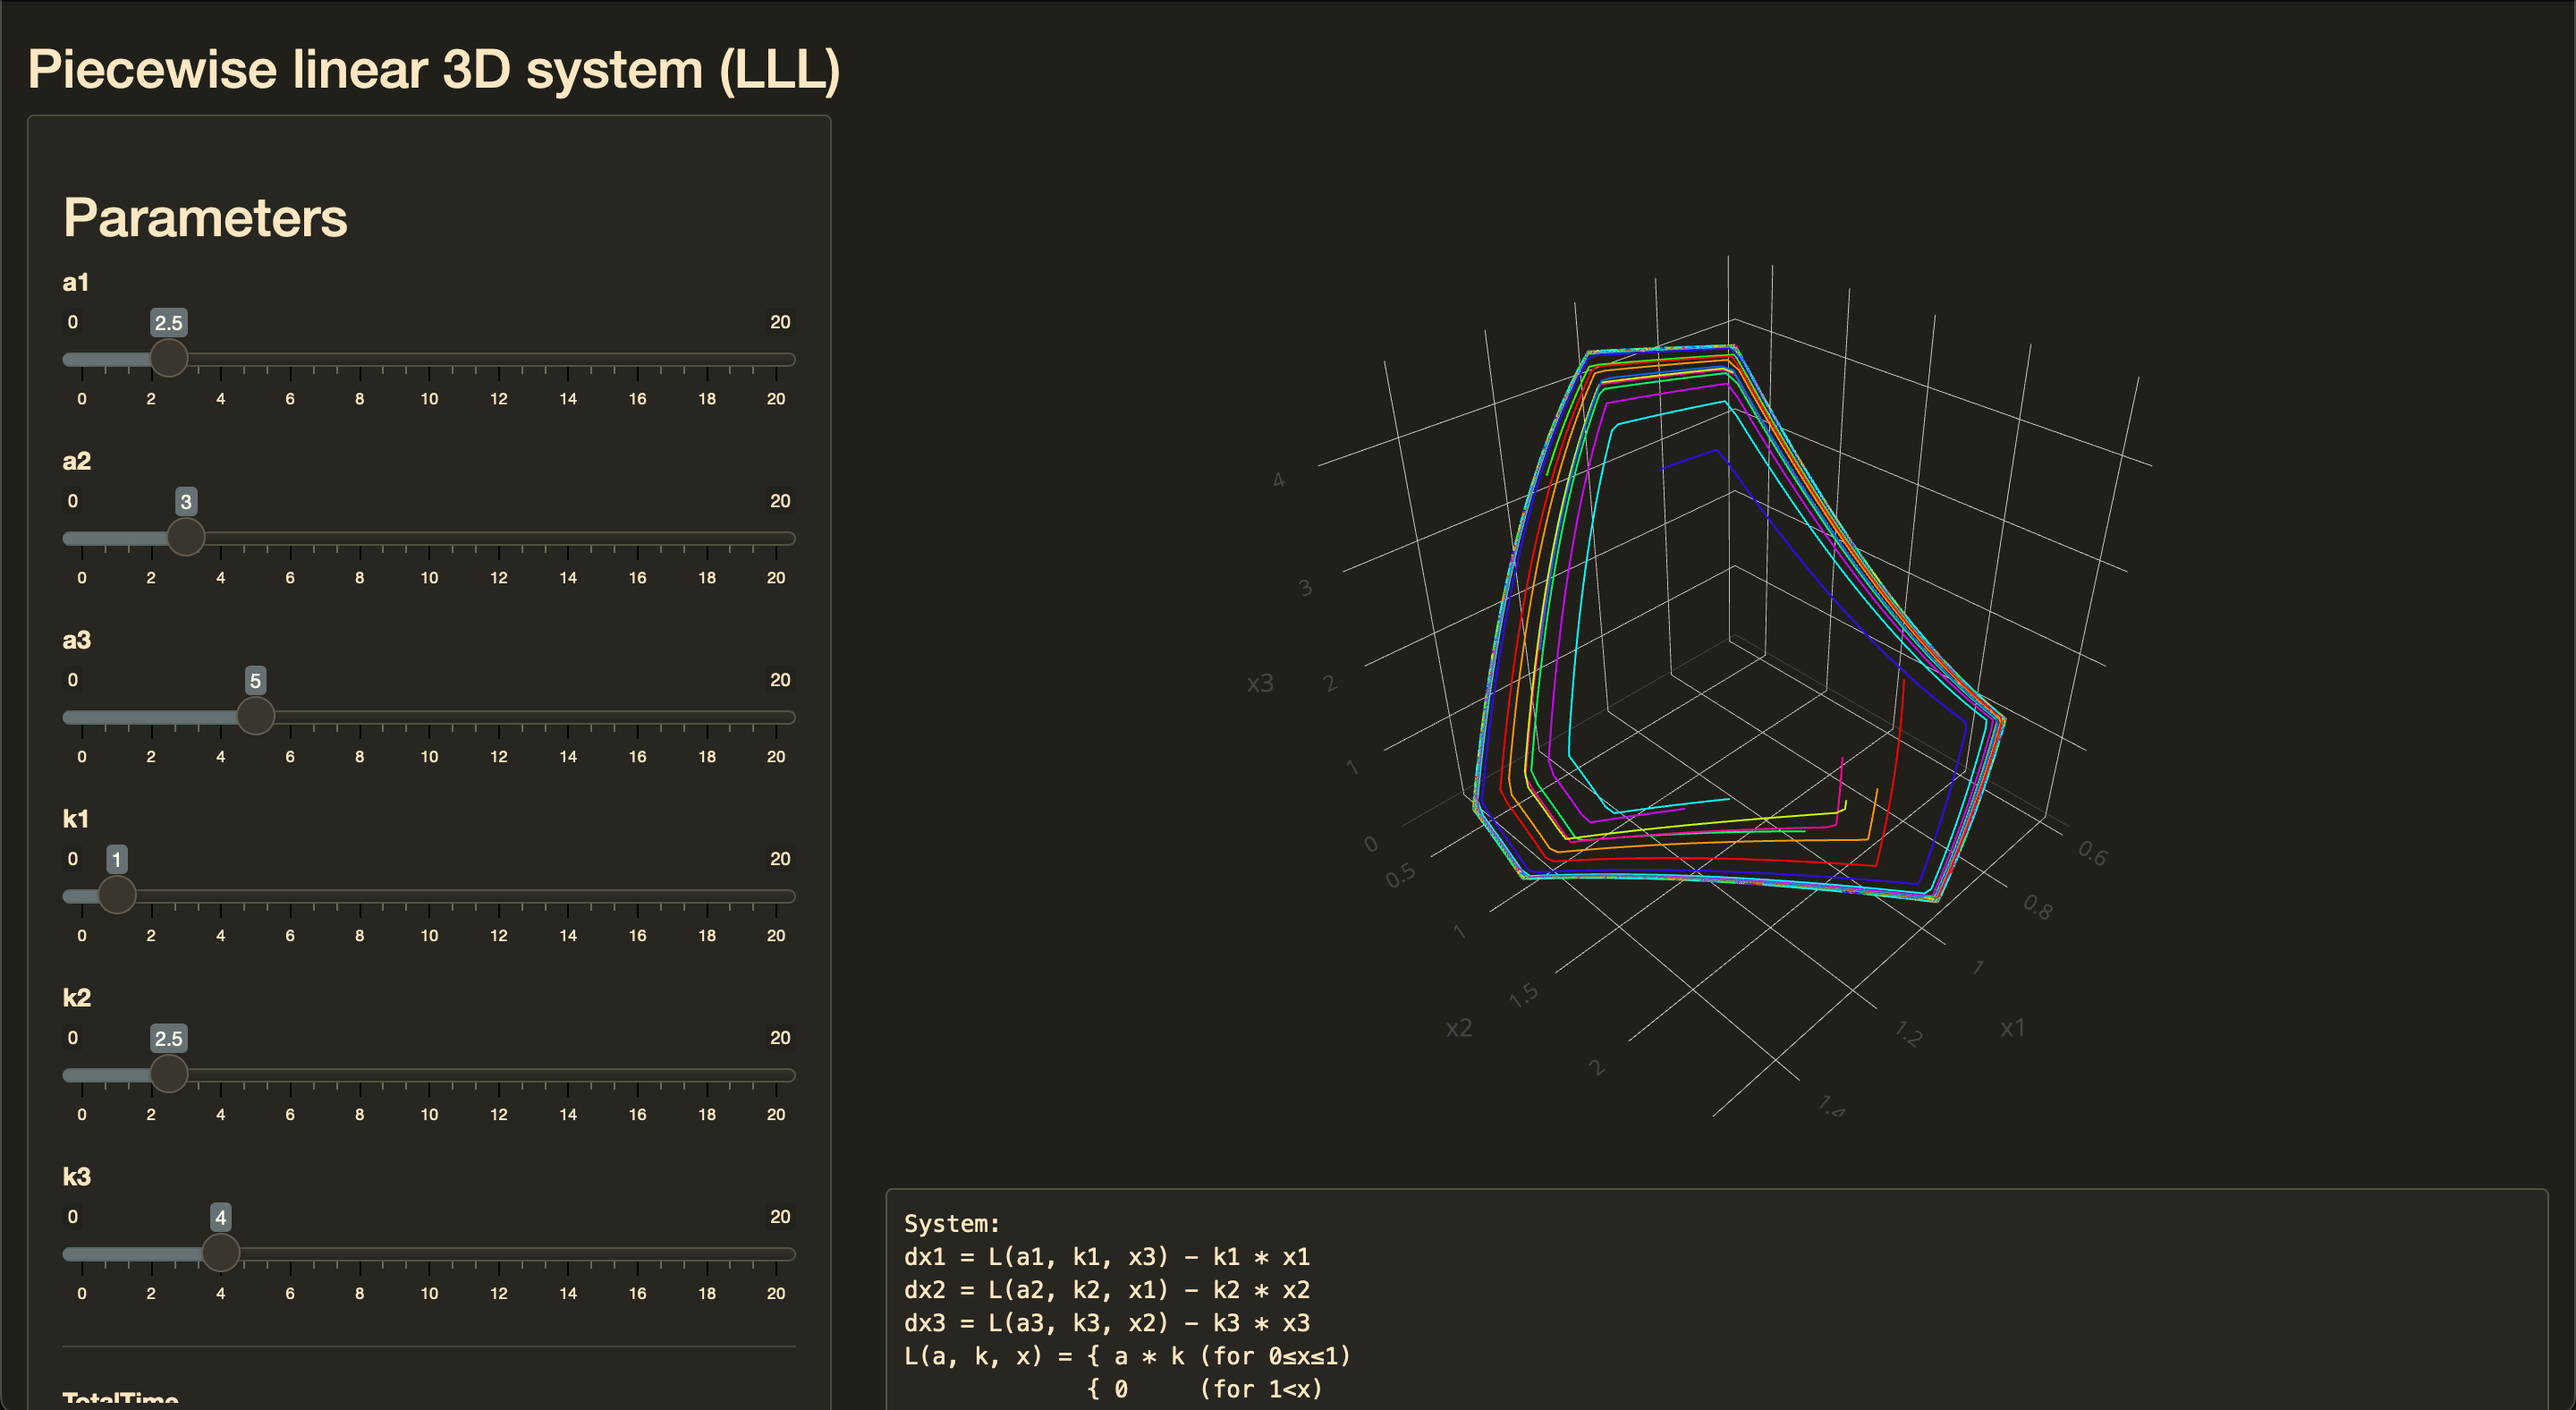
Shiny app parameters
The application allows controlling the following parameters:
- $a_1$, $a_2$, $a_3$, $k_1$, $k_2$, $k_3$: the dynamical system parameter.
- $\textrm{TotalTime}$: the total time simulation.
- $\textrm{SkipTime}$: the initial time interval that will not be presented on the plot.
- $N$: the number of simulated trajectories.
- $\textrm{Seed}$: the randomization seed that controls the initial positions of all the trajectories.
We uniformly generate the initial point for each simulated trajectory from the following area:
$$ [0.5; (2+a_1)/3] \times [0.5; (2+a_2)/3] \times [0.5; (2+a_3)/3]. $$Source code
The source code is also available on GitHub: https://github.com/AndreyAkinshin/pwLLL
core.R:
library(deSolve)

simulate <- function(context) {
  with(context, {
    L <- function(a, k, x) ifelse(x < 1, a * k, 0)

    model <- function(t, state, parms) {
      x1 <- as.numeric(state[1])
      x2 <- as.numeric(state[2])
      x3 <- as.numeric(state[3])
      list(c(
        dx1 = L(a1, k1, x3) - k1 * x1,
        dx2 = L(a2, k2, x1) - k2 * x2,
        dx3 = L(a3, k3, x2) - k3 * x3
      ))
    }

    times.step <- 0.01
    times.skip <- min(TotalTime, SkipTime)
    times <- seq(0, TotalTime, by = 0.01)

    simulate <- function(index) {
      get.start <- function(a) runif(1, 0.5, (2 + a) / 3)
      start <- c(x1 = get.start(a1), x2 = get.start(a2), x3 = get.start(a2))
      traj <- as.data.frame(lsoda(start, times, func = model, parms = 0))
      traj$name <- paste0("t", index)
      traj <- traj[round(times.skip / times.step):nrow(traj),]
      traj
    }
    set.seed(Seed)
    traj <- do.call("rbind", lapply(1:N, function(i) simulate(i)))

    list(
      context = context,
      model = model,
      traj = traj
    )
  })
}

randomCodeName <- function() {
  consonants <- c("b", "c", "d", "f", "g", "h", "j", "k", "l", "m", "n",
                  "p", "q", "r", "s", "t", "v", "w", "x", "y", "z")
  vowels <- c("a", "e", "i", "o", "u")
  paste0(sample(consonants, 1), sample(vowels, 1),
         sample(consonants, 1), sample(vowels, 1),
         sample(consonants, 1))
}
server.R:
library(shiny)
library(ggplot2)
library(deSolve)
library(plotly)
library(dplyr)
library(rlist)
library(tidyr)
source("core.R")
shinyServer(function(input, output, session) {
output$plot3D <- renderPlotly({
req(input$a1)
req(input$a2)
req(input$a3)
req(input$k1)
req(input$k2)
req(input$k3)
req(input$TotalTime)
req(input$SkipTime)
req(input$N)
req(input$Seed)
context <- list(
a1 = input$a1,
a2 = input$a2,
a3 = input$a3,
k1 = input$k1,
k2 = input$k2,
k3 = input$k3,
TotalTime = input$TotalTime,
SkipTime = input$SkipTime,
N = input$N,
Seed= input$Seed
)
res <- simulate(context)
traj <- res$traj
plot_ly(
traj, x = ~x1, y = ~x2, z = ~x3,
type = 'scatter3d', mode = 'lines', opacity = 1, color = ~name,
colors = sample(rainbow(length(unique(traj$name))))) %>%
layout(showlegend = FALSE, width = 900, height = 600)
})
output$htmlOutput <- renderUI({
context <- reactiveValuesToList(input)
rnd <- function(x) { if (is.complex(x) & abs(Im(x)) < 1e-9) round(Re(x), 6) else round(x, 6) }
fmt <- function(x) { if (is.na(x)) " ?" else formatC(x, digits = 6, width = 10, format = "f") }
hr <- "-----------------------------------------------------------------<br>"
text <- with(context, {
paste0(
"<pre>",
"System:<br>",
"dx1 = L(a1, k1, x3) - k1 * x1<br>",
"dx2 = L(a2, k2, x1) - k2 * x2<br>",
"dx3 = L(a3, k3, x2) - k3 * x3<br>",
"L(a, k, x) = { a * k (for 0≤x≤1)<br>",
" { 0 (for 1<x)<br>",
"<br>",
"Parameters:<br>",
"a1 = ", a1, "<br>",
"a2 = ", a2, "<br>",
"a3 = ", a3, "<br>",
"k1 = ", k1, "<br>",
"k2 = ", k2, "<br>",
"k3 = ", k3, "<br>",
"TotalTime = ", TotalTime, "<br>",
"SkipTime = ", SkipTime, "<br>",
"N = ", N, "<br>",
"Seed = ", Seed, "<br>",
"</pre>"
)
})
HTML(text)
})
output$save_state <- downloadHandler(
filename = function() {
paste0("data-", Sys.Date(), "-", randomCodeName(), ".yaml")
},
content = function(file) {
data <- list(
a1 = input$a1,
a2 = input$a2,
a3 = input$a3,
k1 = input$k1,
k2 = input$k2,
k3 = input$k3,
TotalTime = input$TotalTime,
SkipTime = input$SkipTime,
N = input$N,
Seed = input$Seed
)
data <- data[names(data) != "restore_state"]
list.save(data, file)
}
)
loadedData <- reactive({
list.load(input$restore_state$datapath)
})
observe({
data <- loadedData()
updateSliderInput(session, "a1", value = data$a1)
updateSliderInput(session, "a2", value = data$a2)
updateSliderInput(session, "a3", value = data$a3)
updateSliderInput(session, "k1", value = data$k1)
updateSliderInput(session, "k2", value = data$k2)
updateSliderInput(session, "k3", value = data$k3)
updateSliderInput(session, "TotalTime", value = data$TotalTime)
updateSliderInput(session, "SkipTime", value = data$SkipTime)
updateSliderInput(session, "N", value = data$N)
updateSliderInput(session, "Seed", value = data$Seed)
})
})
ui.R:
library(shiny)
library(plotly)

slider <- function(title, min, max, value = min) {
  sliderInput(title, title, min, max, value, 0.1)
}
sliderA <- function(title, value = 10) slider(title, 0, 20, value)
sliderK <- function(title, value = 1) slider(title, 0, 20, value)

shinyUI(fluidPage(

  titlePanel("Piecewise linear 3D system (LLL)"),

  sidebarLayout(
    sidebarPanel(
      div(style = "overflow-y:scroll; max-height: 700px; position:relative;",
      h2("Parameters"),

      sliderA("a1", 2.5),
      sliderA("a2", 3),
      sliderA("a3", 5),

      sliderK("k1", 1),
      sliderK("k2", 2.5),
      sliderK("k3", 4),

      hr(),

      sliderInput("TotalTime", "TotalTime", 1, 100, 10, 1),
      sliderInput("SkipTime", "SkipTime", 0, 20, 0.2, 0.1),
      sliderInput("N", "N (number of trajectories)", 1, 100, 10, 1),
      sliderInput("Seed", "Randomization seed", 1, 100, 1, 1),

      br(),
      br(),
      downloadButton("save_state", "Save parameters to file"),
      br(),
      br(),
      fileInput("restore_state", "Load parameters from file",
                placeholder = ".yaml file")
    )),

    mainPanel(
      plotlyOutput("plot3D", width = "900px", height = "600px"),
      htmlOutput("htmlOutput")
    )
  )
))