Fence-based outlier detectors, Part 2
In the previous post, I discussed different fence-based outlier detectors. In this post, I show some examples of these detectors with different parameters.
We continue using the notation from the previous post. In order to demonstrate the different in outlier detection between different methods, we do the following:
- Enumerate different distributions: Uniform, Normal, Gumbel, Exponential, Lognormal, Frechet, Weibull.
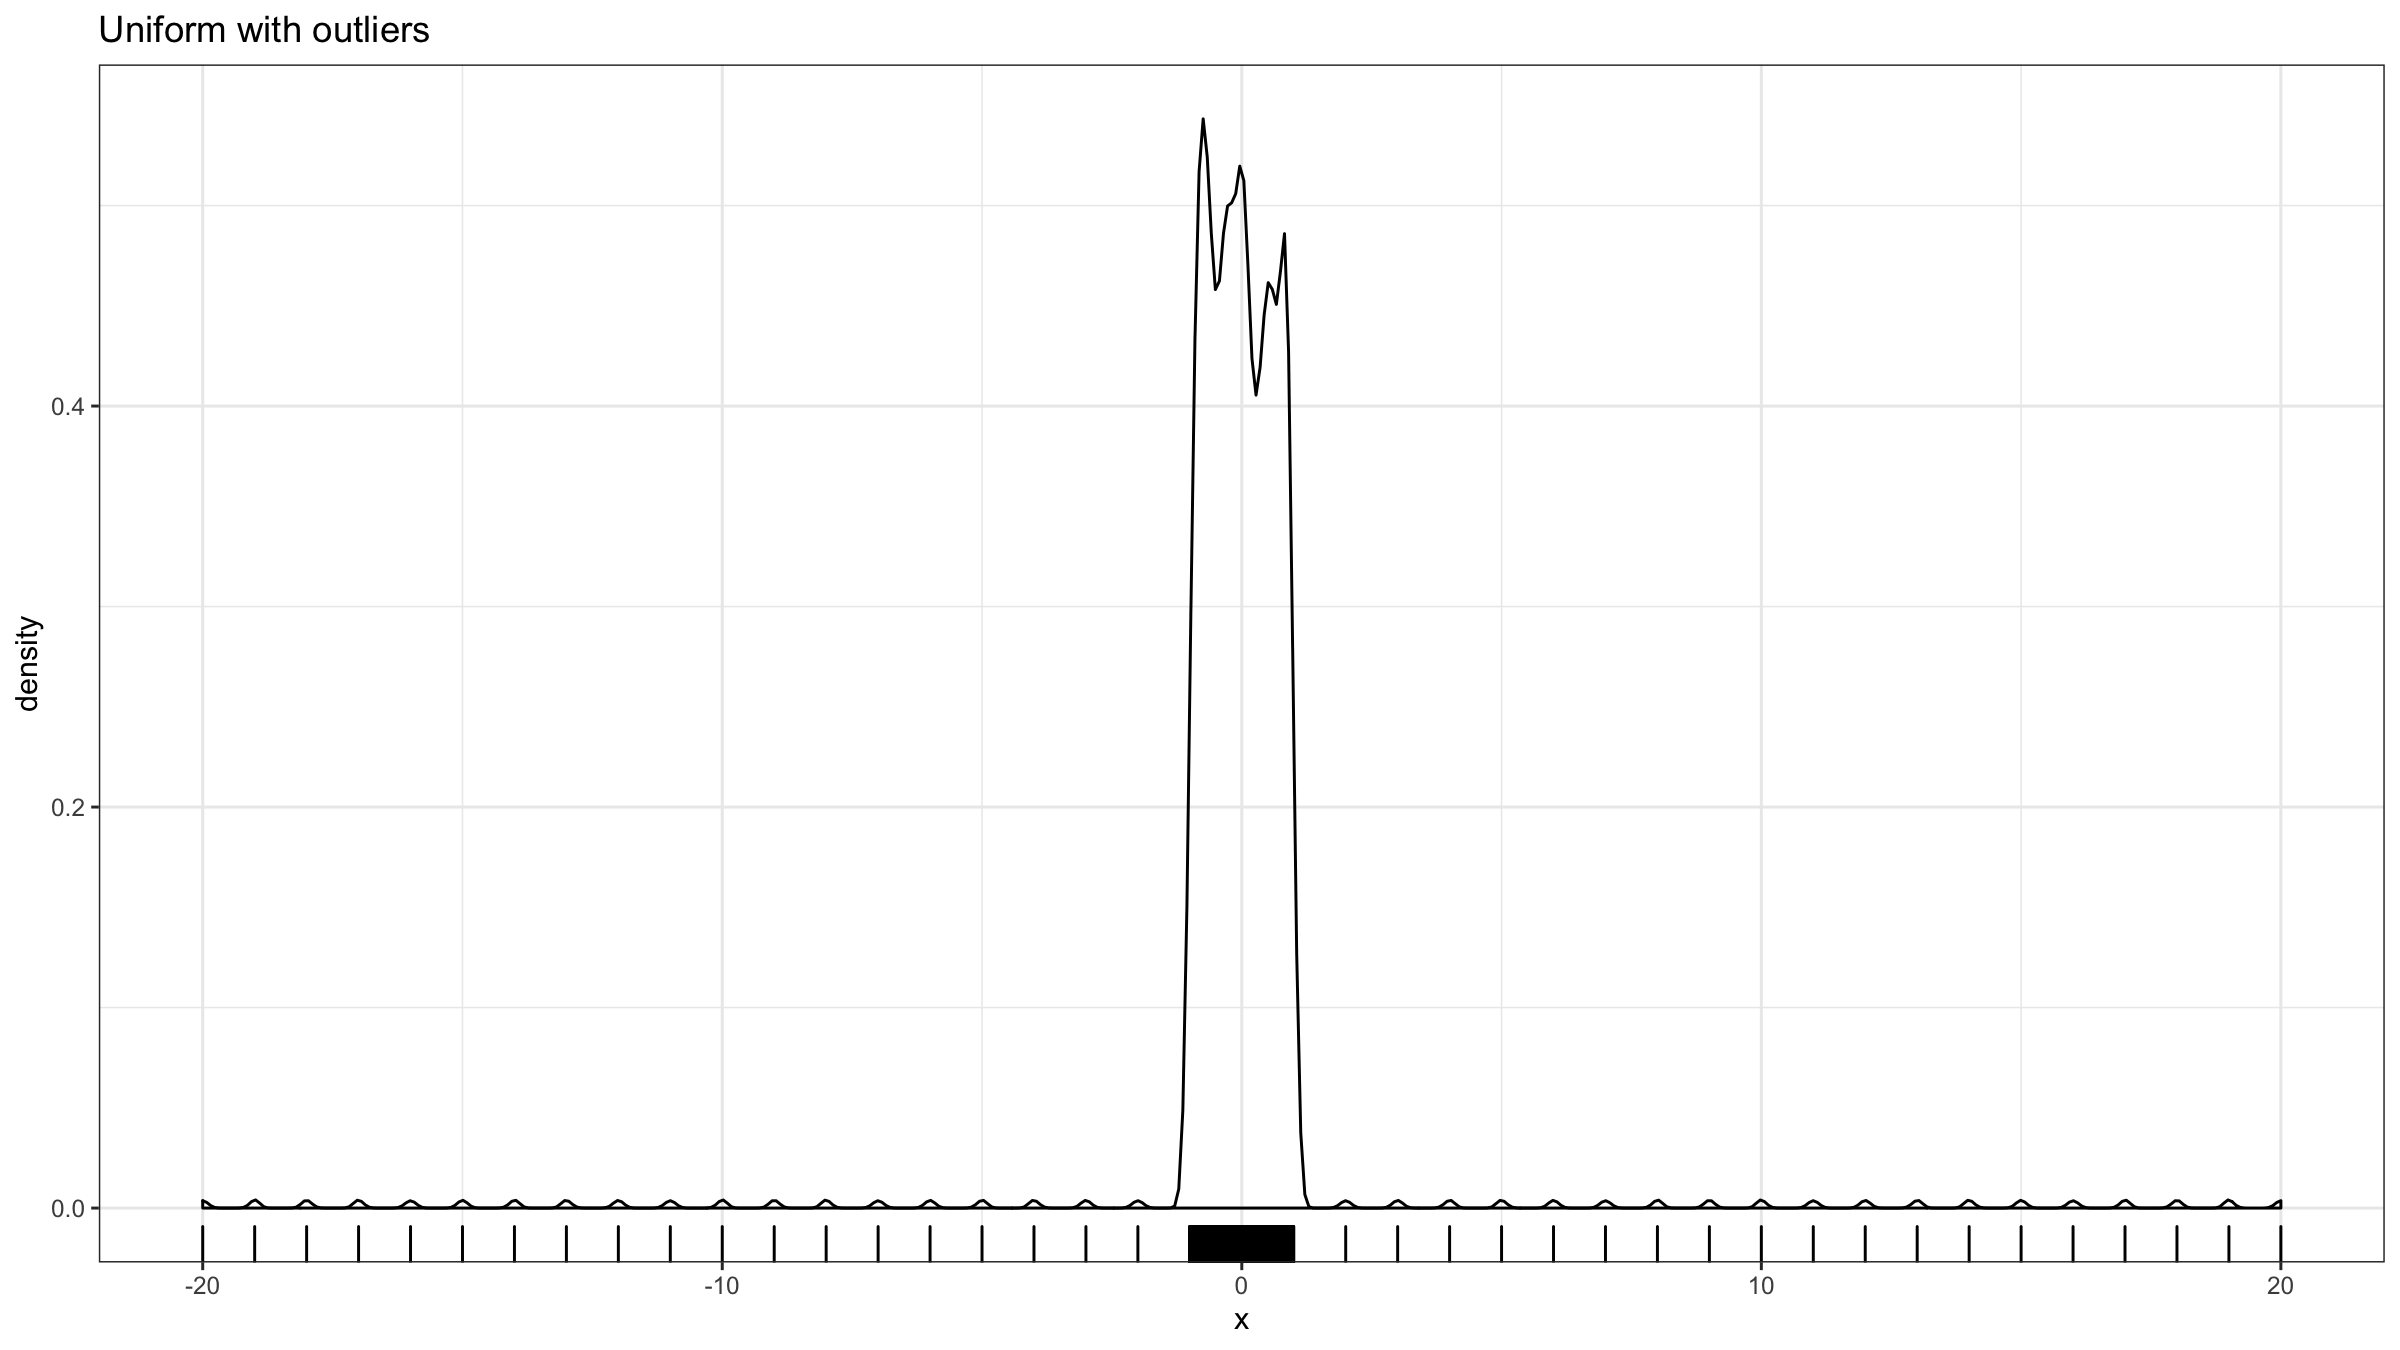
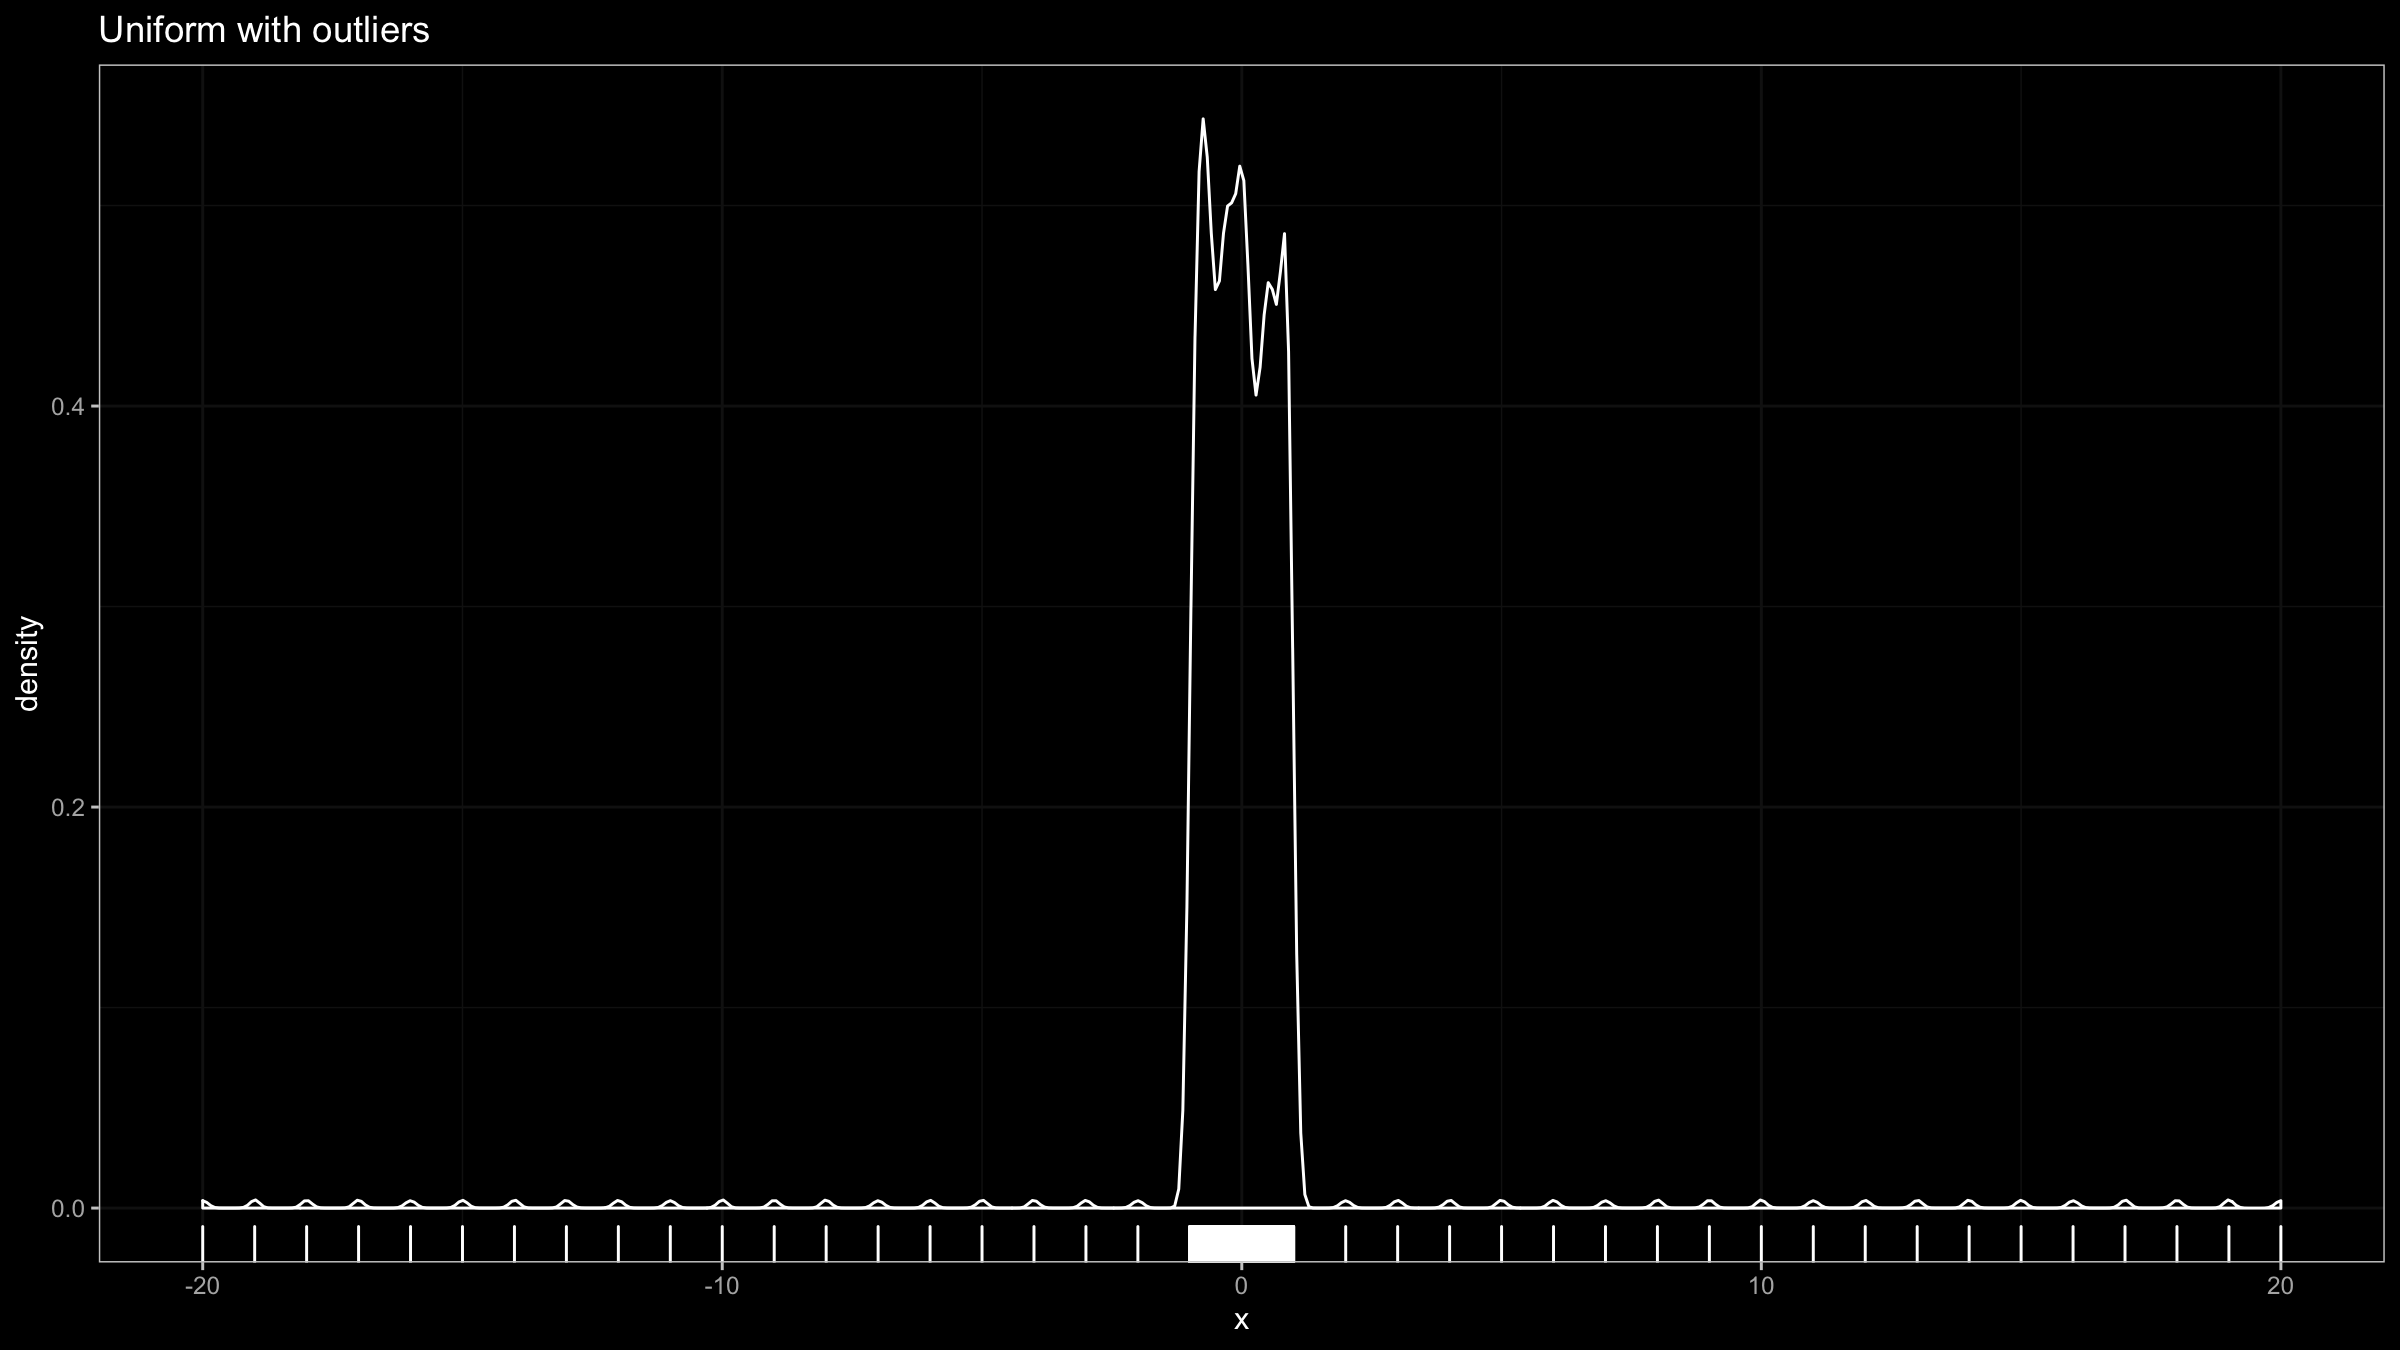
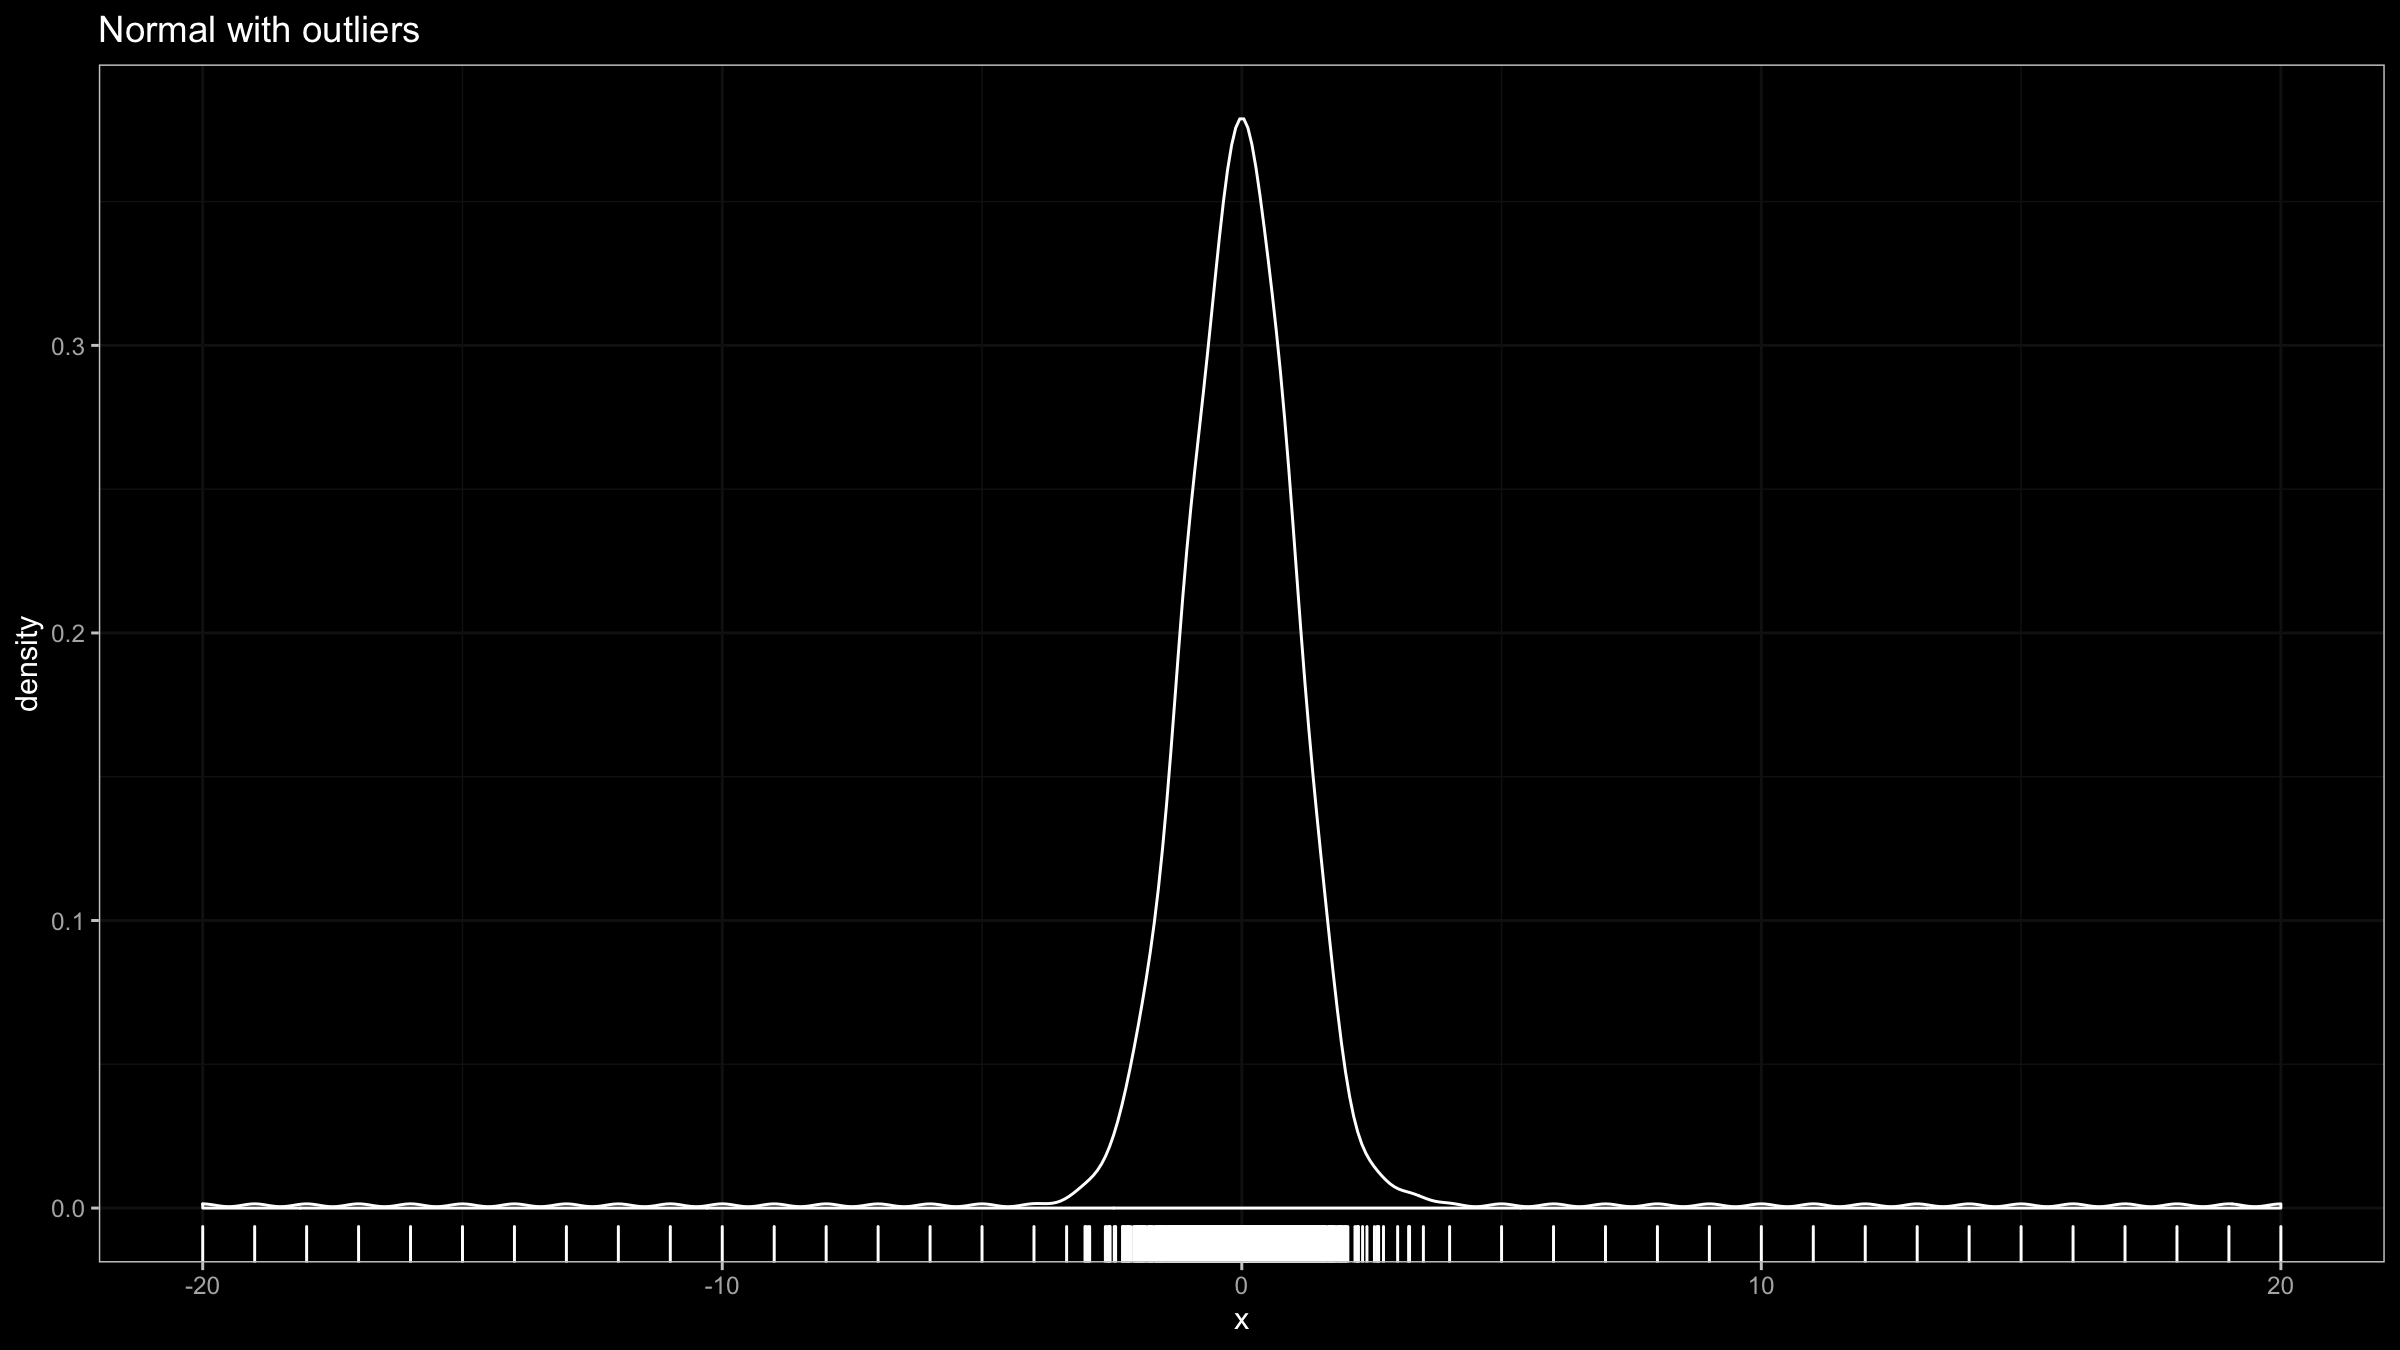
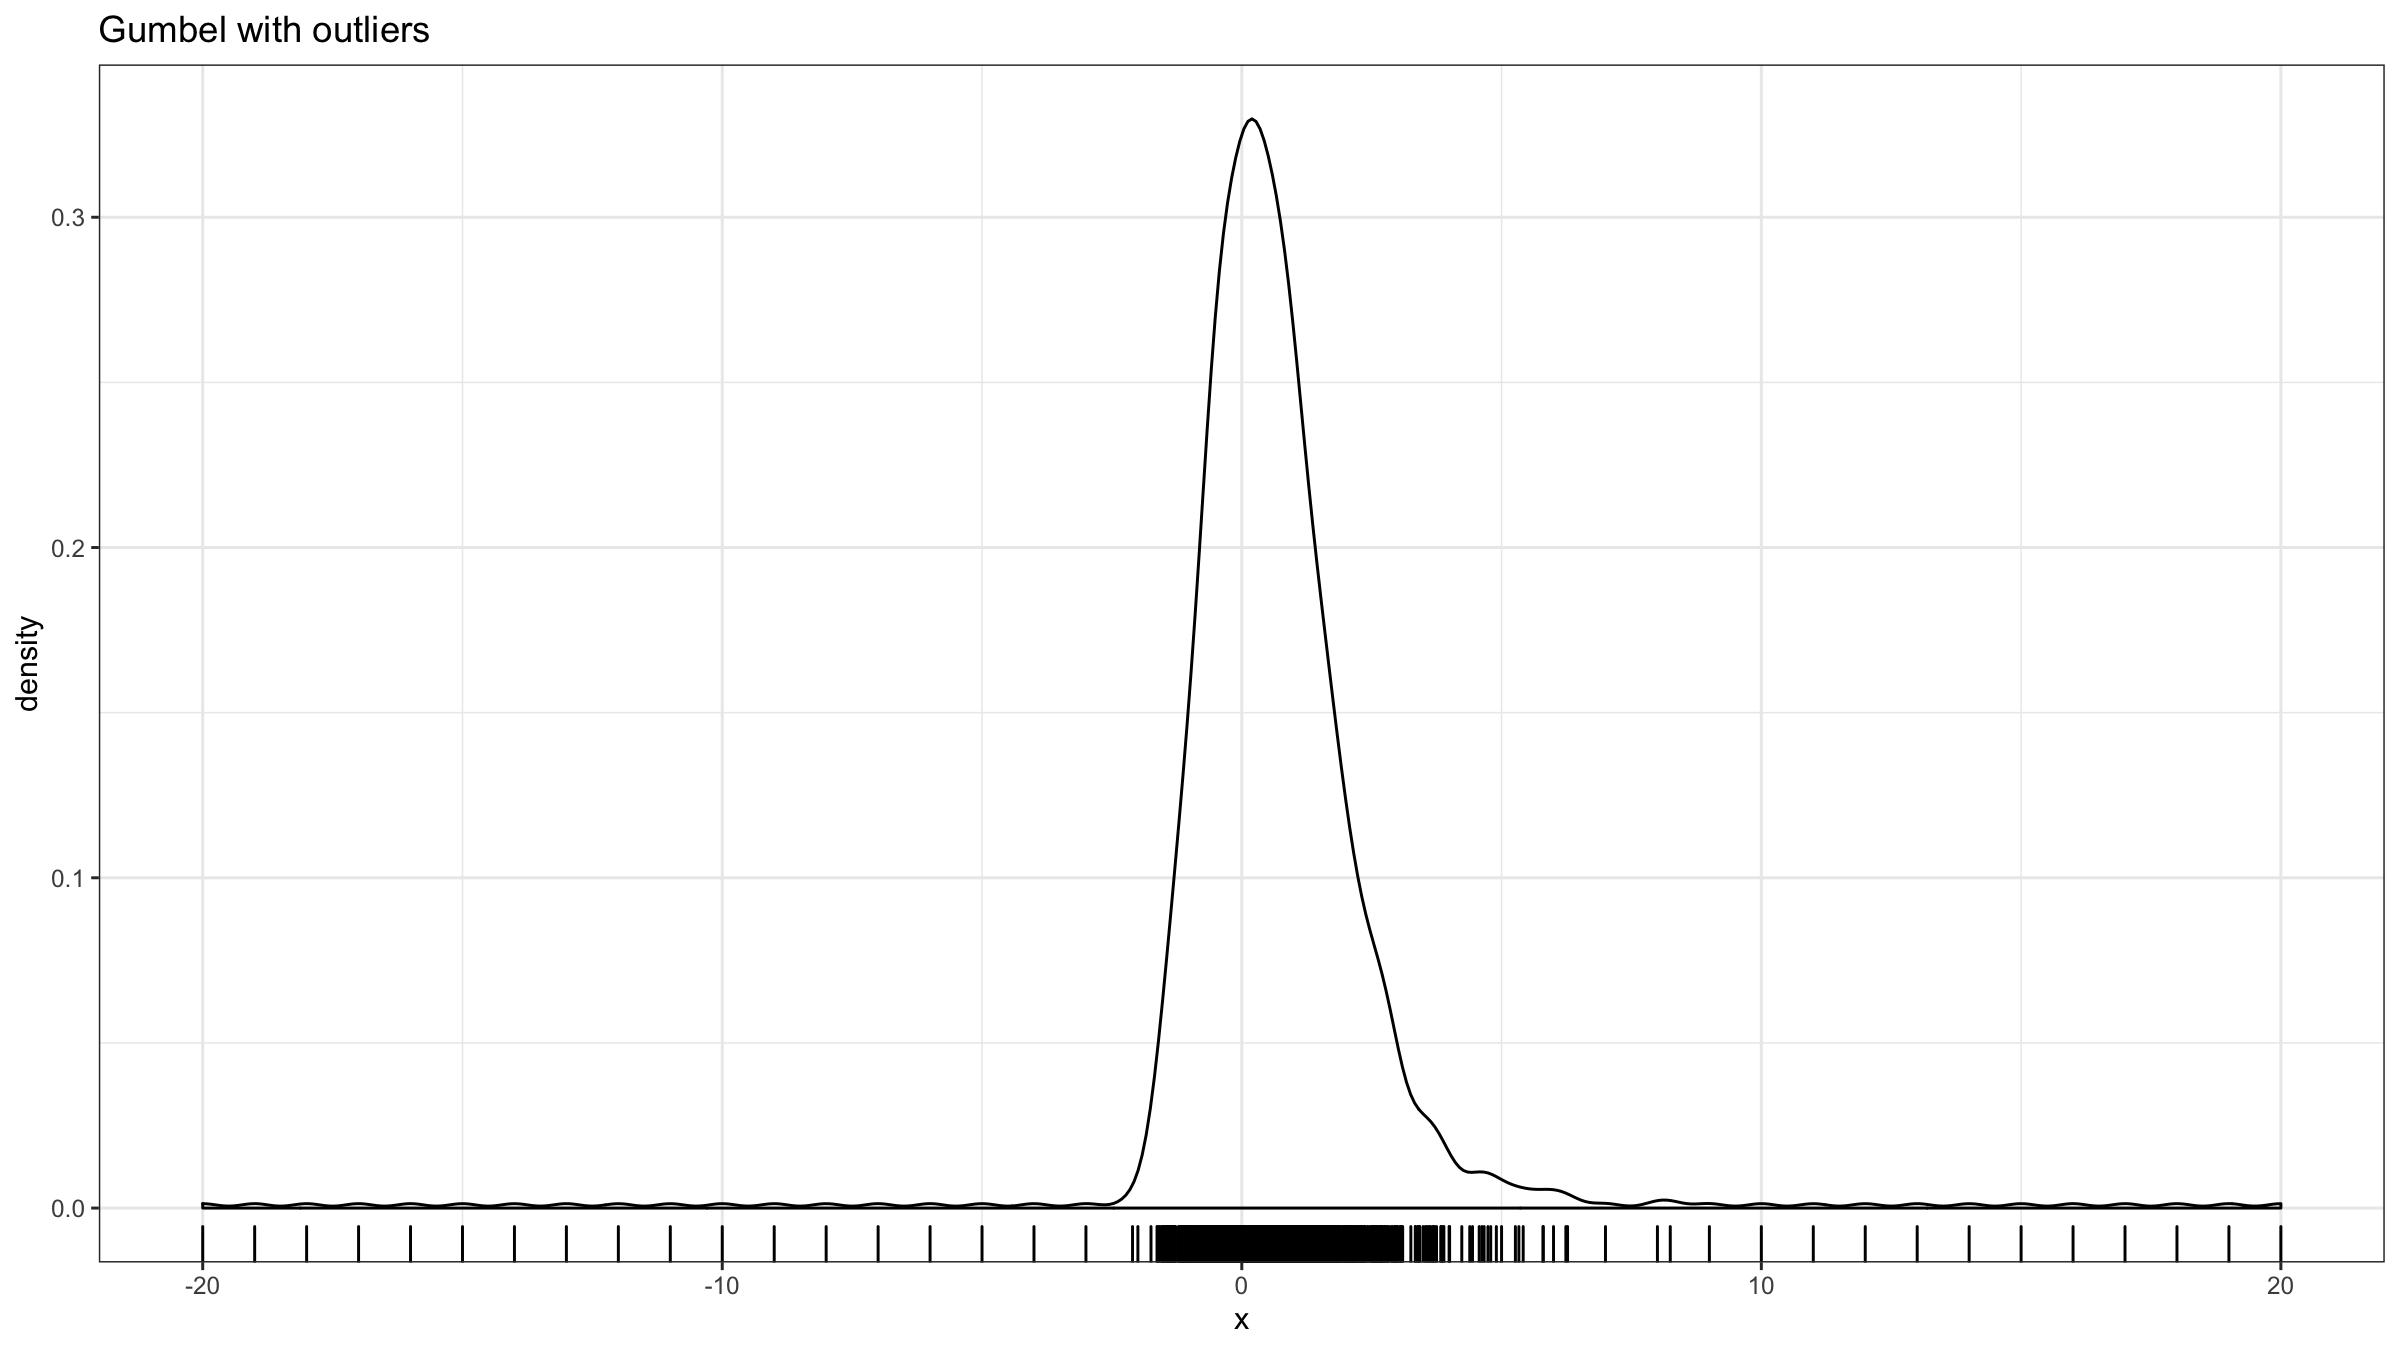
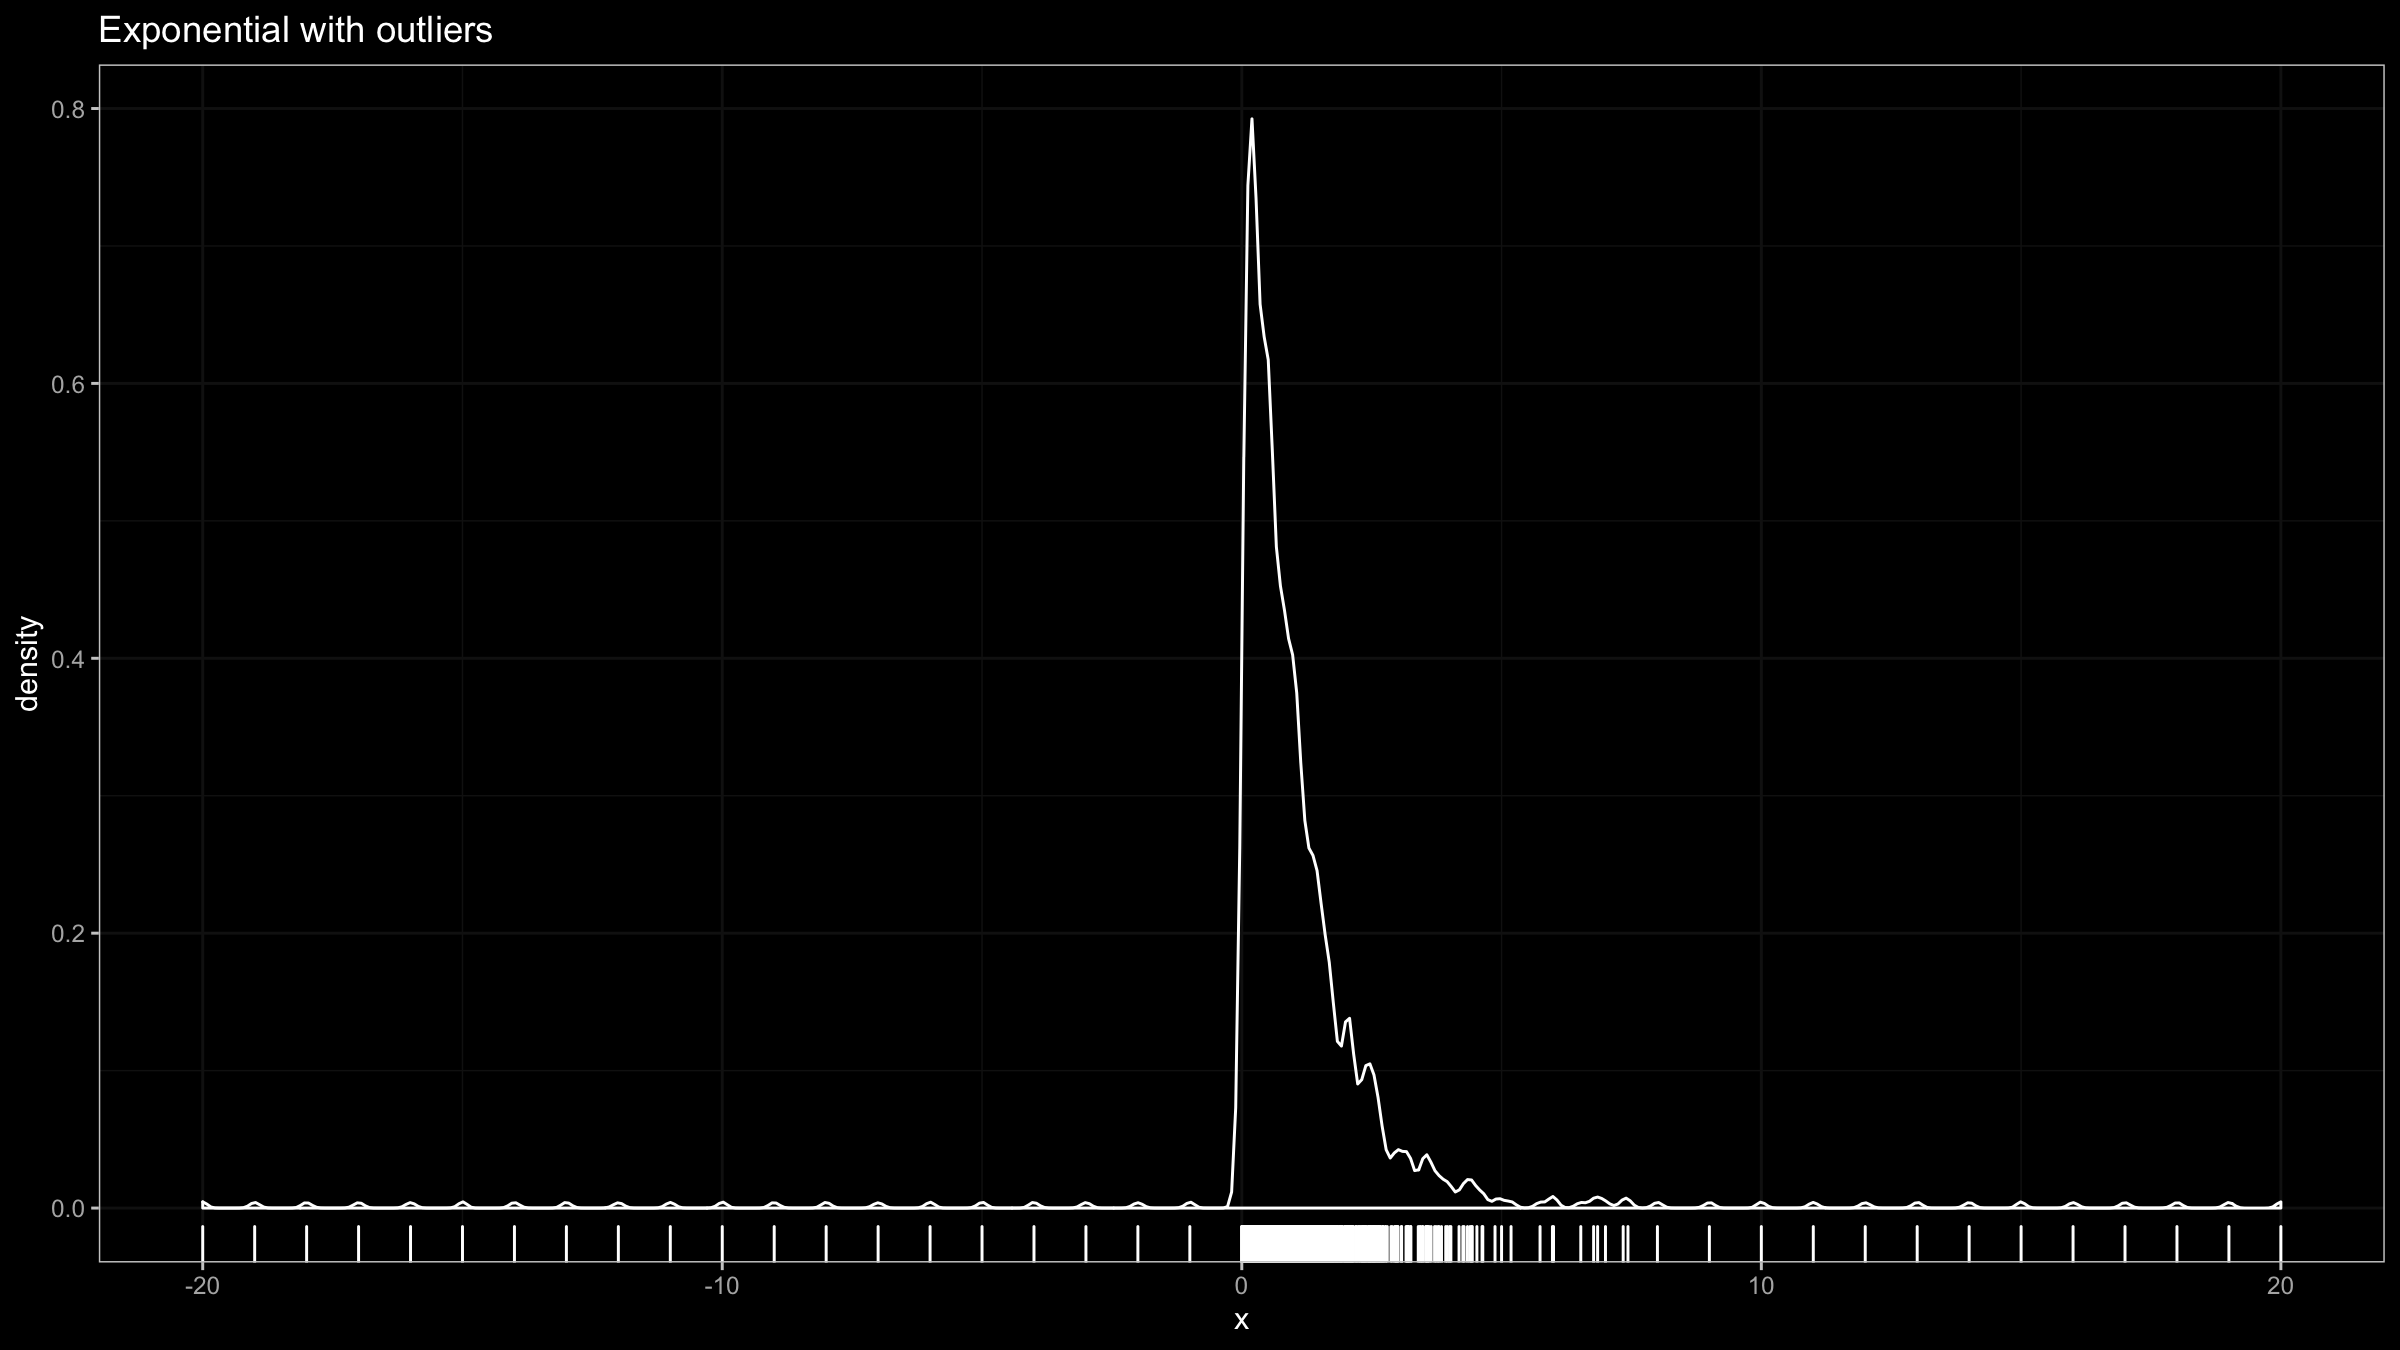
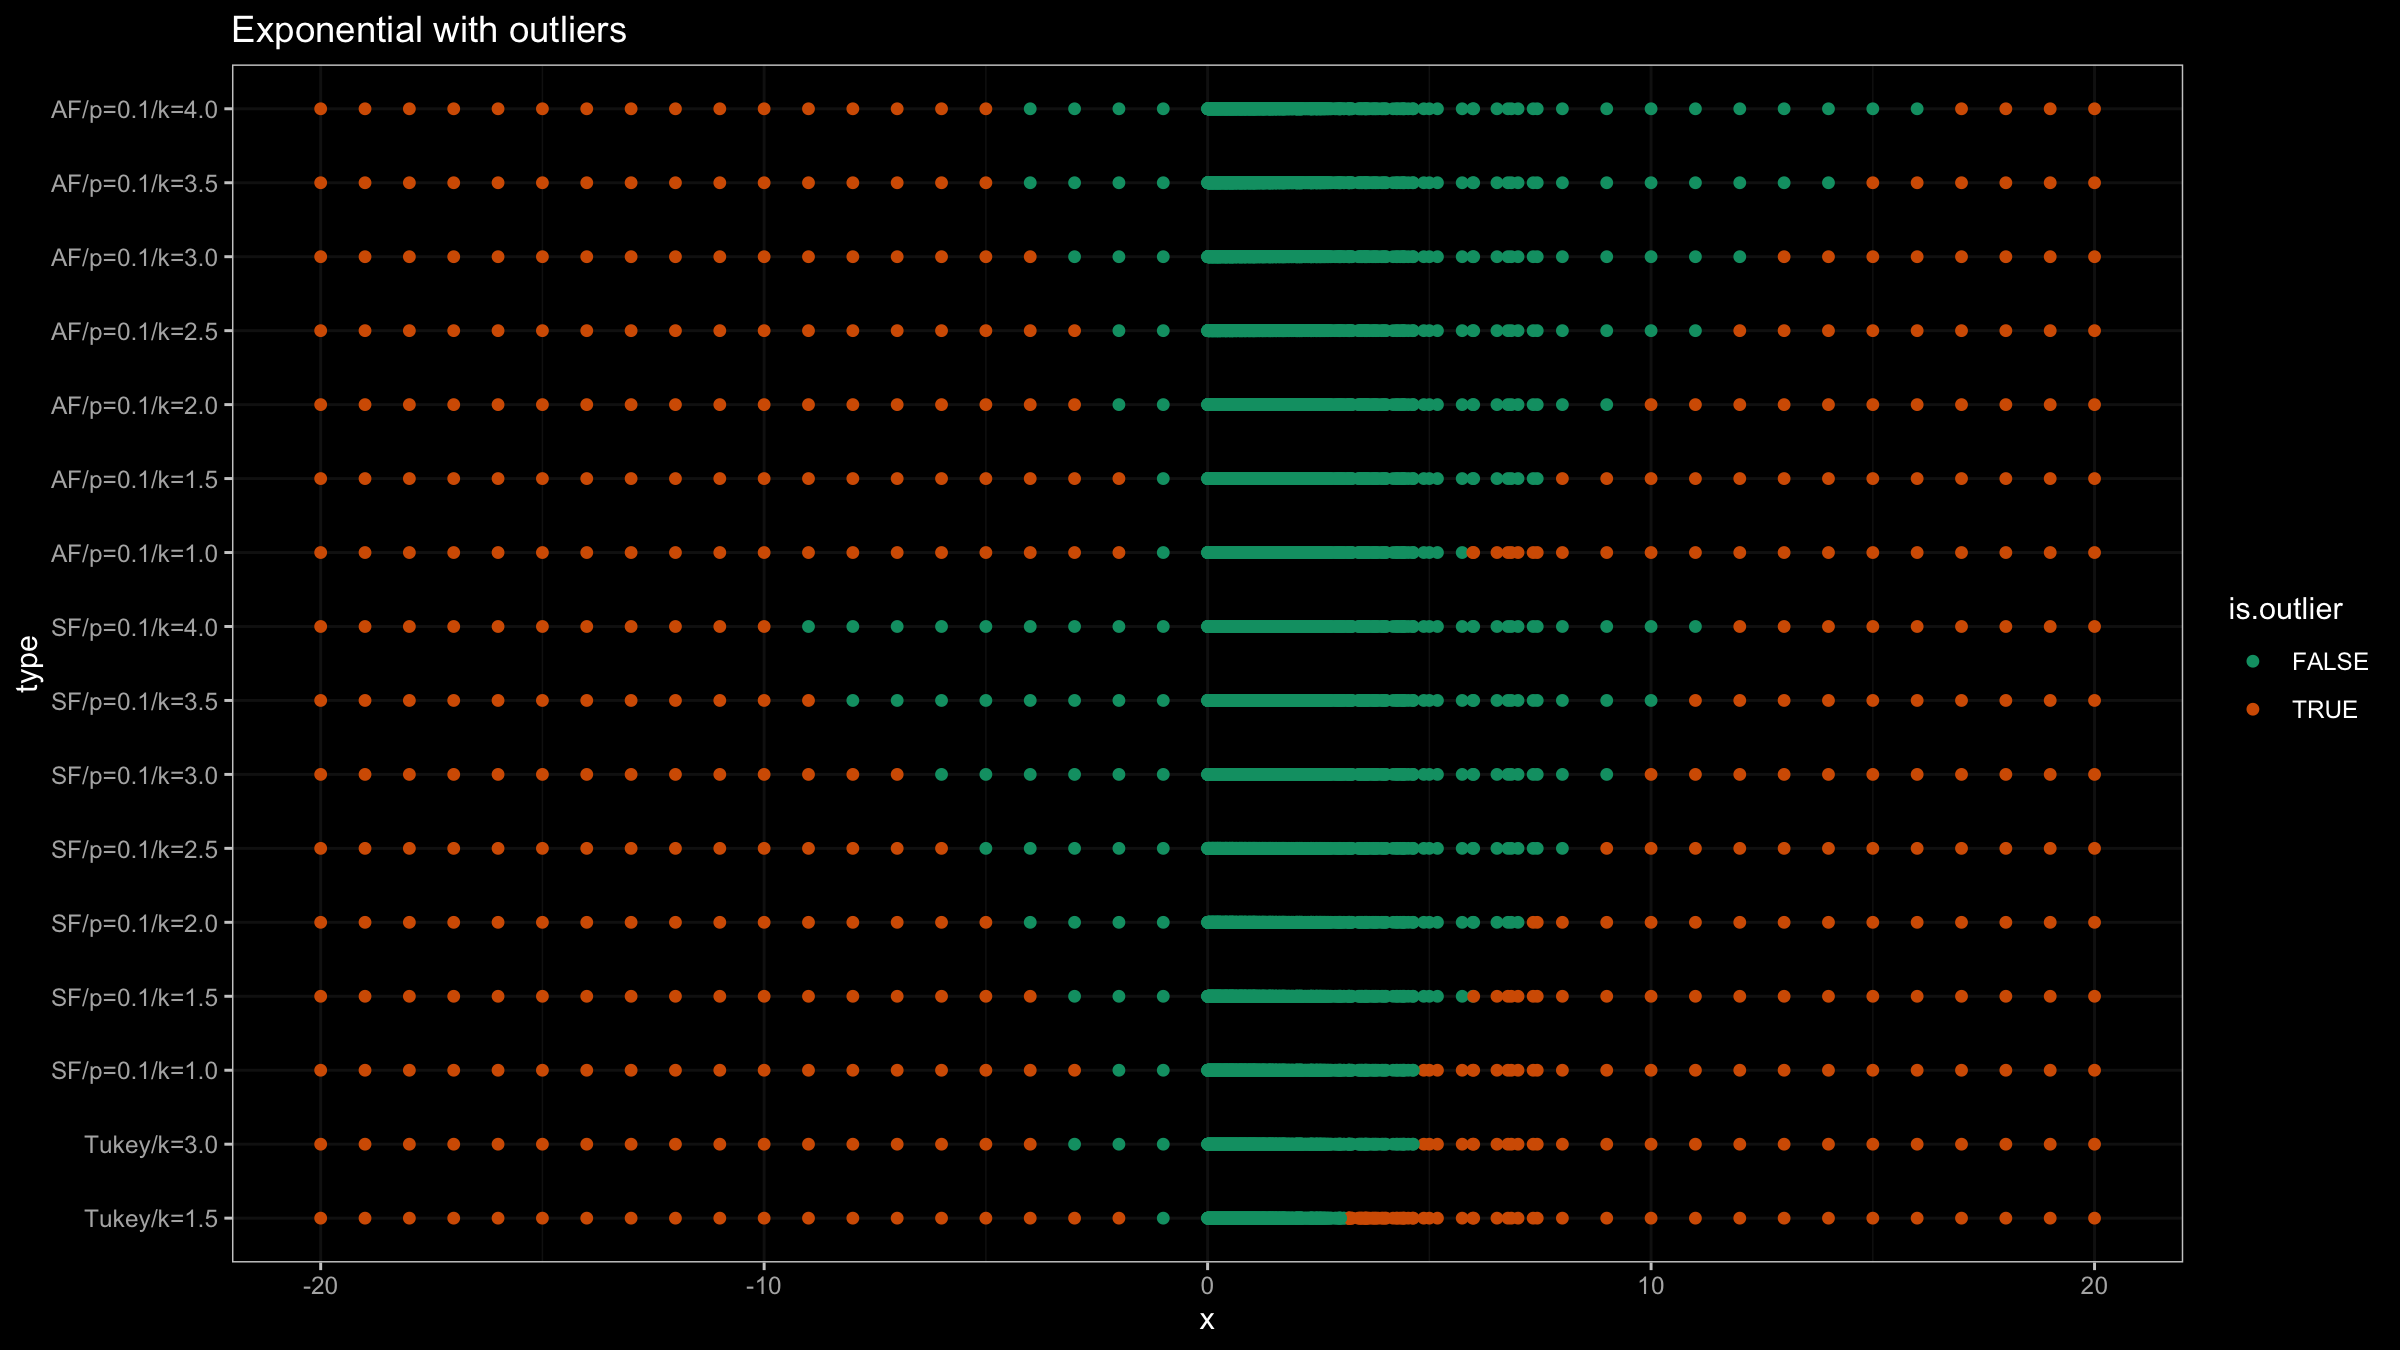
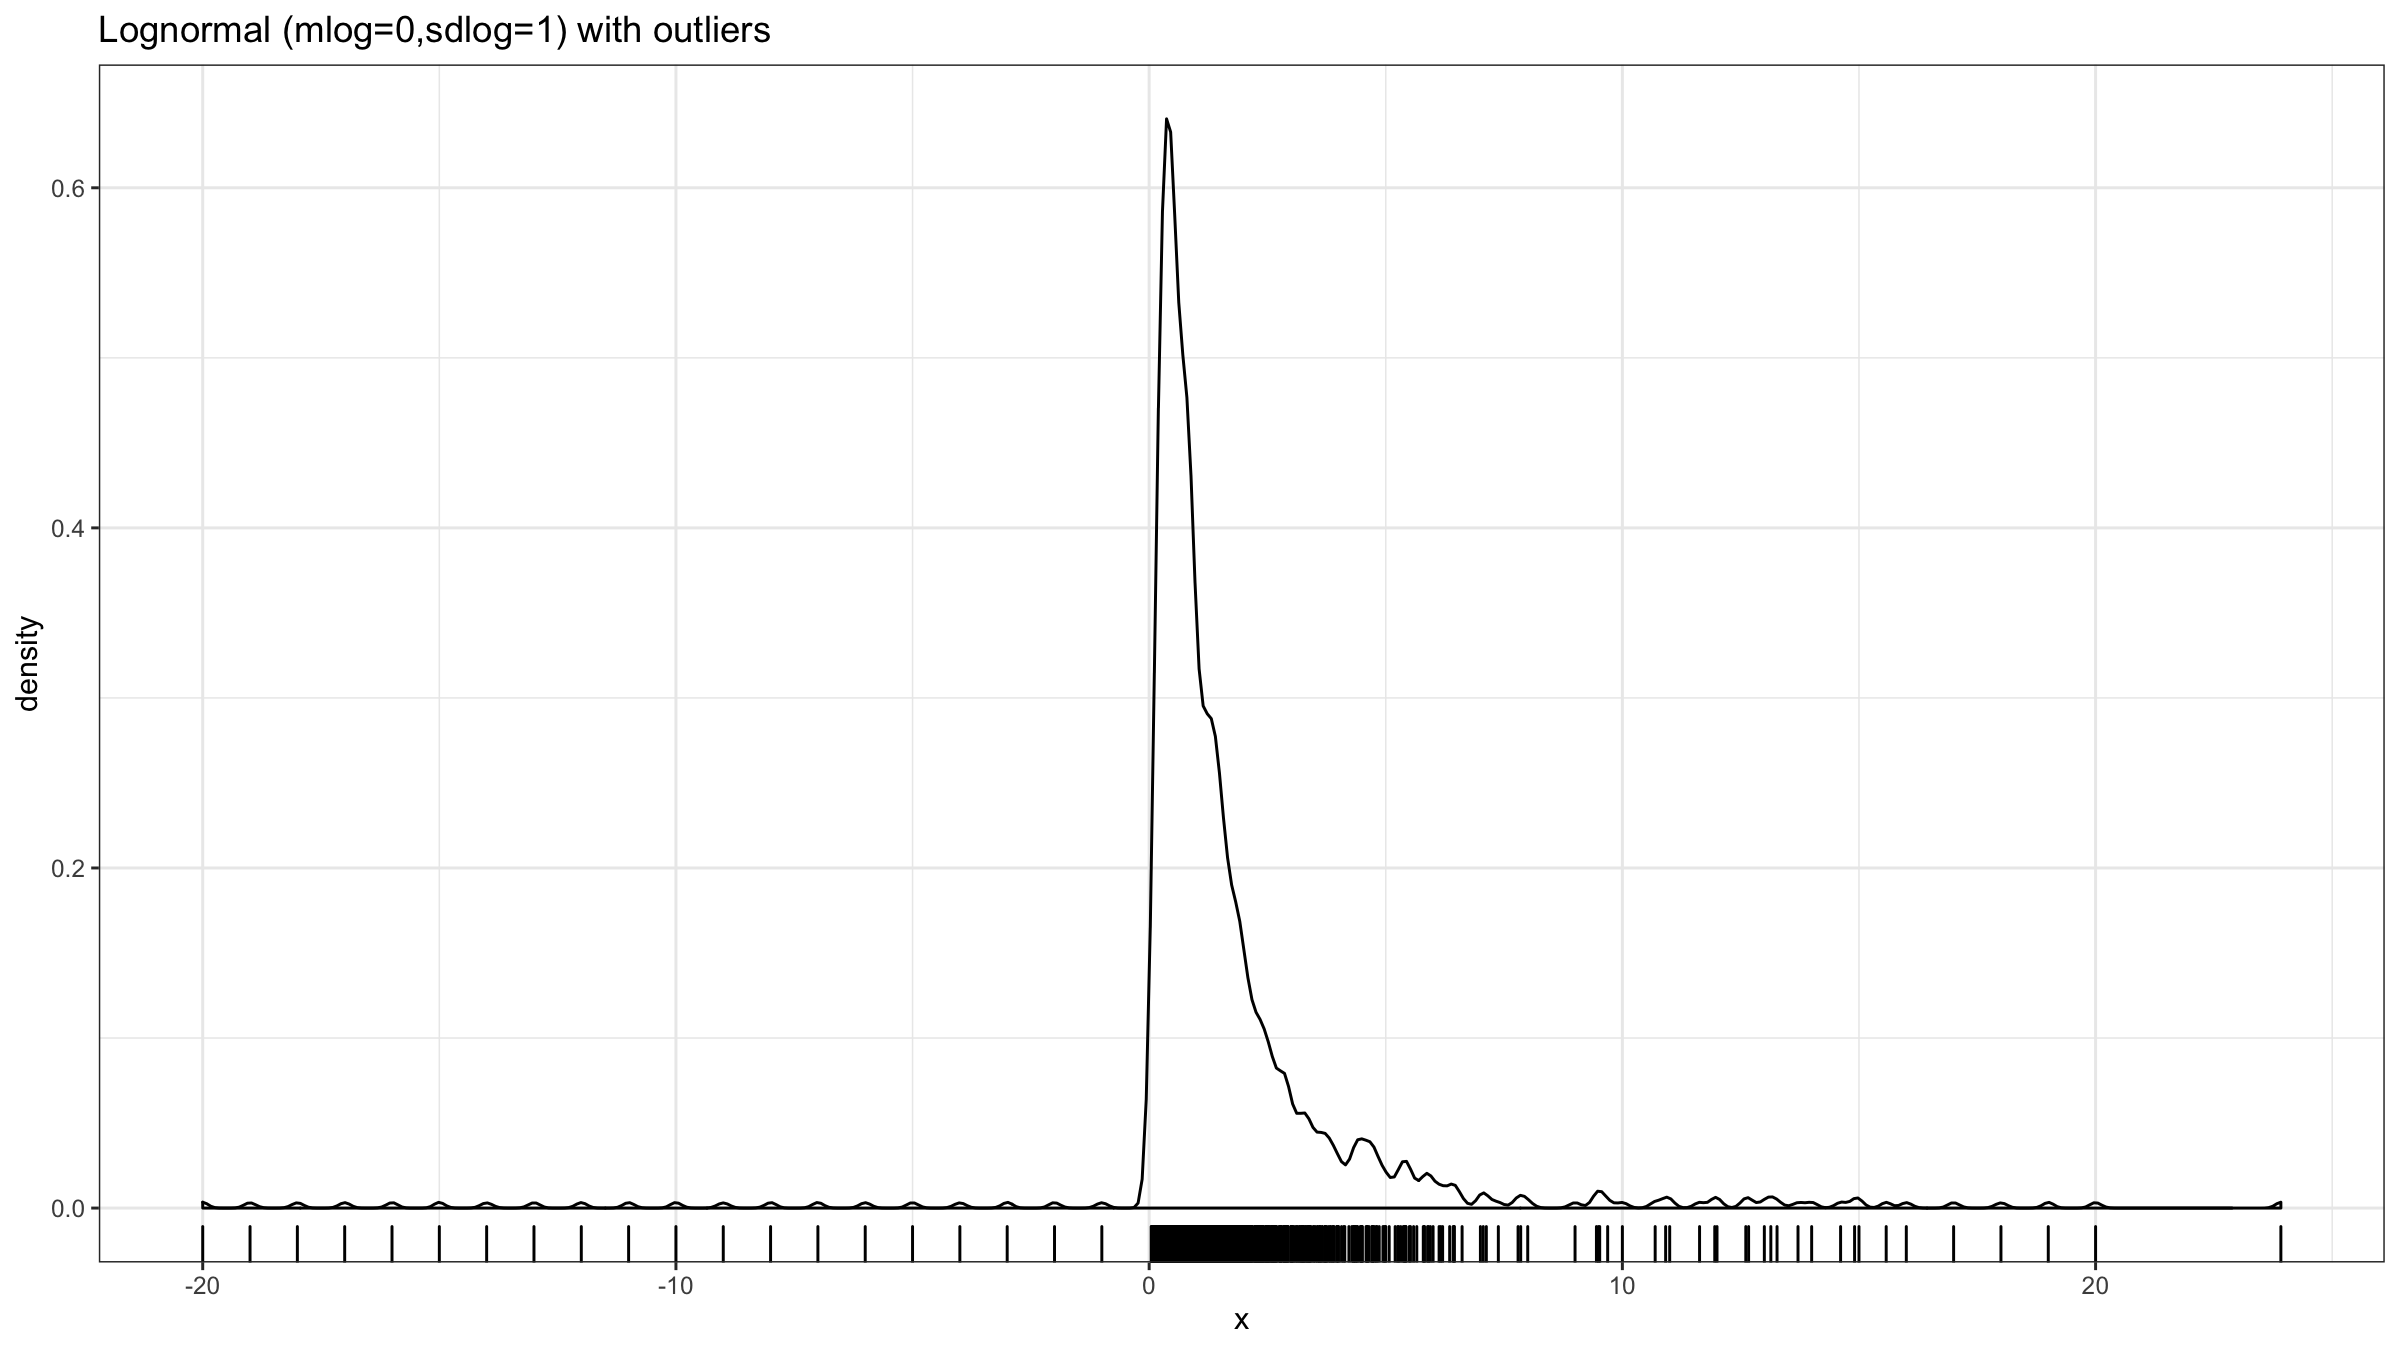
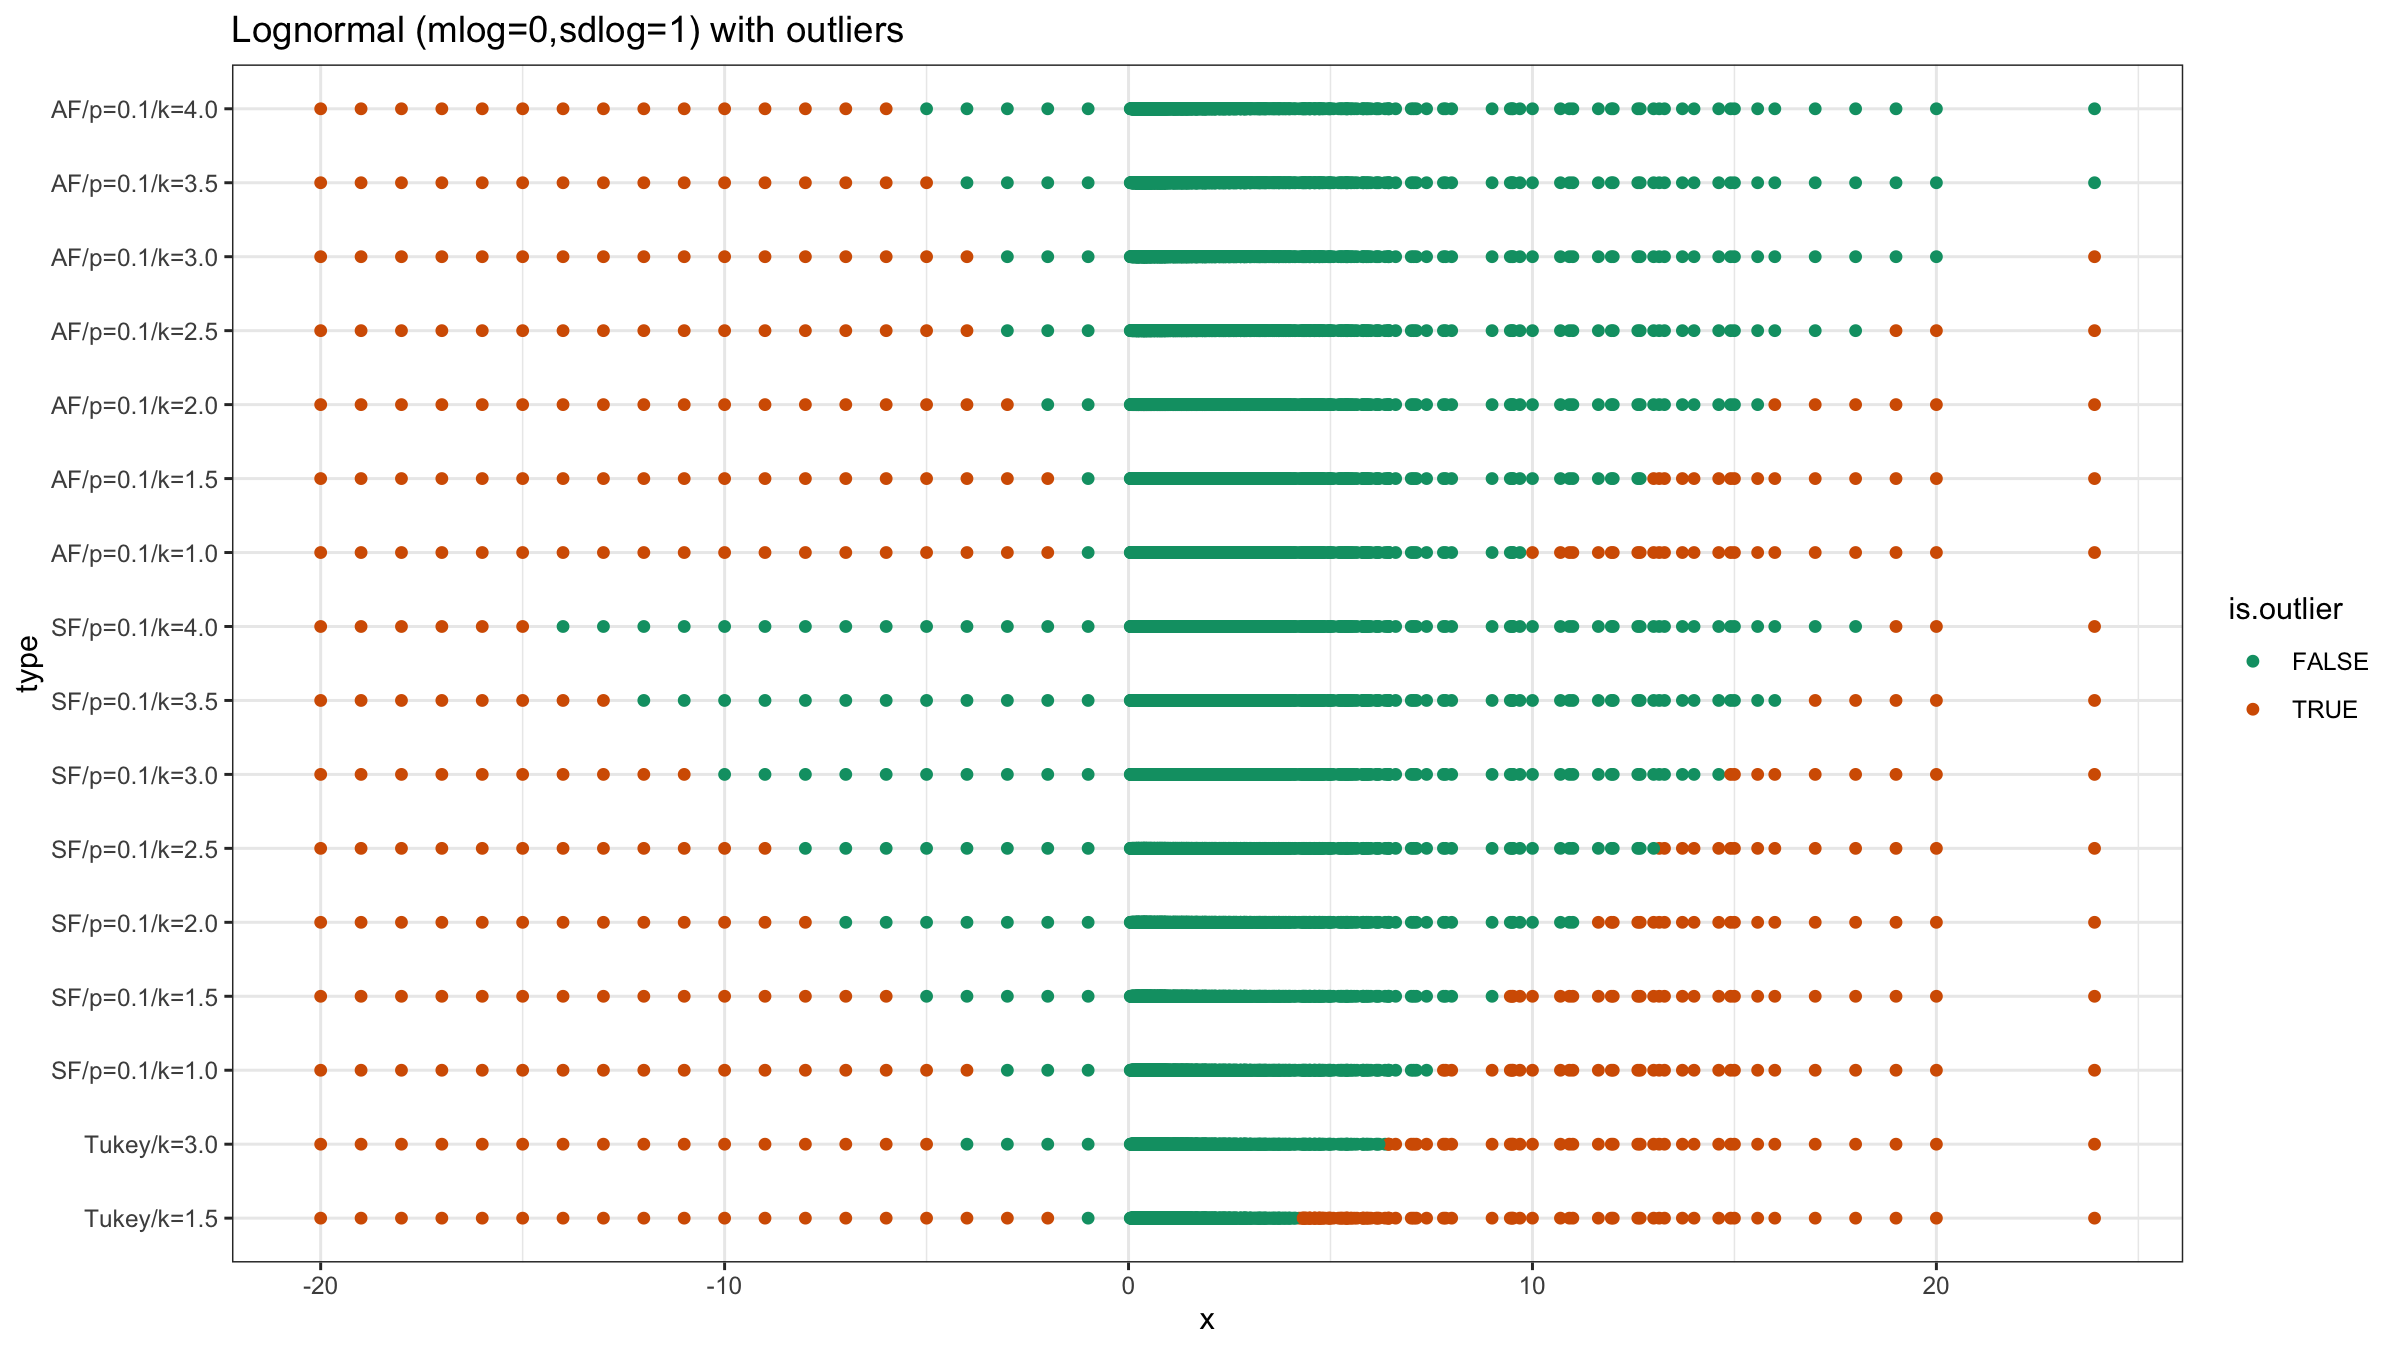
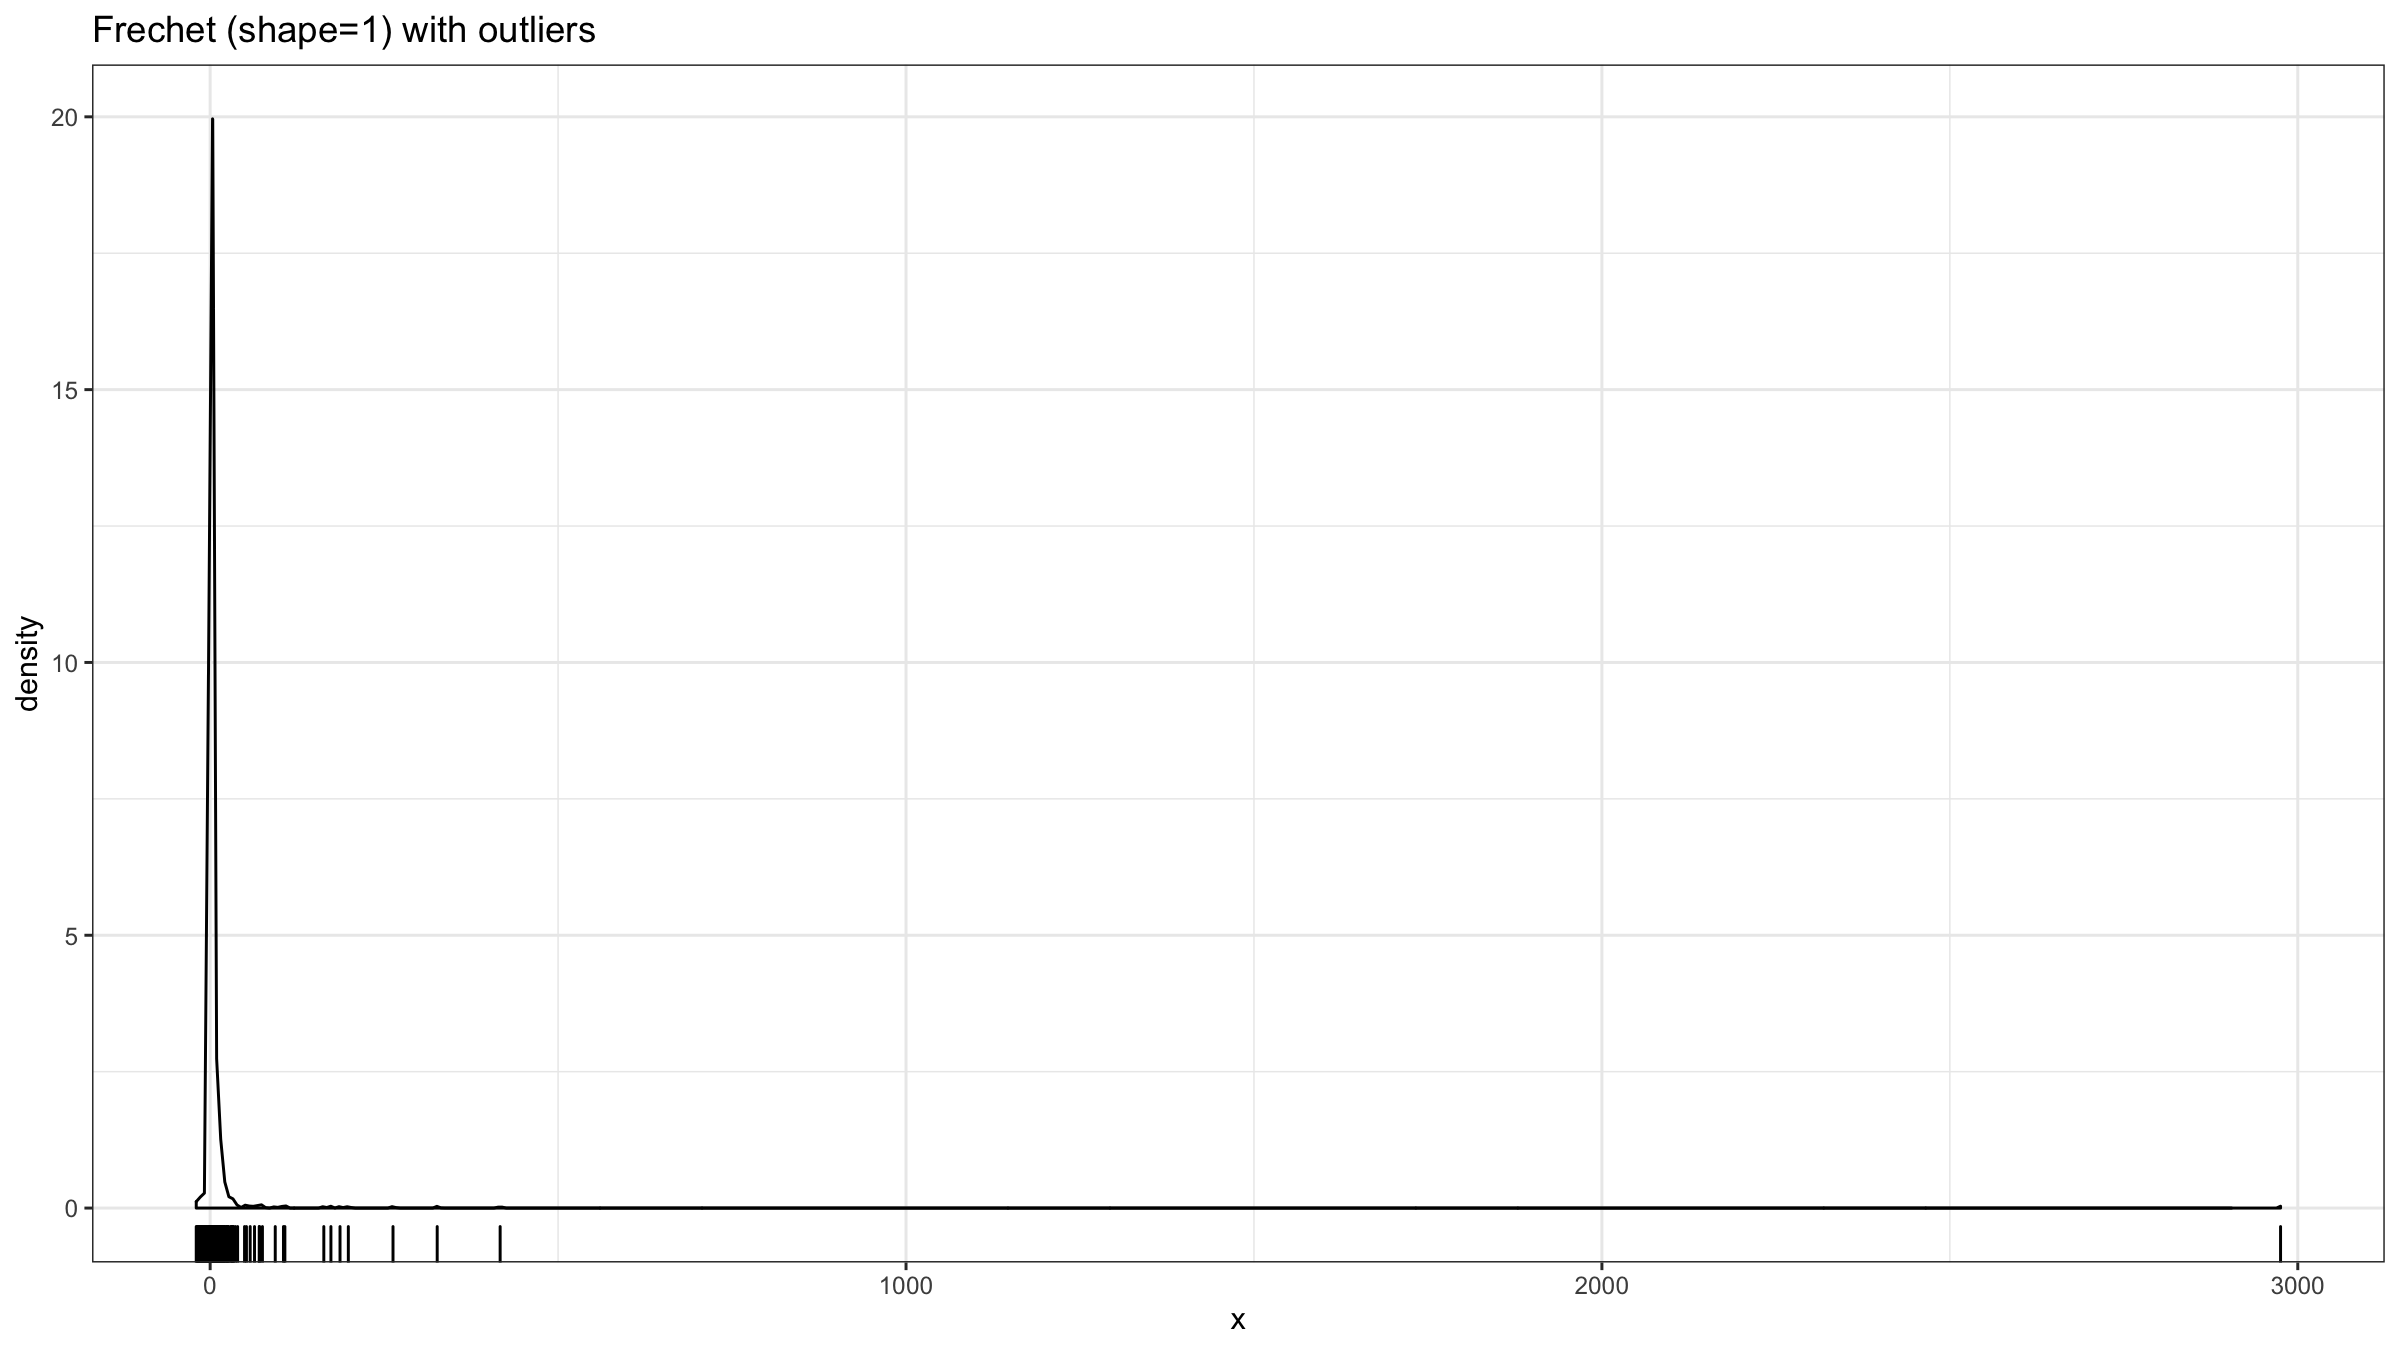
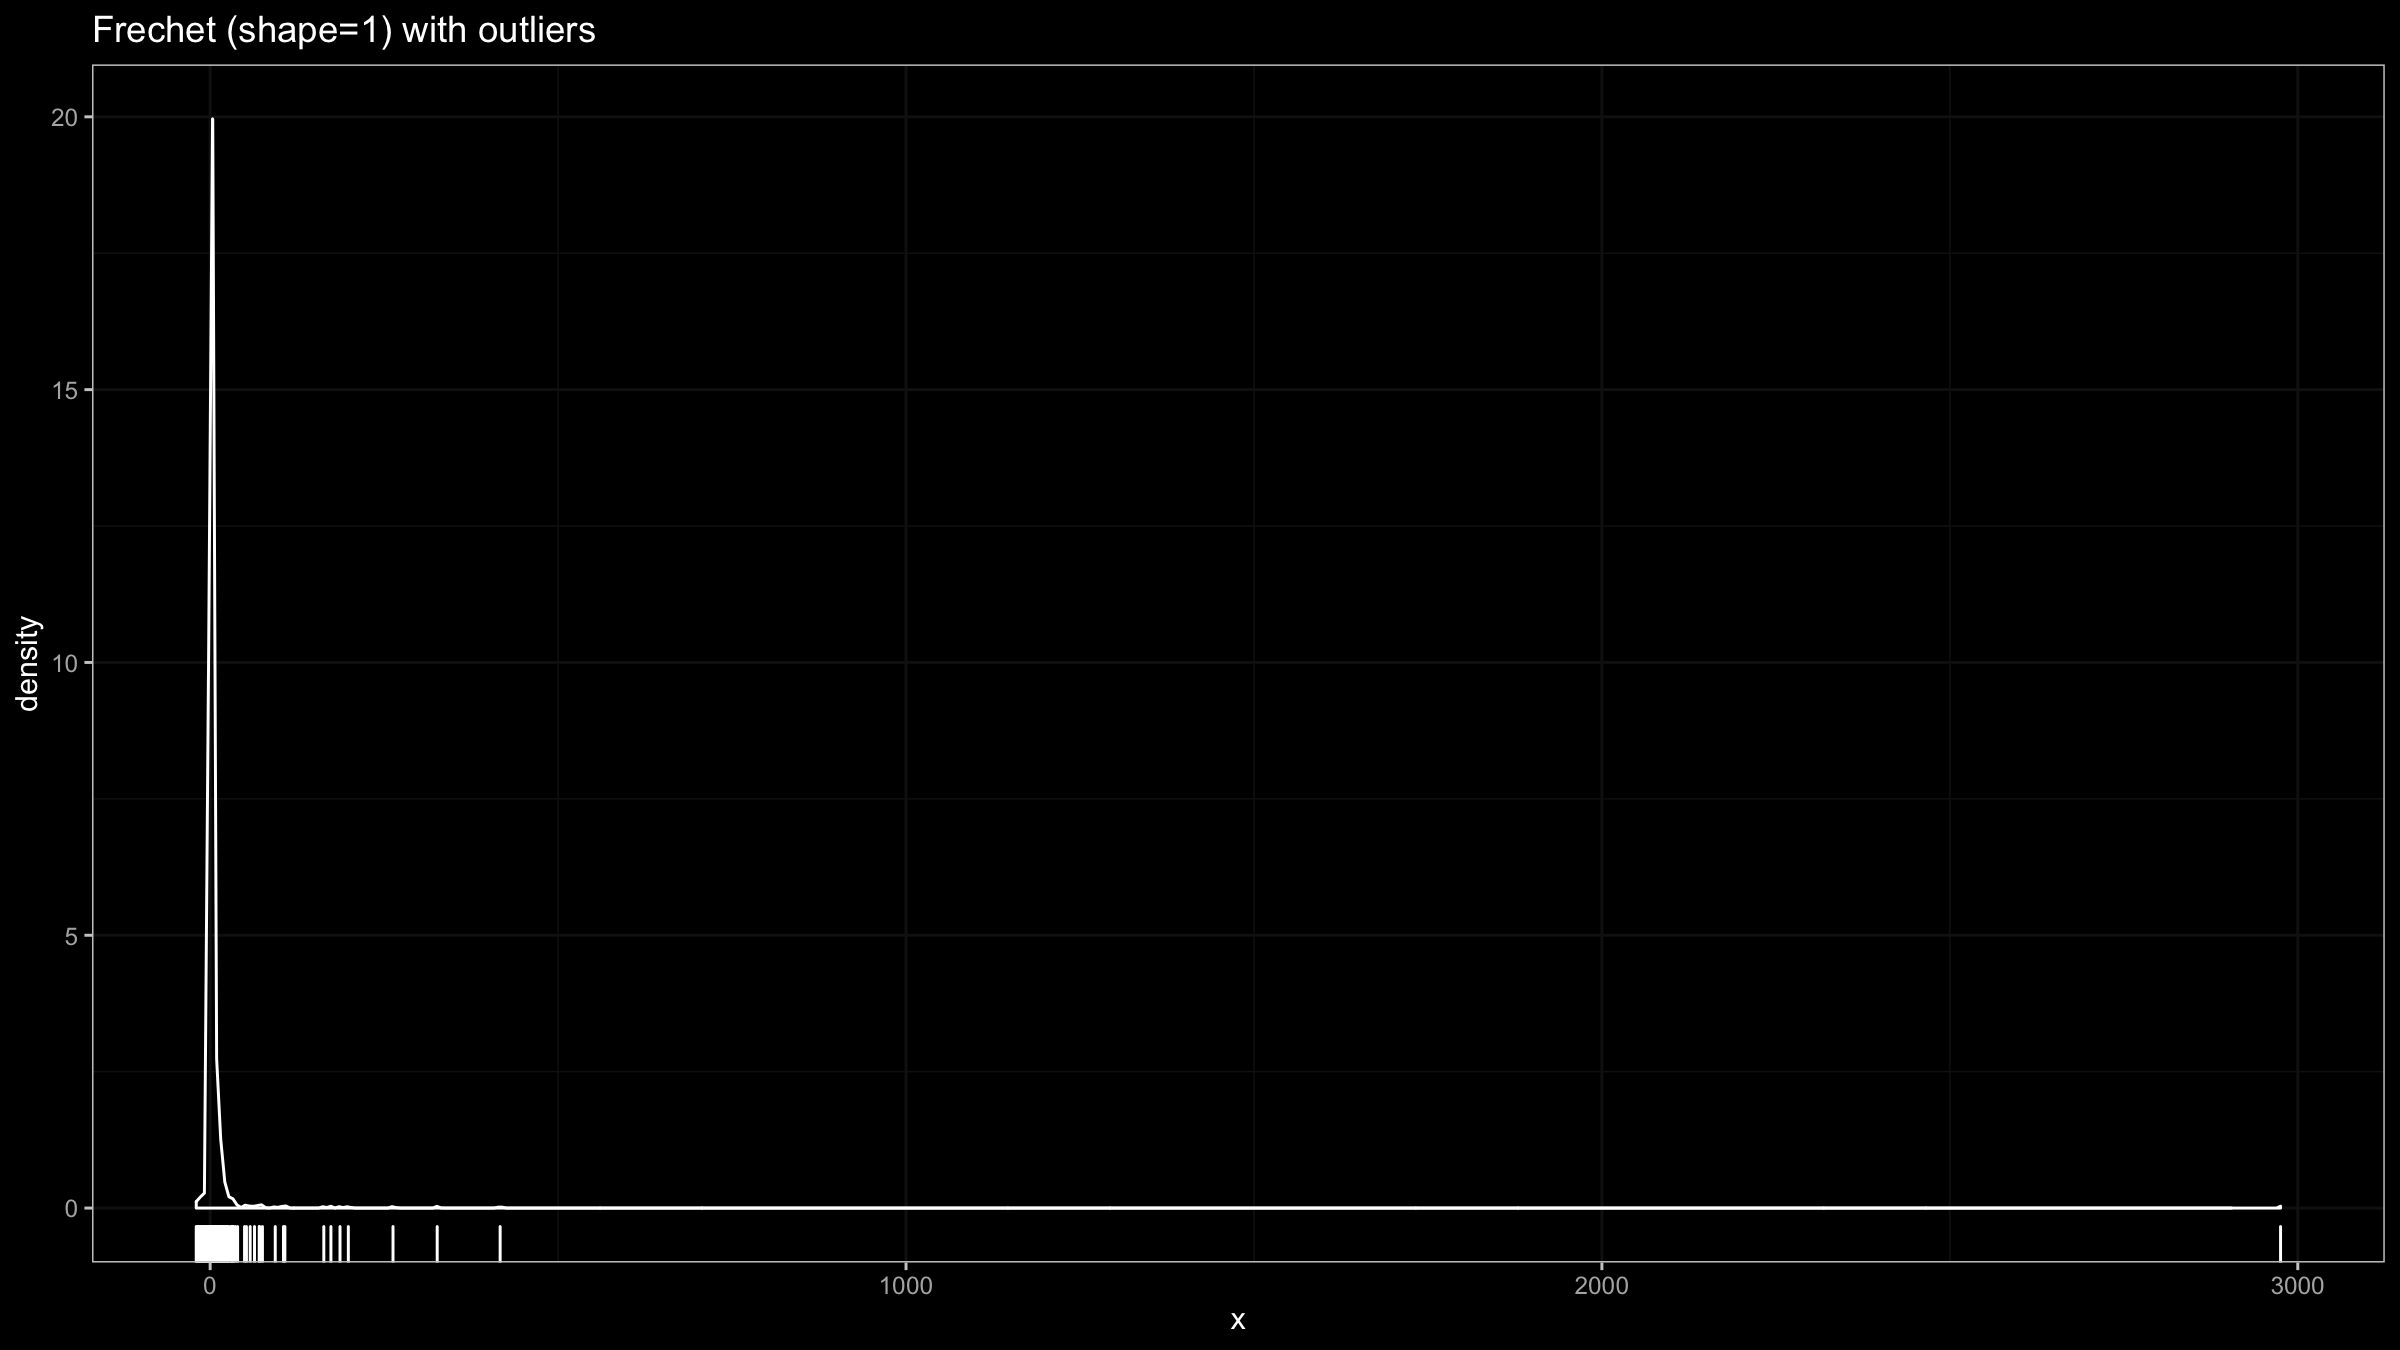
- For each distribution, we generate a random sample of size $N=1000$. Next, we add elements $\{ -20, -19, \ldots, -2, -1, 1, 2, \ldots, 19, 20 \}$ to this sample.
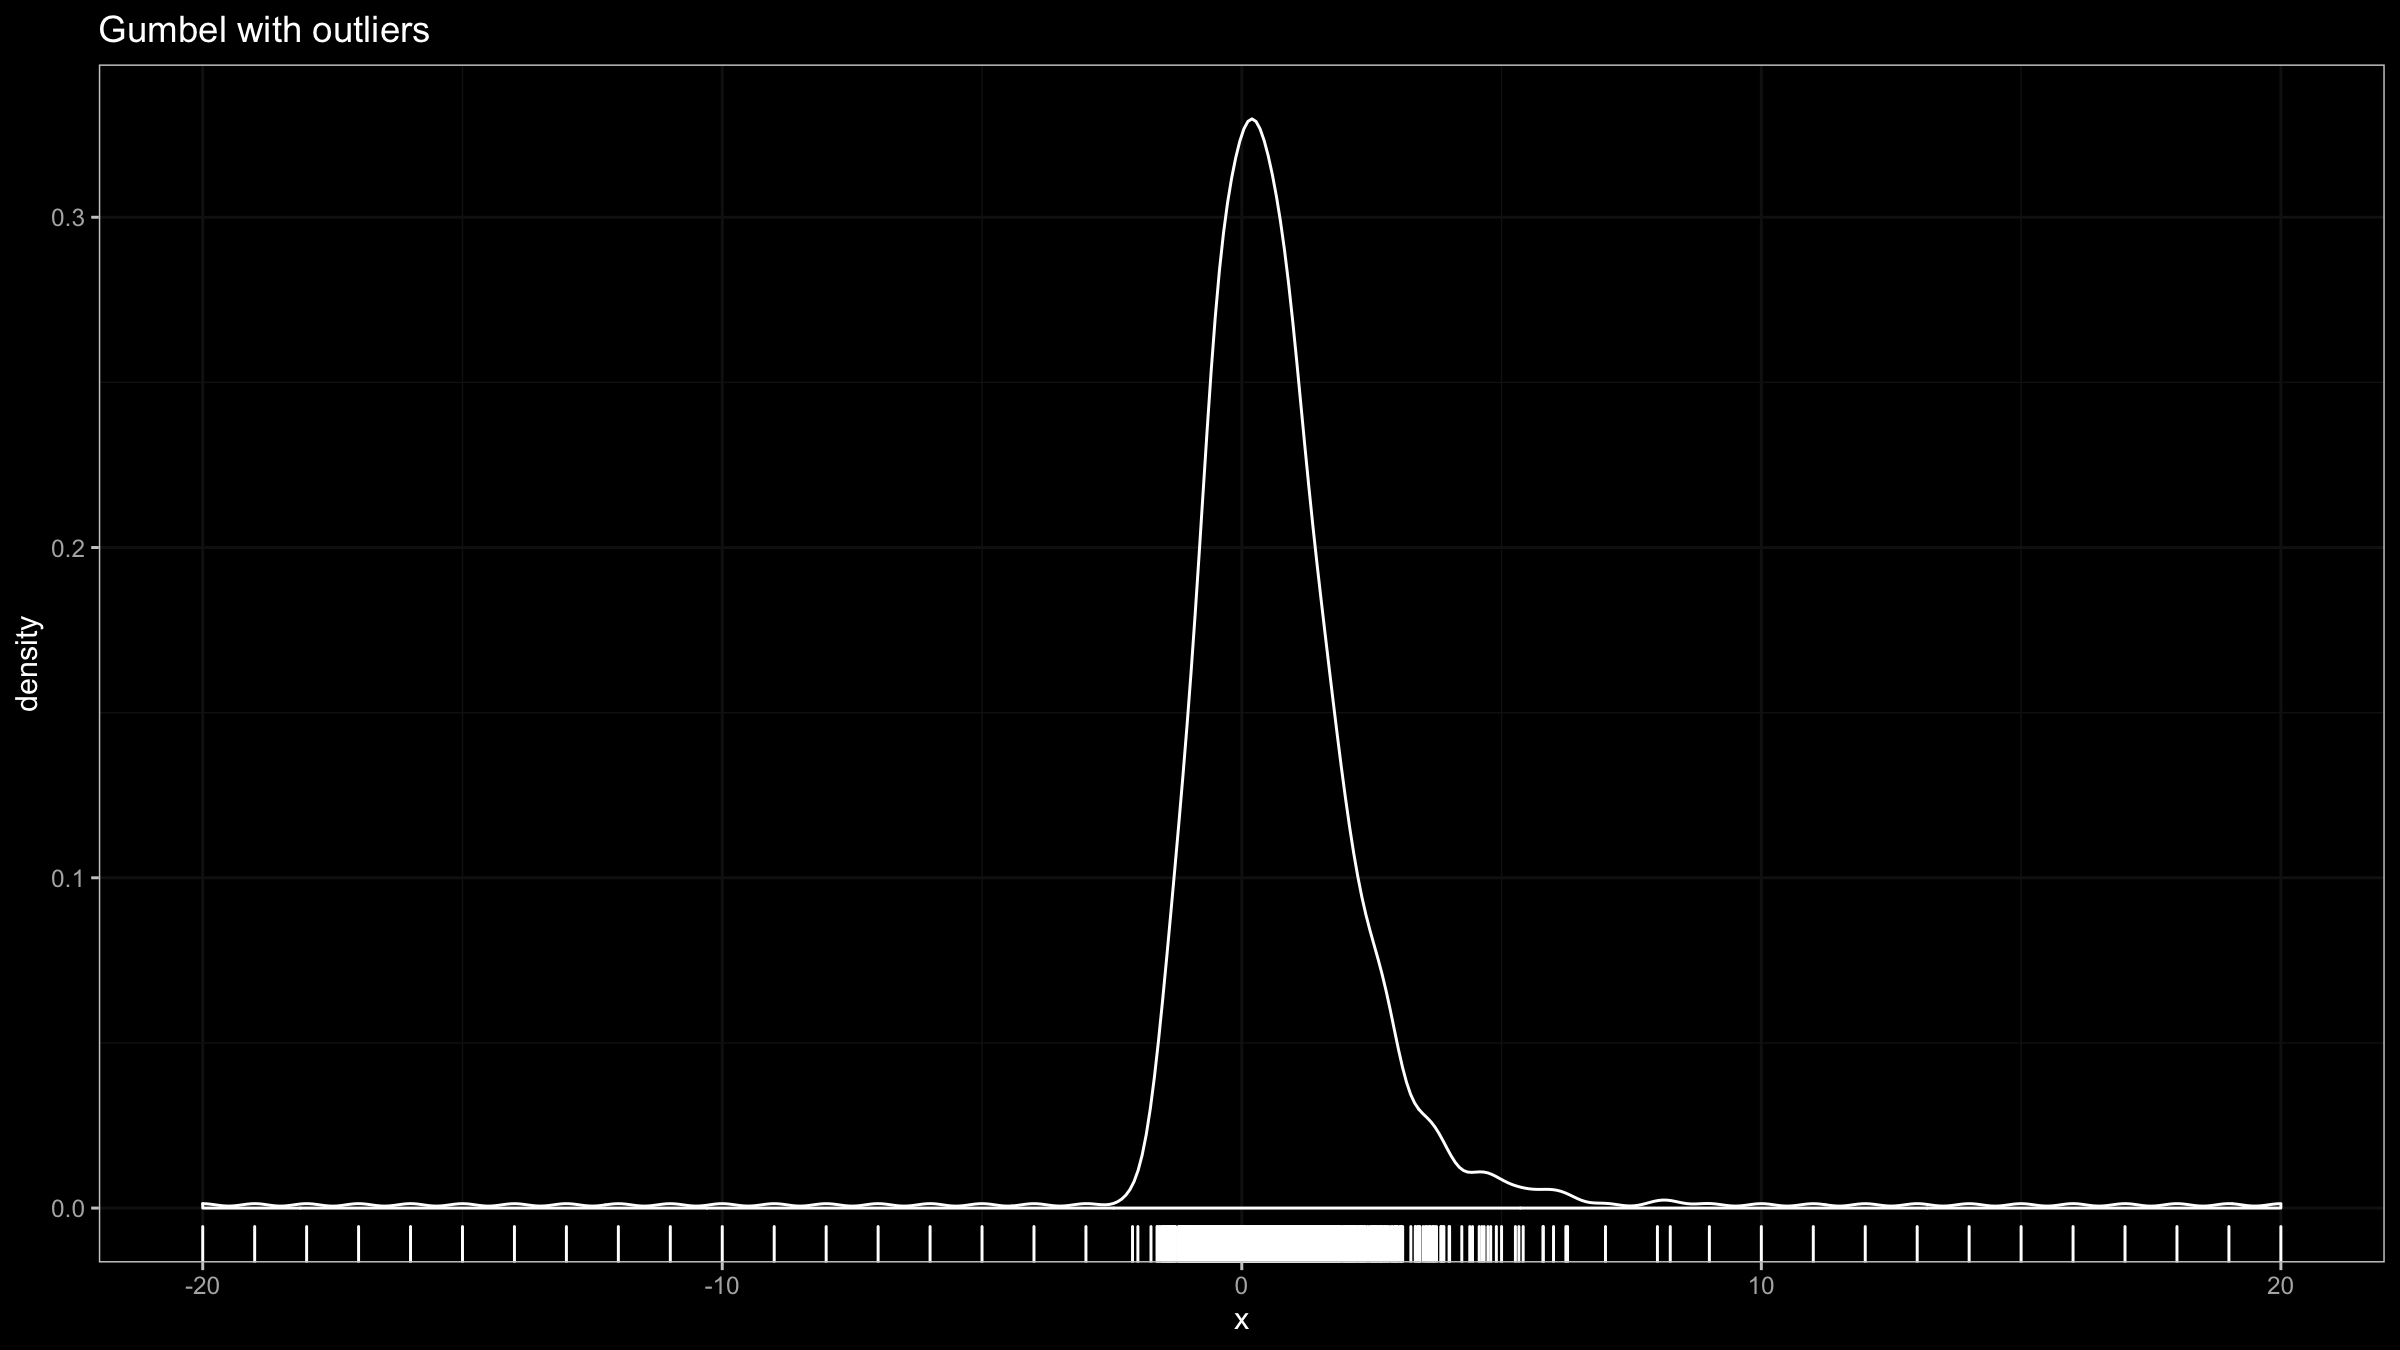
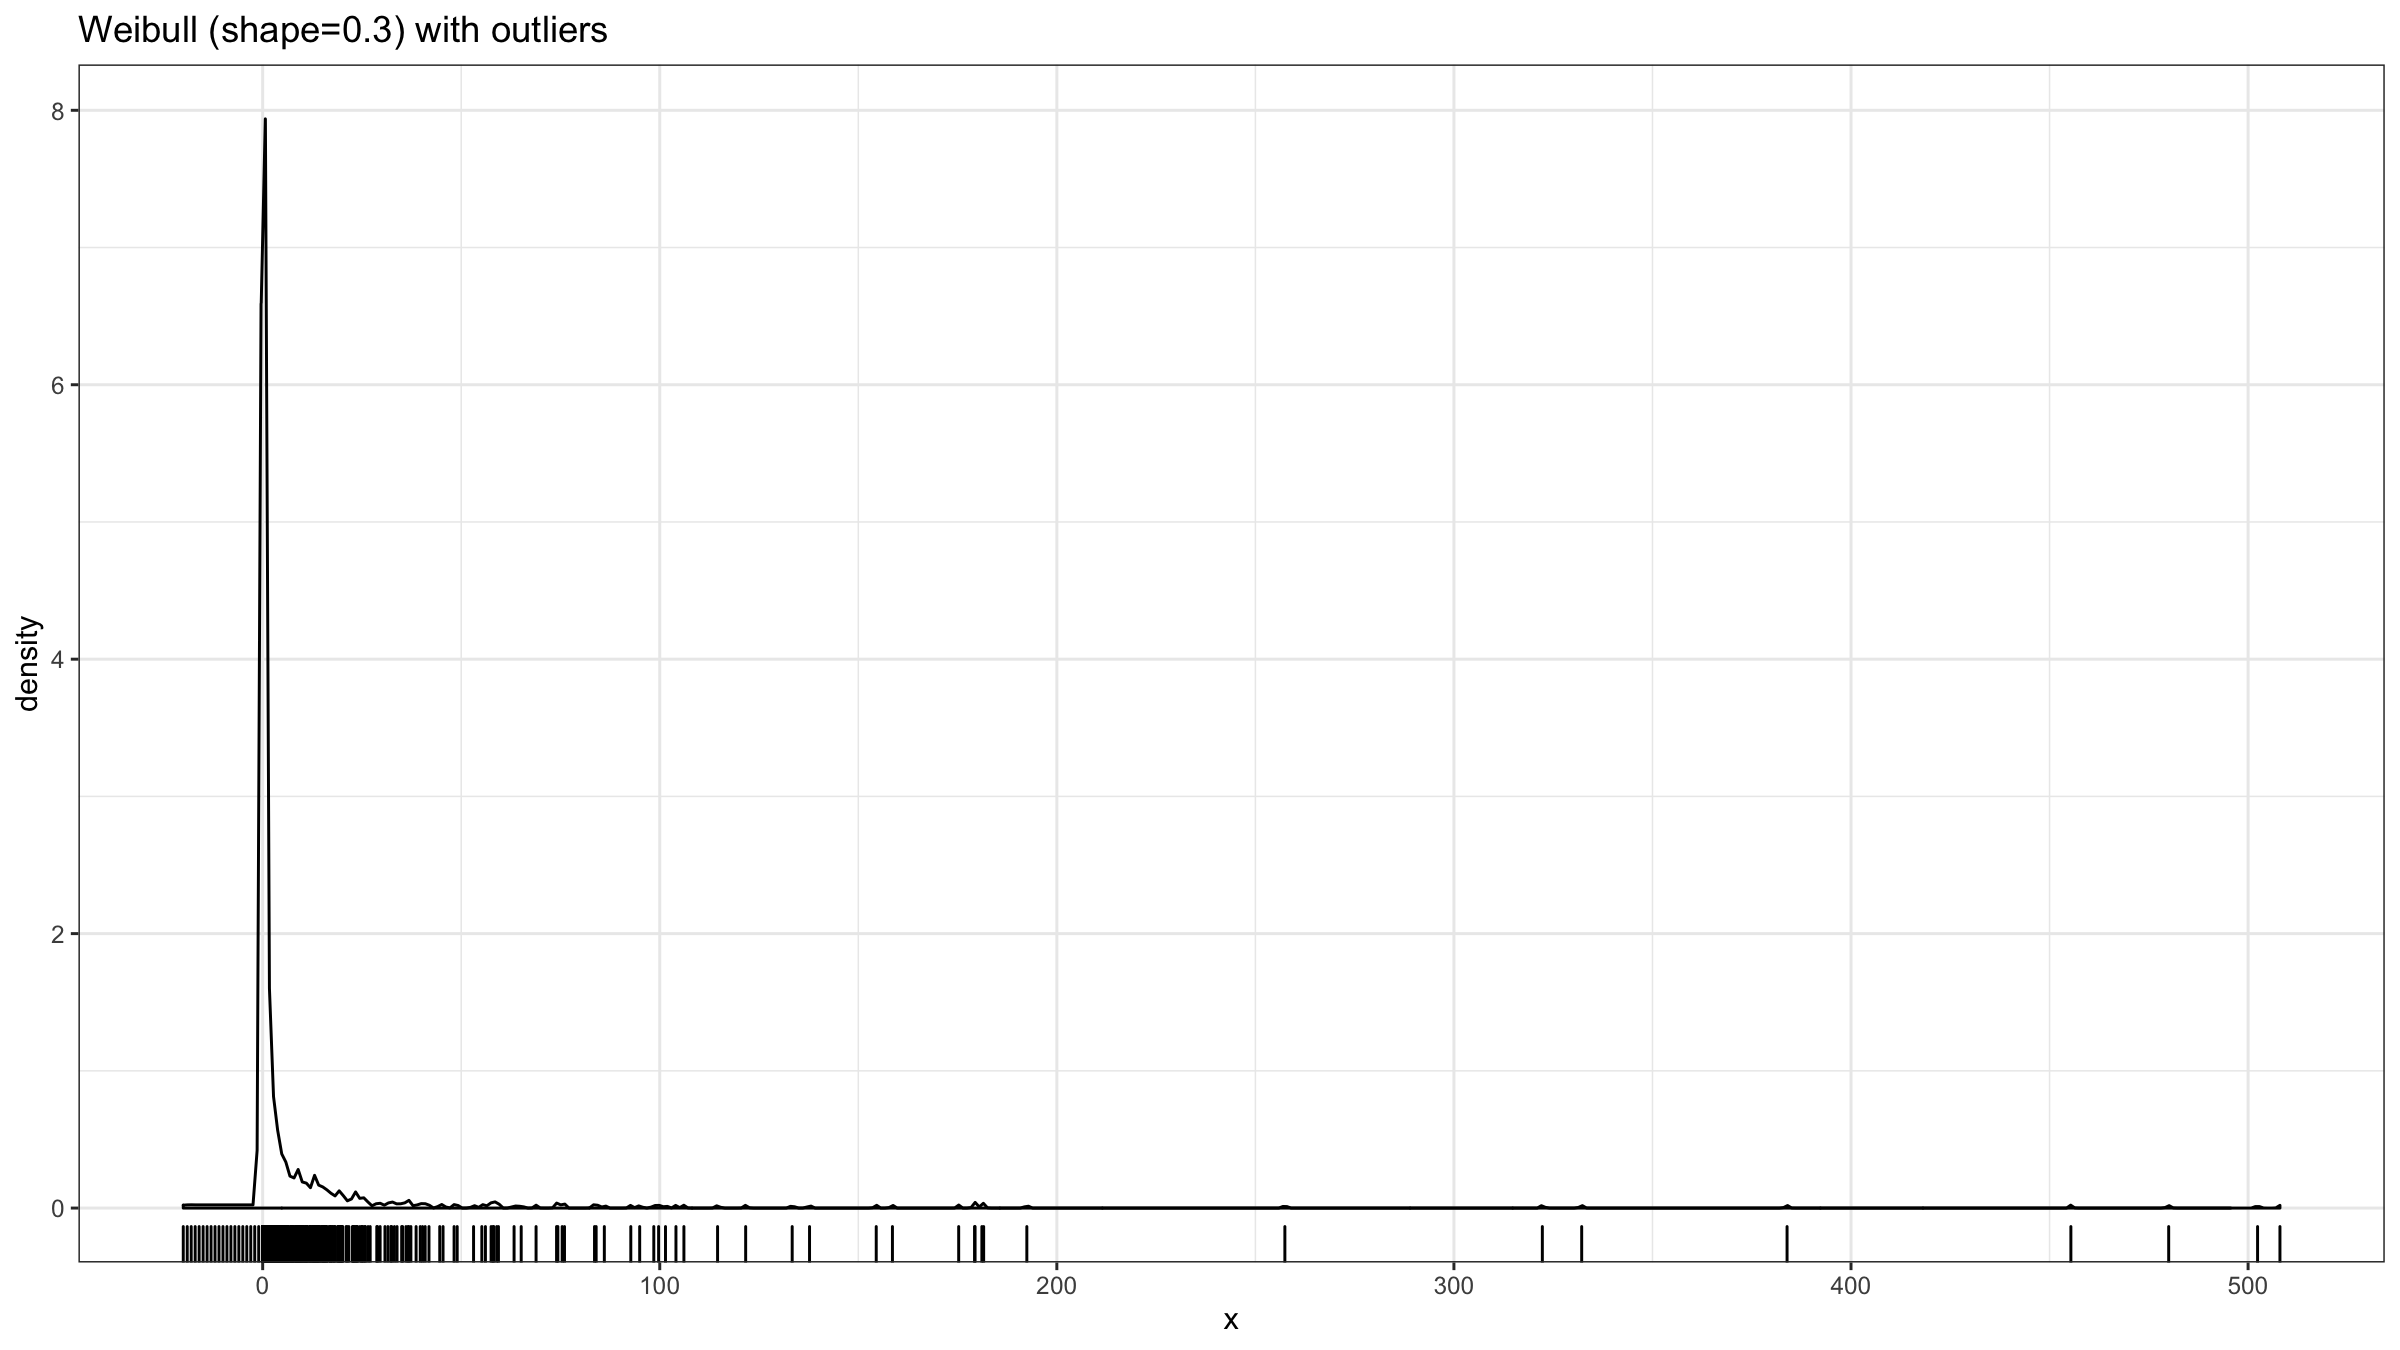
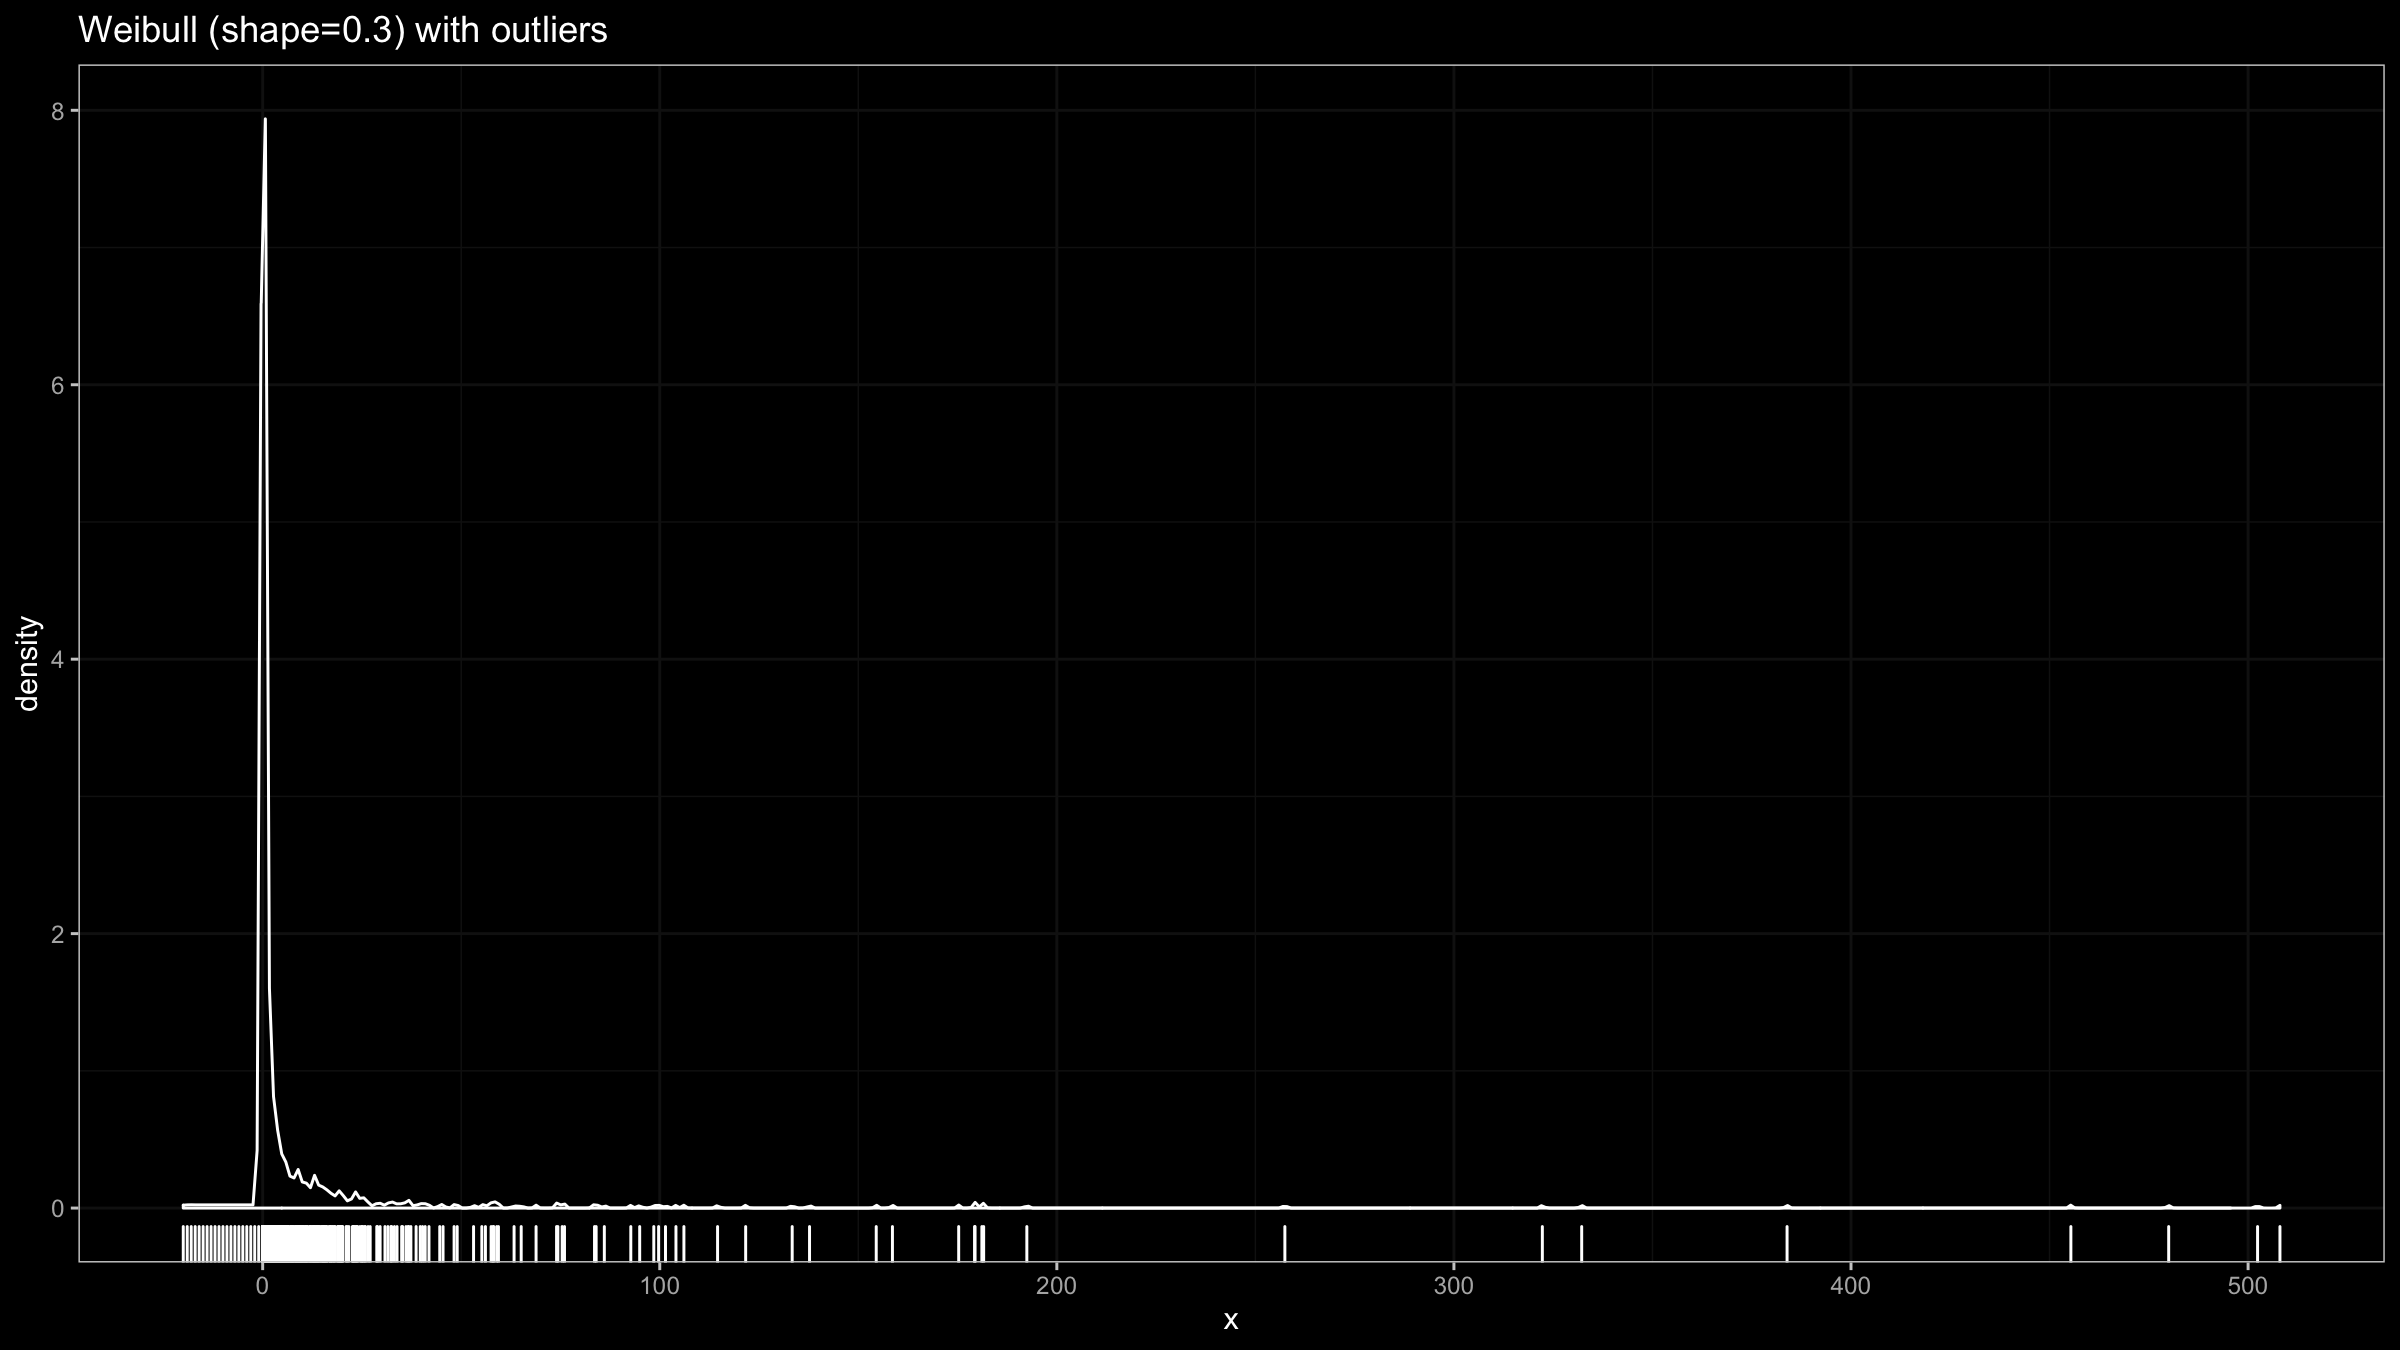
- Draw a density plot for this sample using the normal kernel and the Sheather & Jones method.
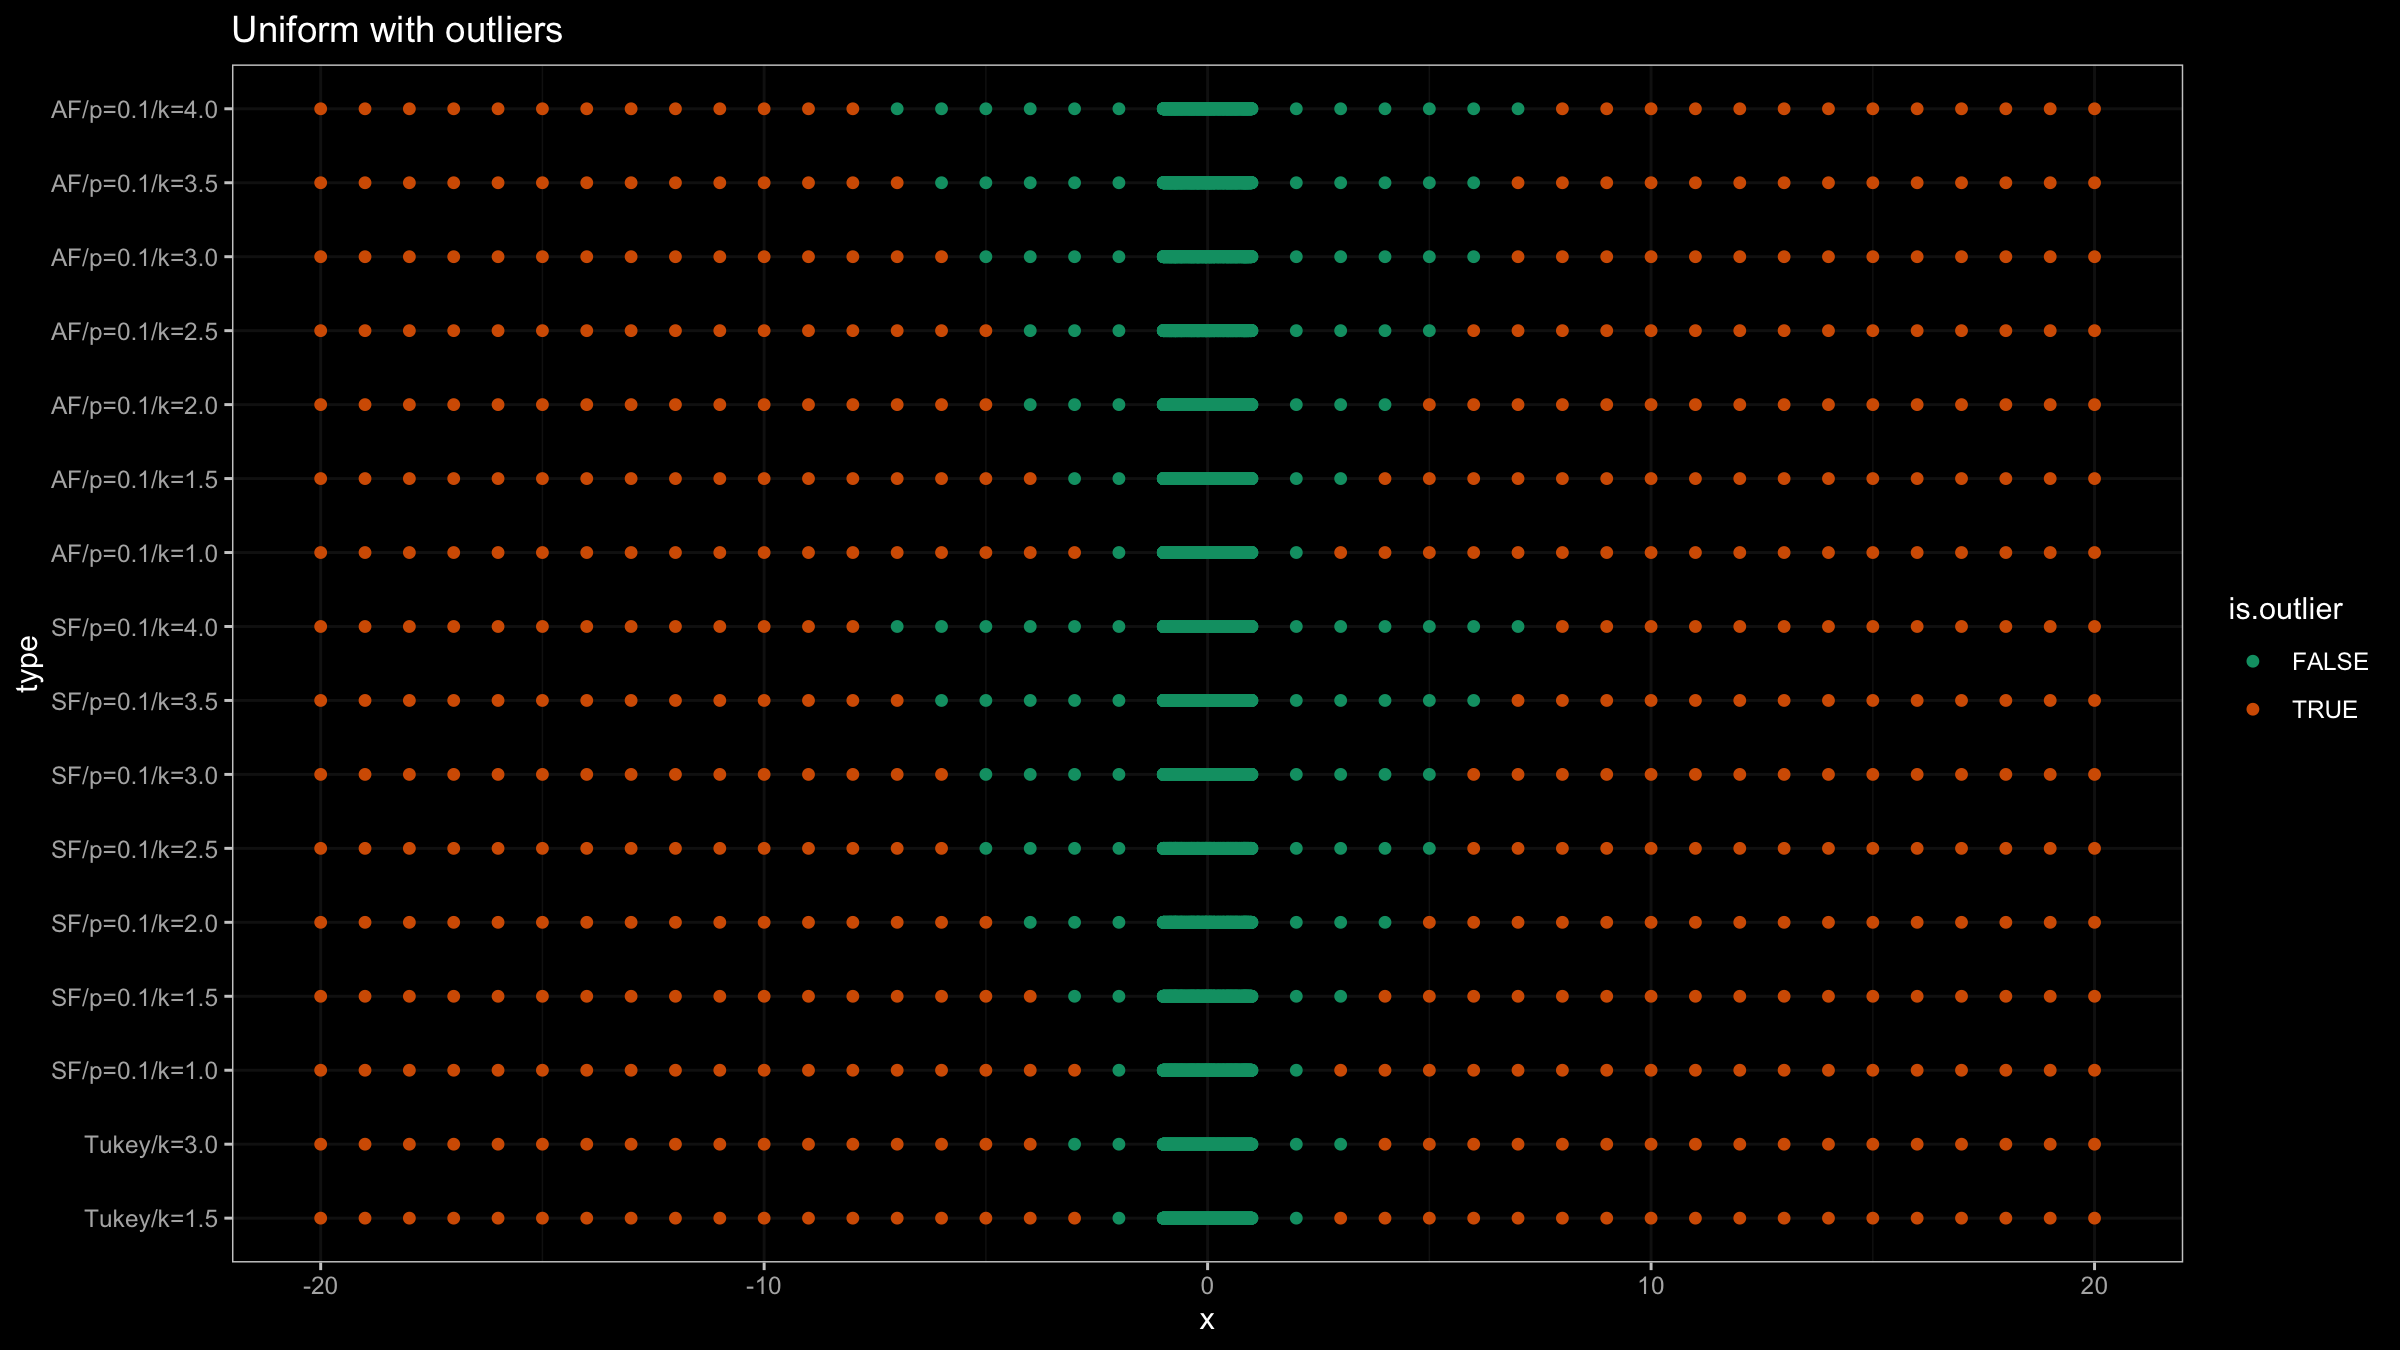
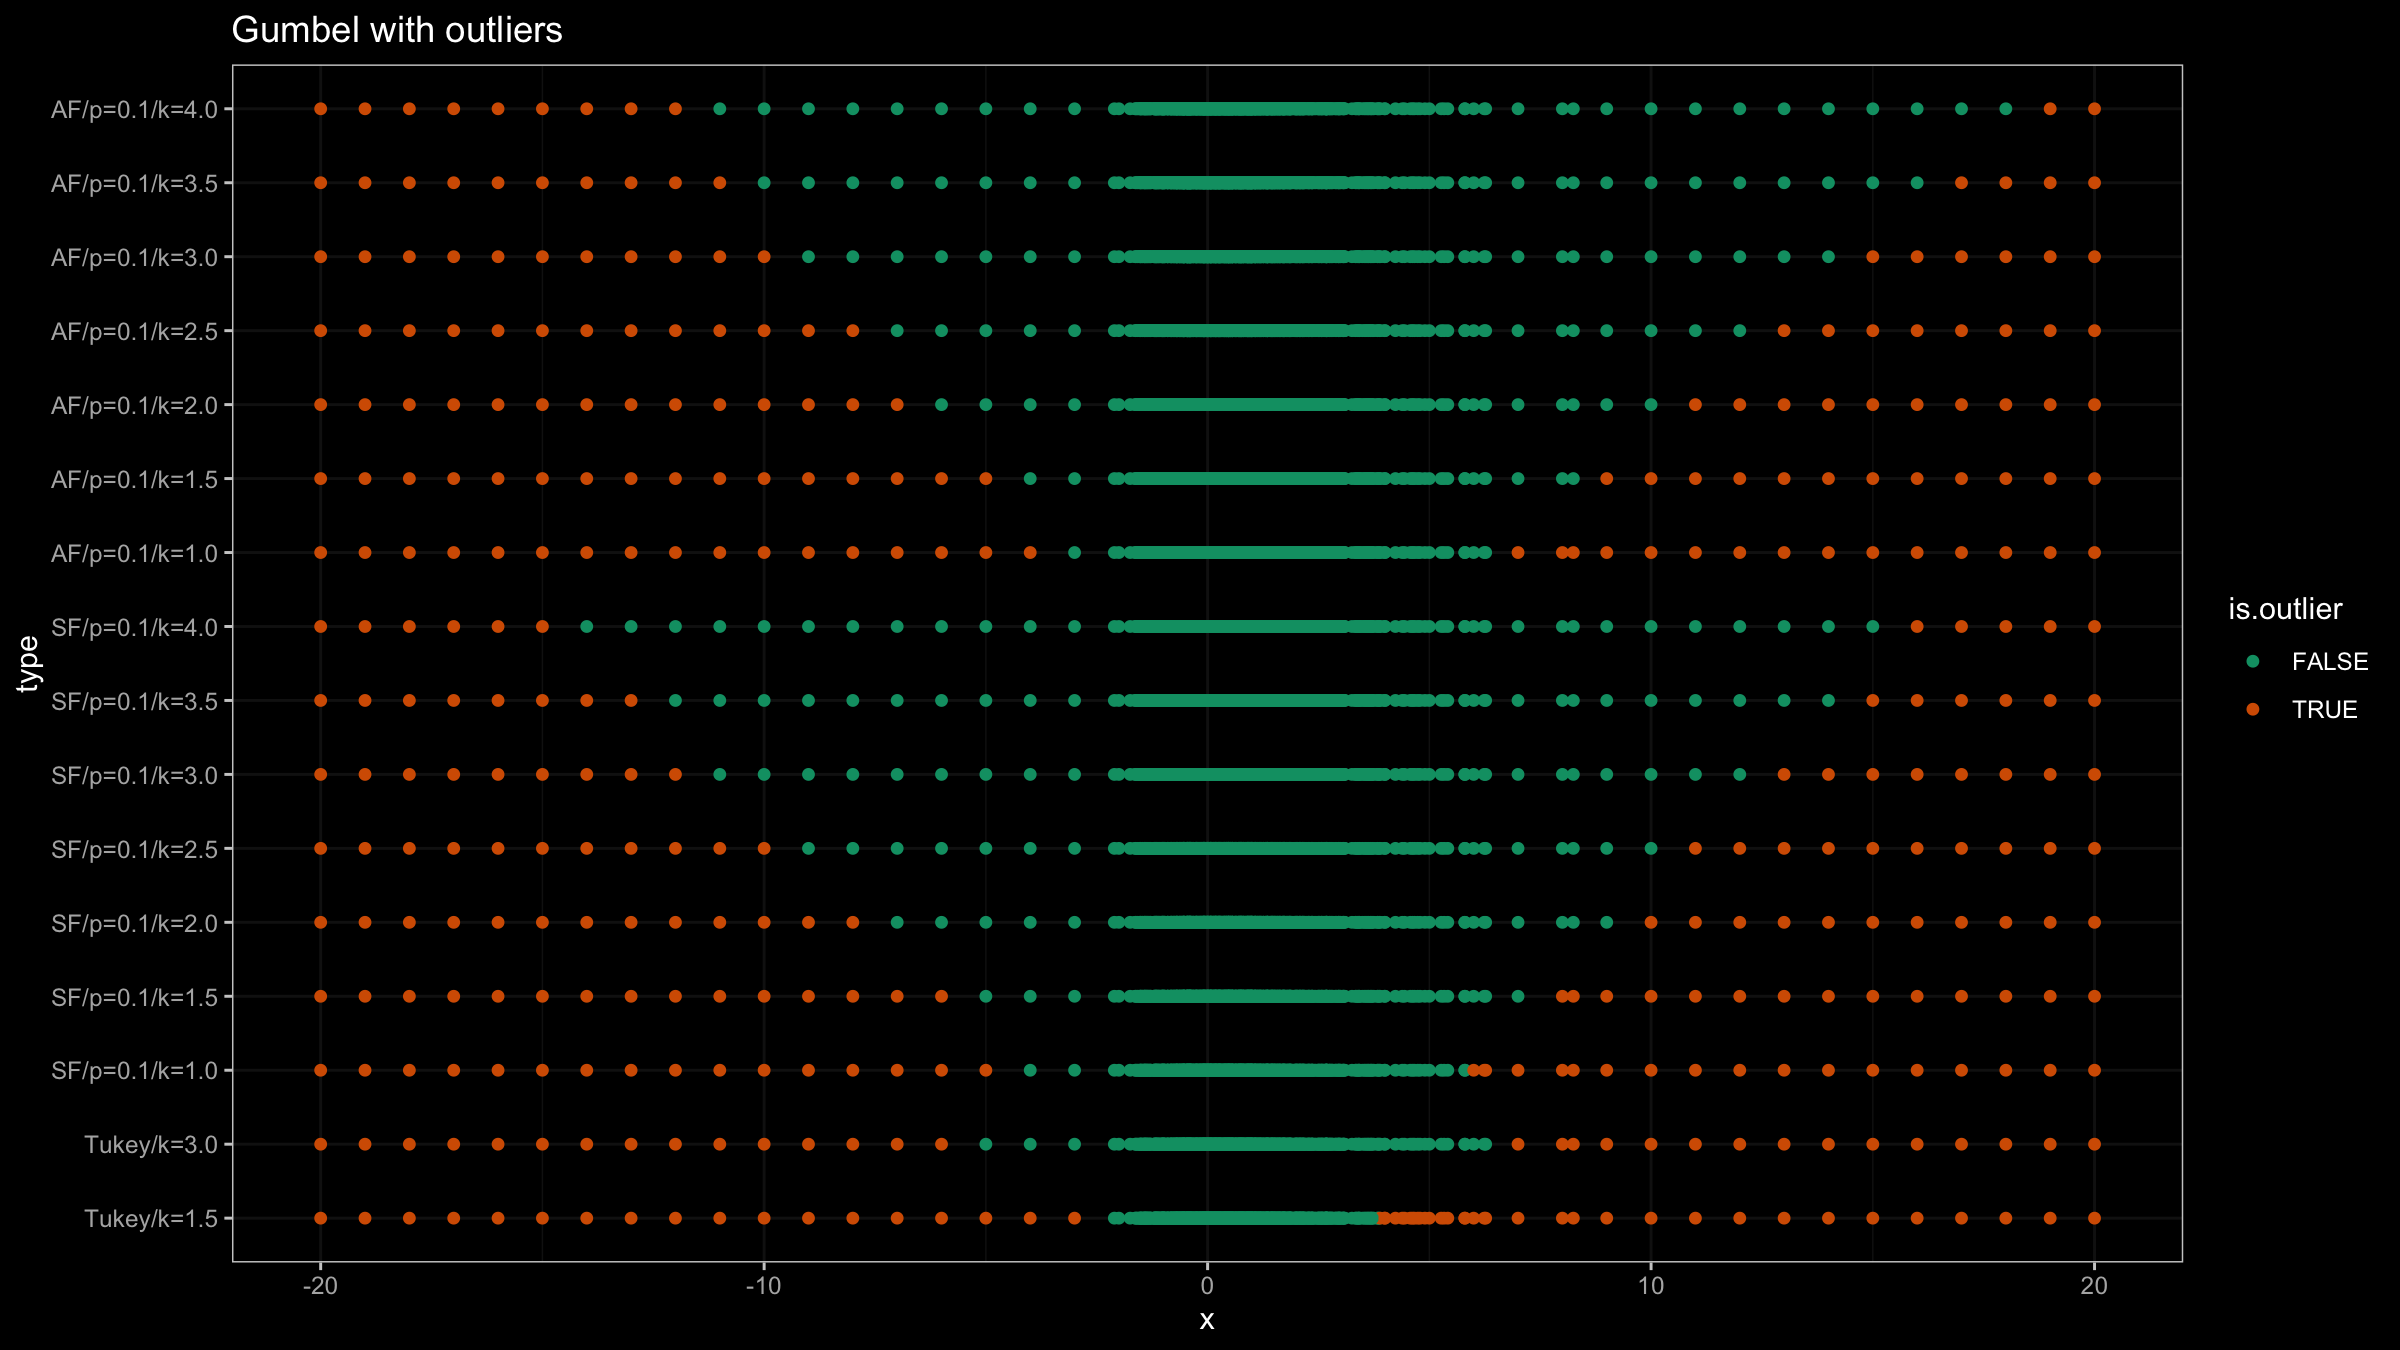
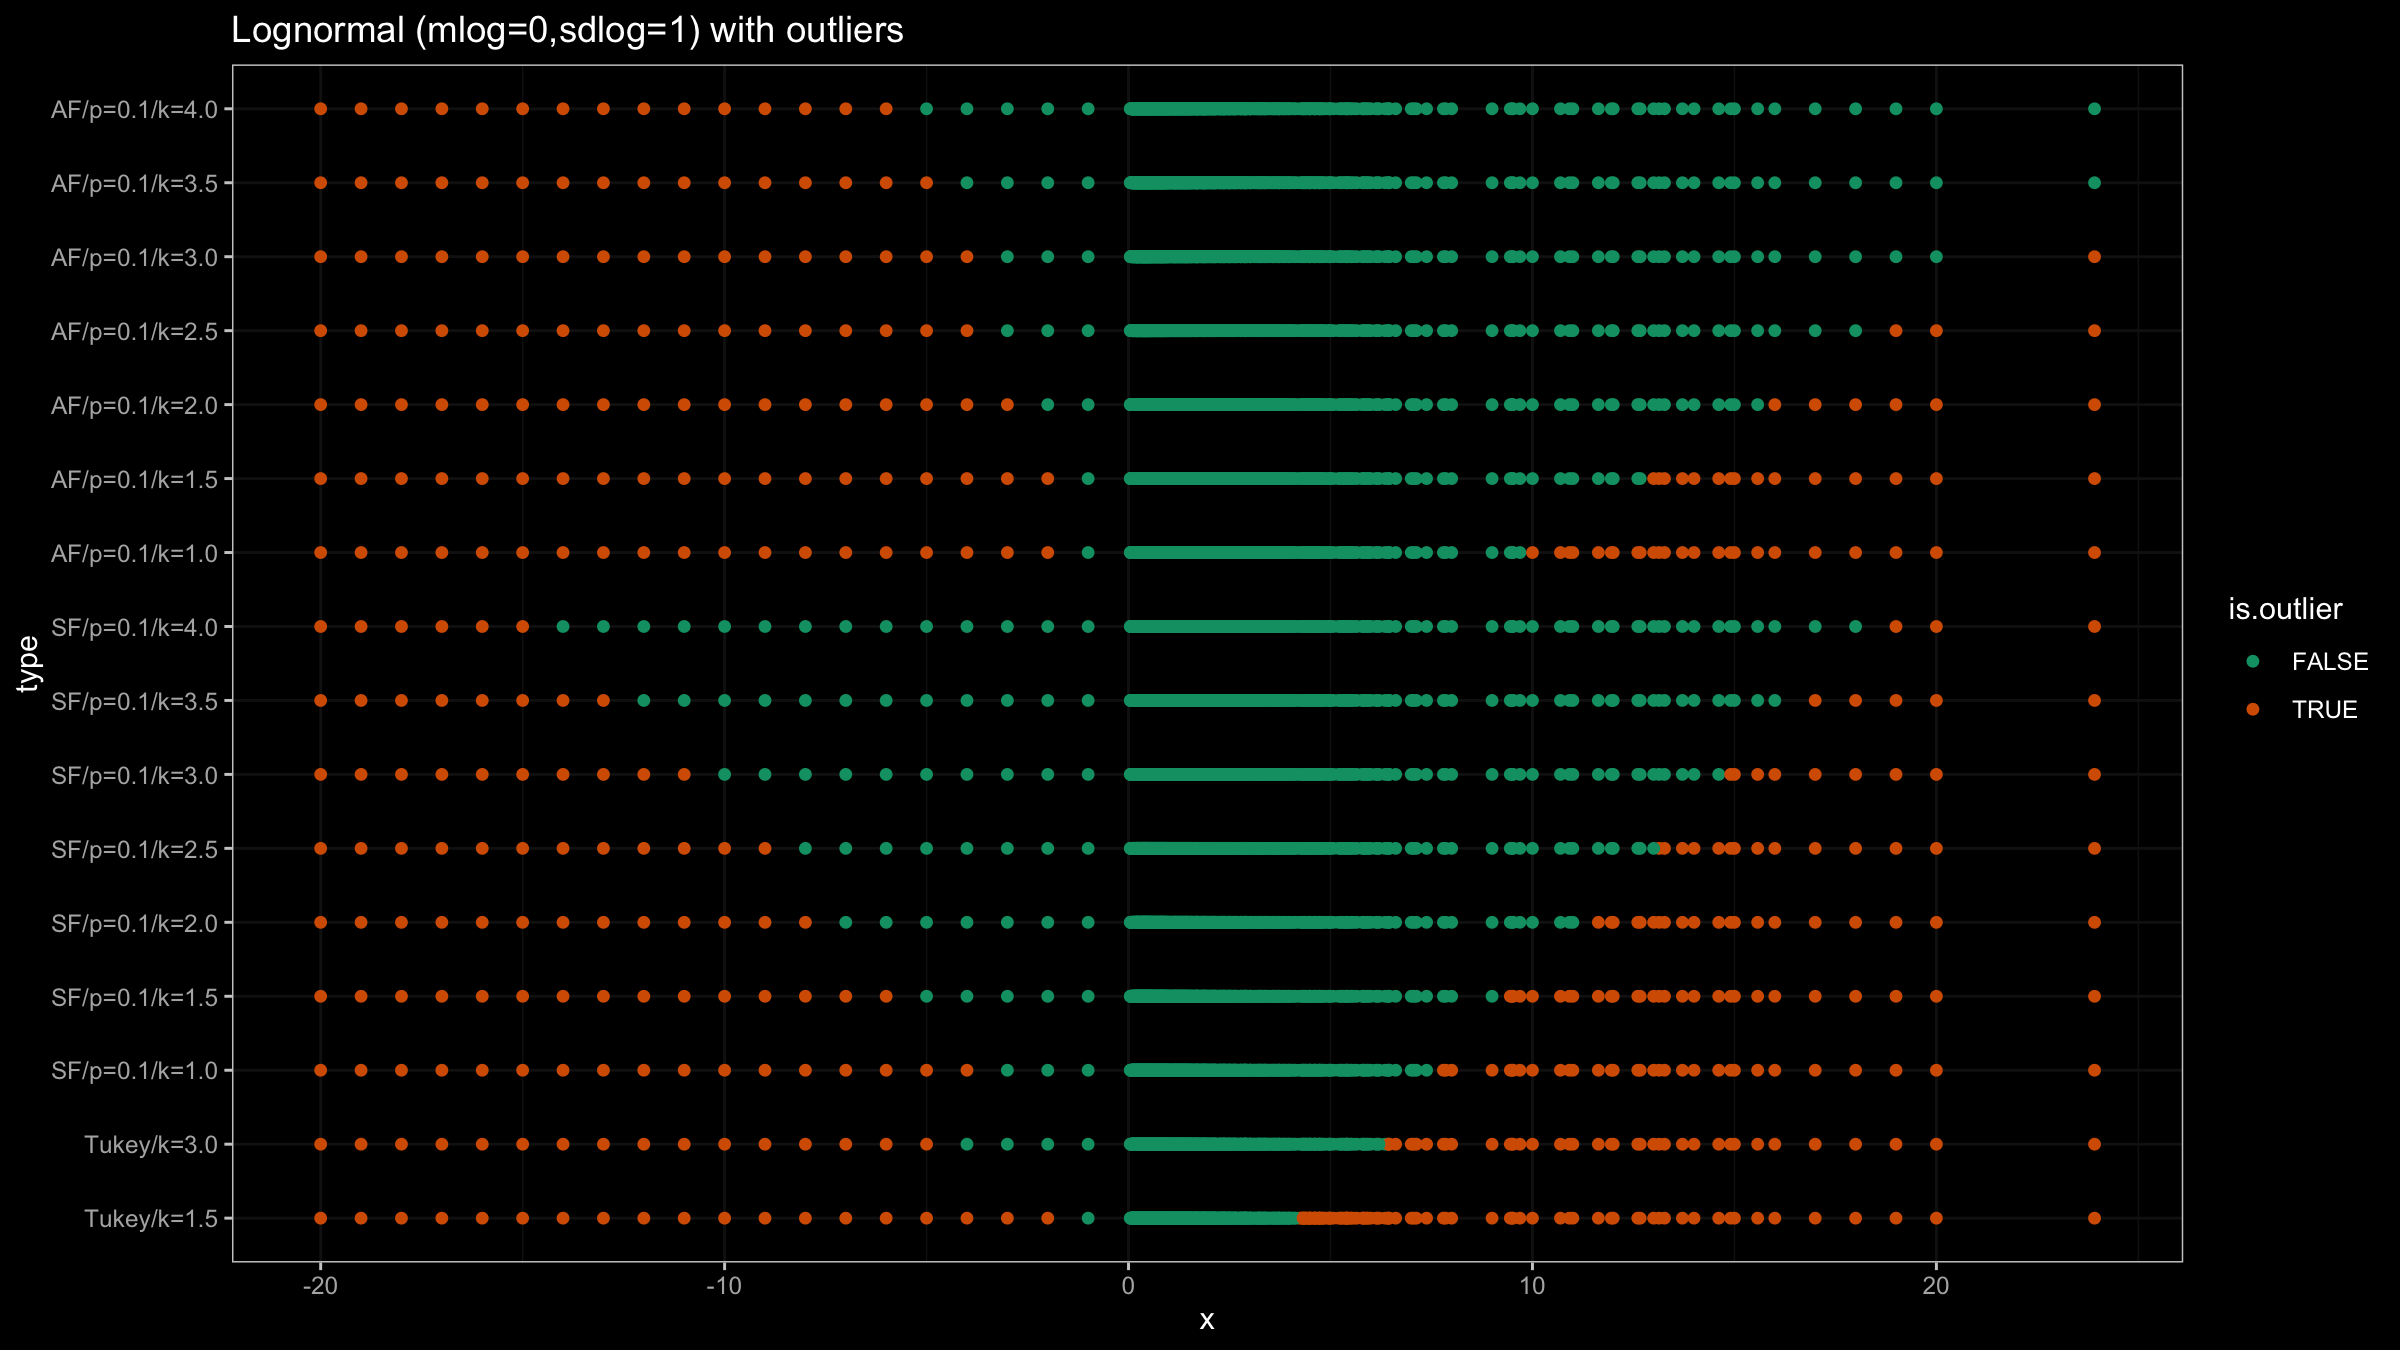
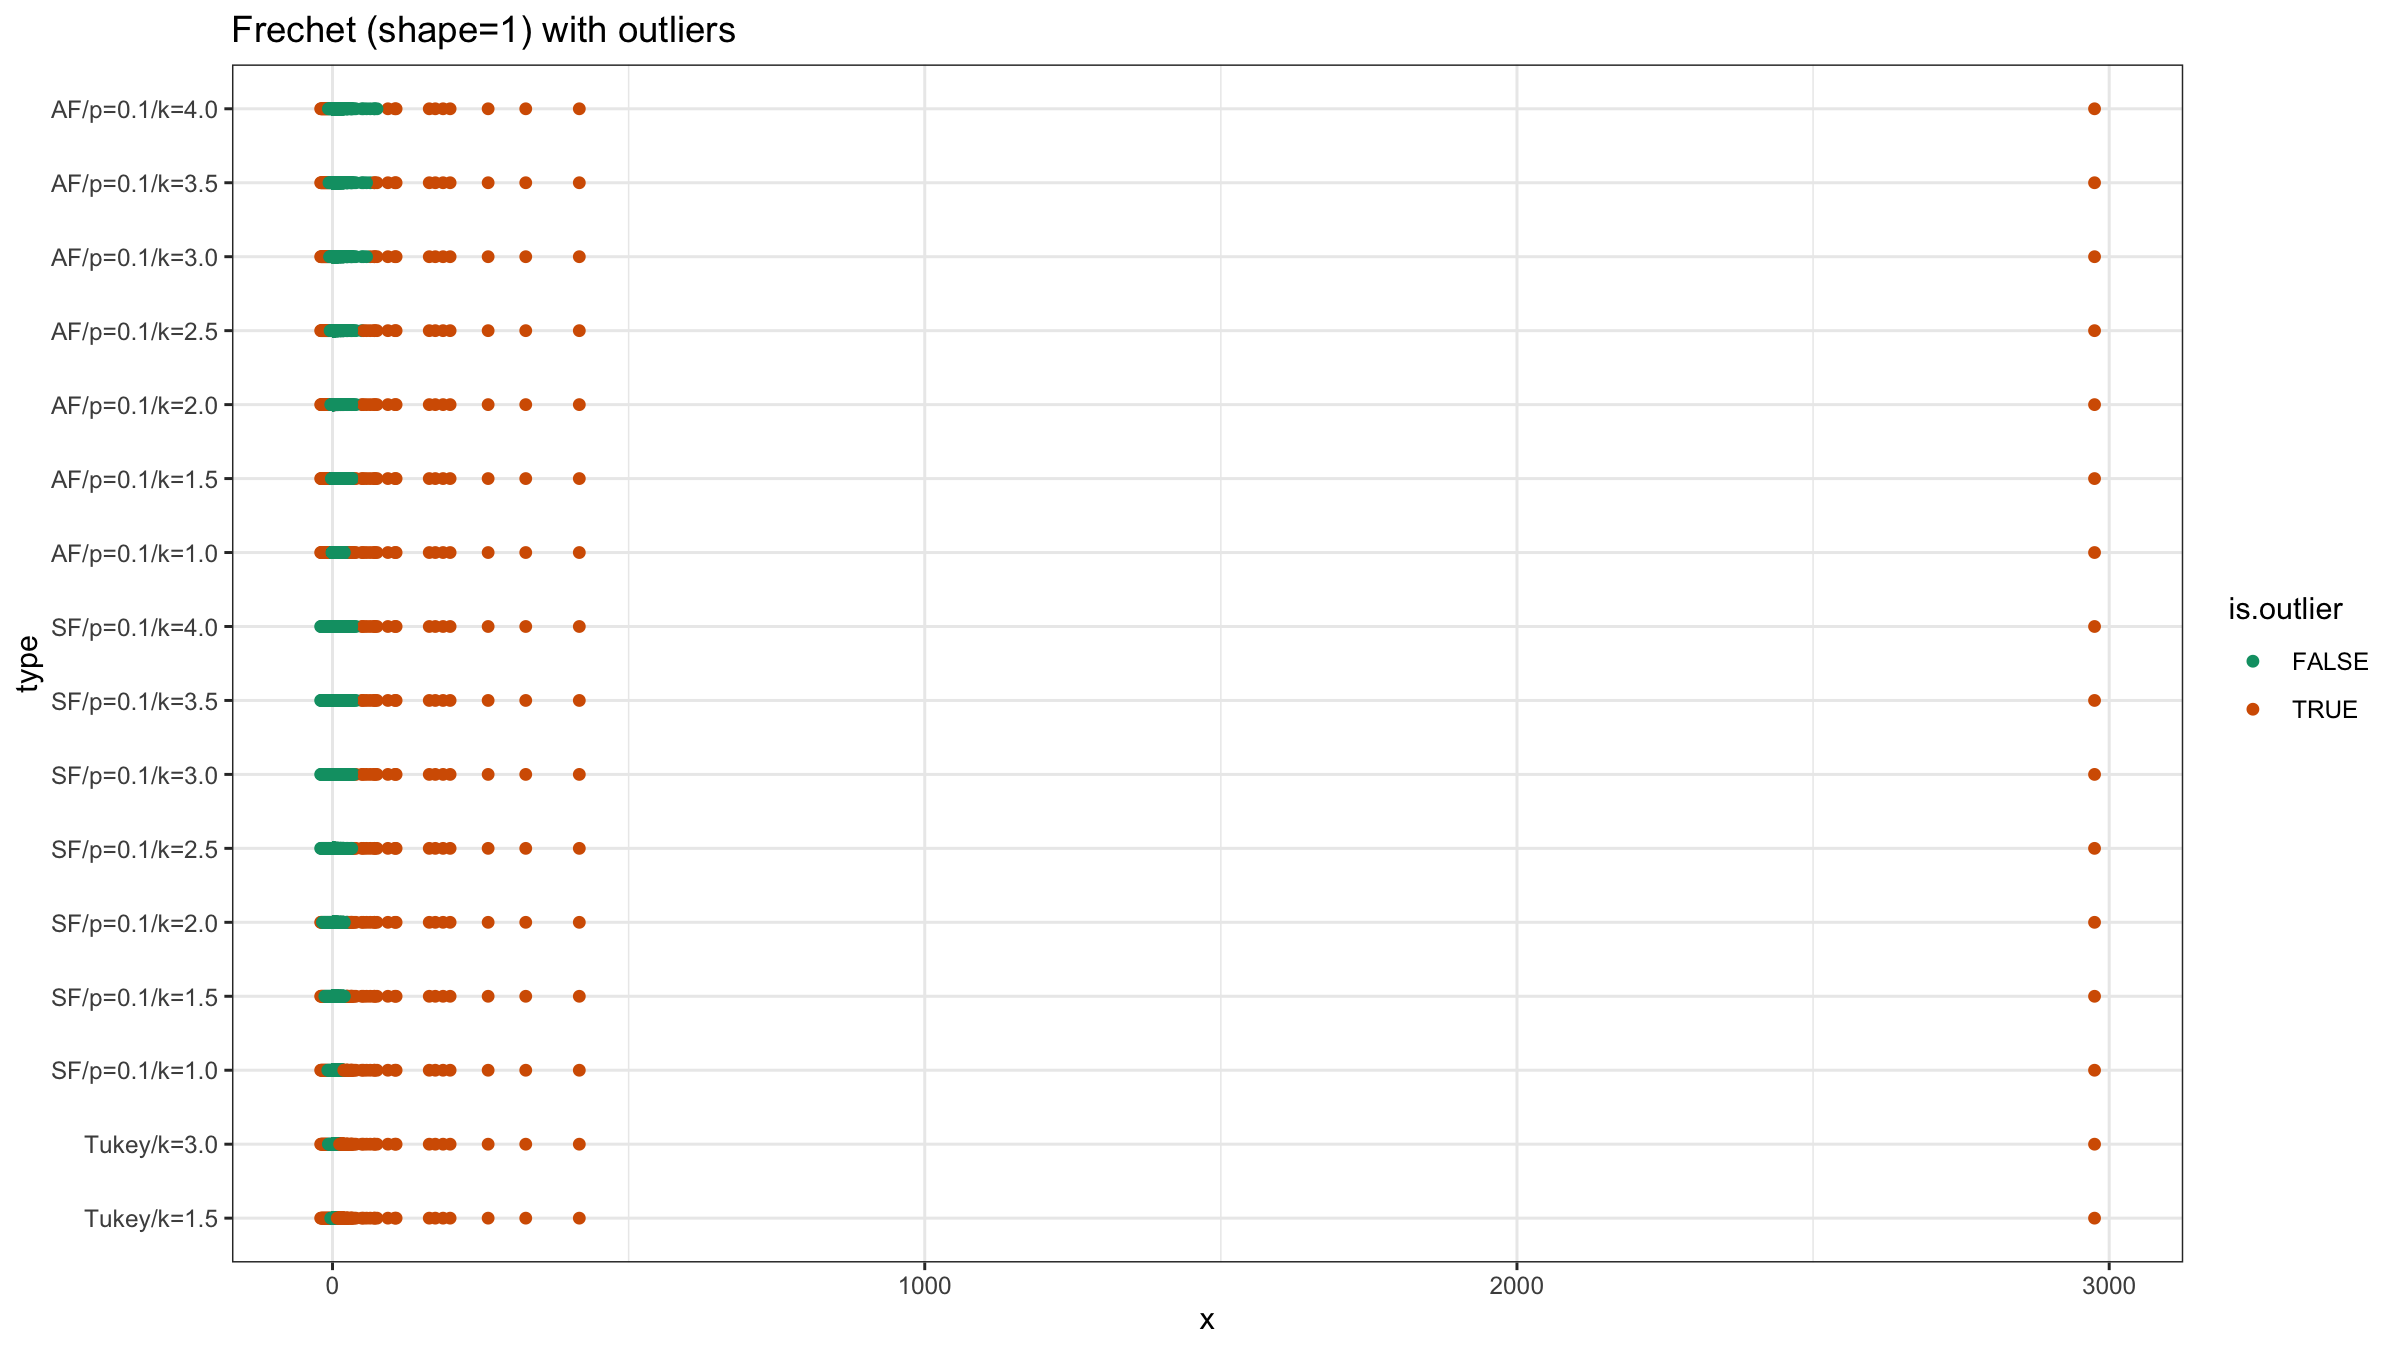
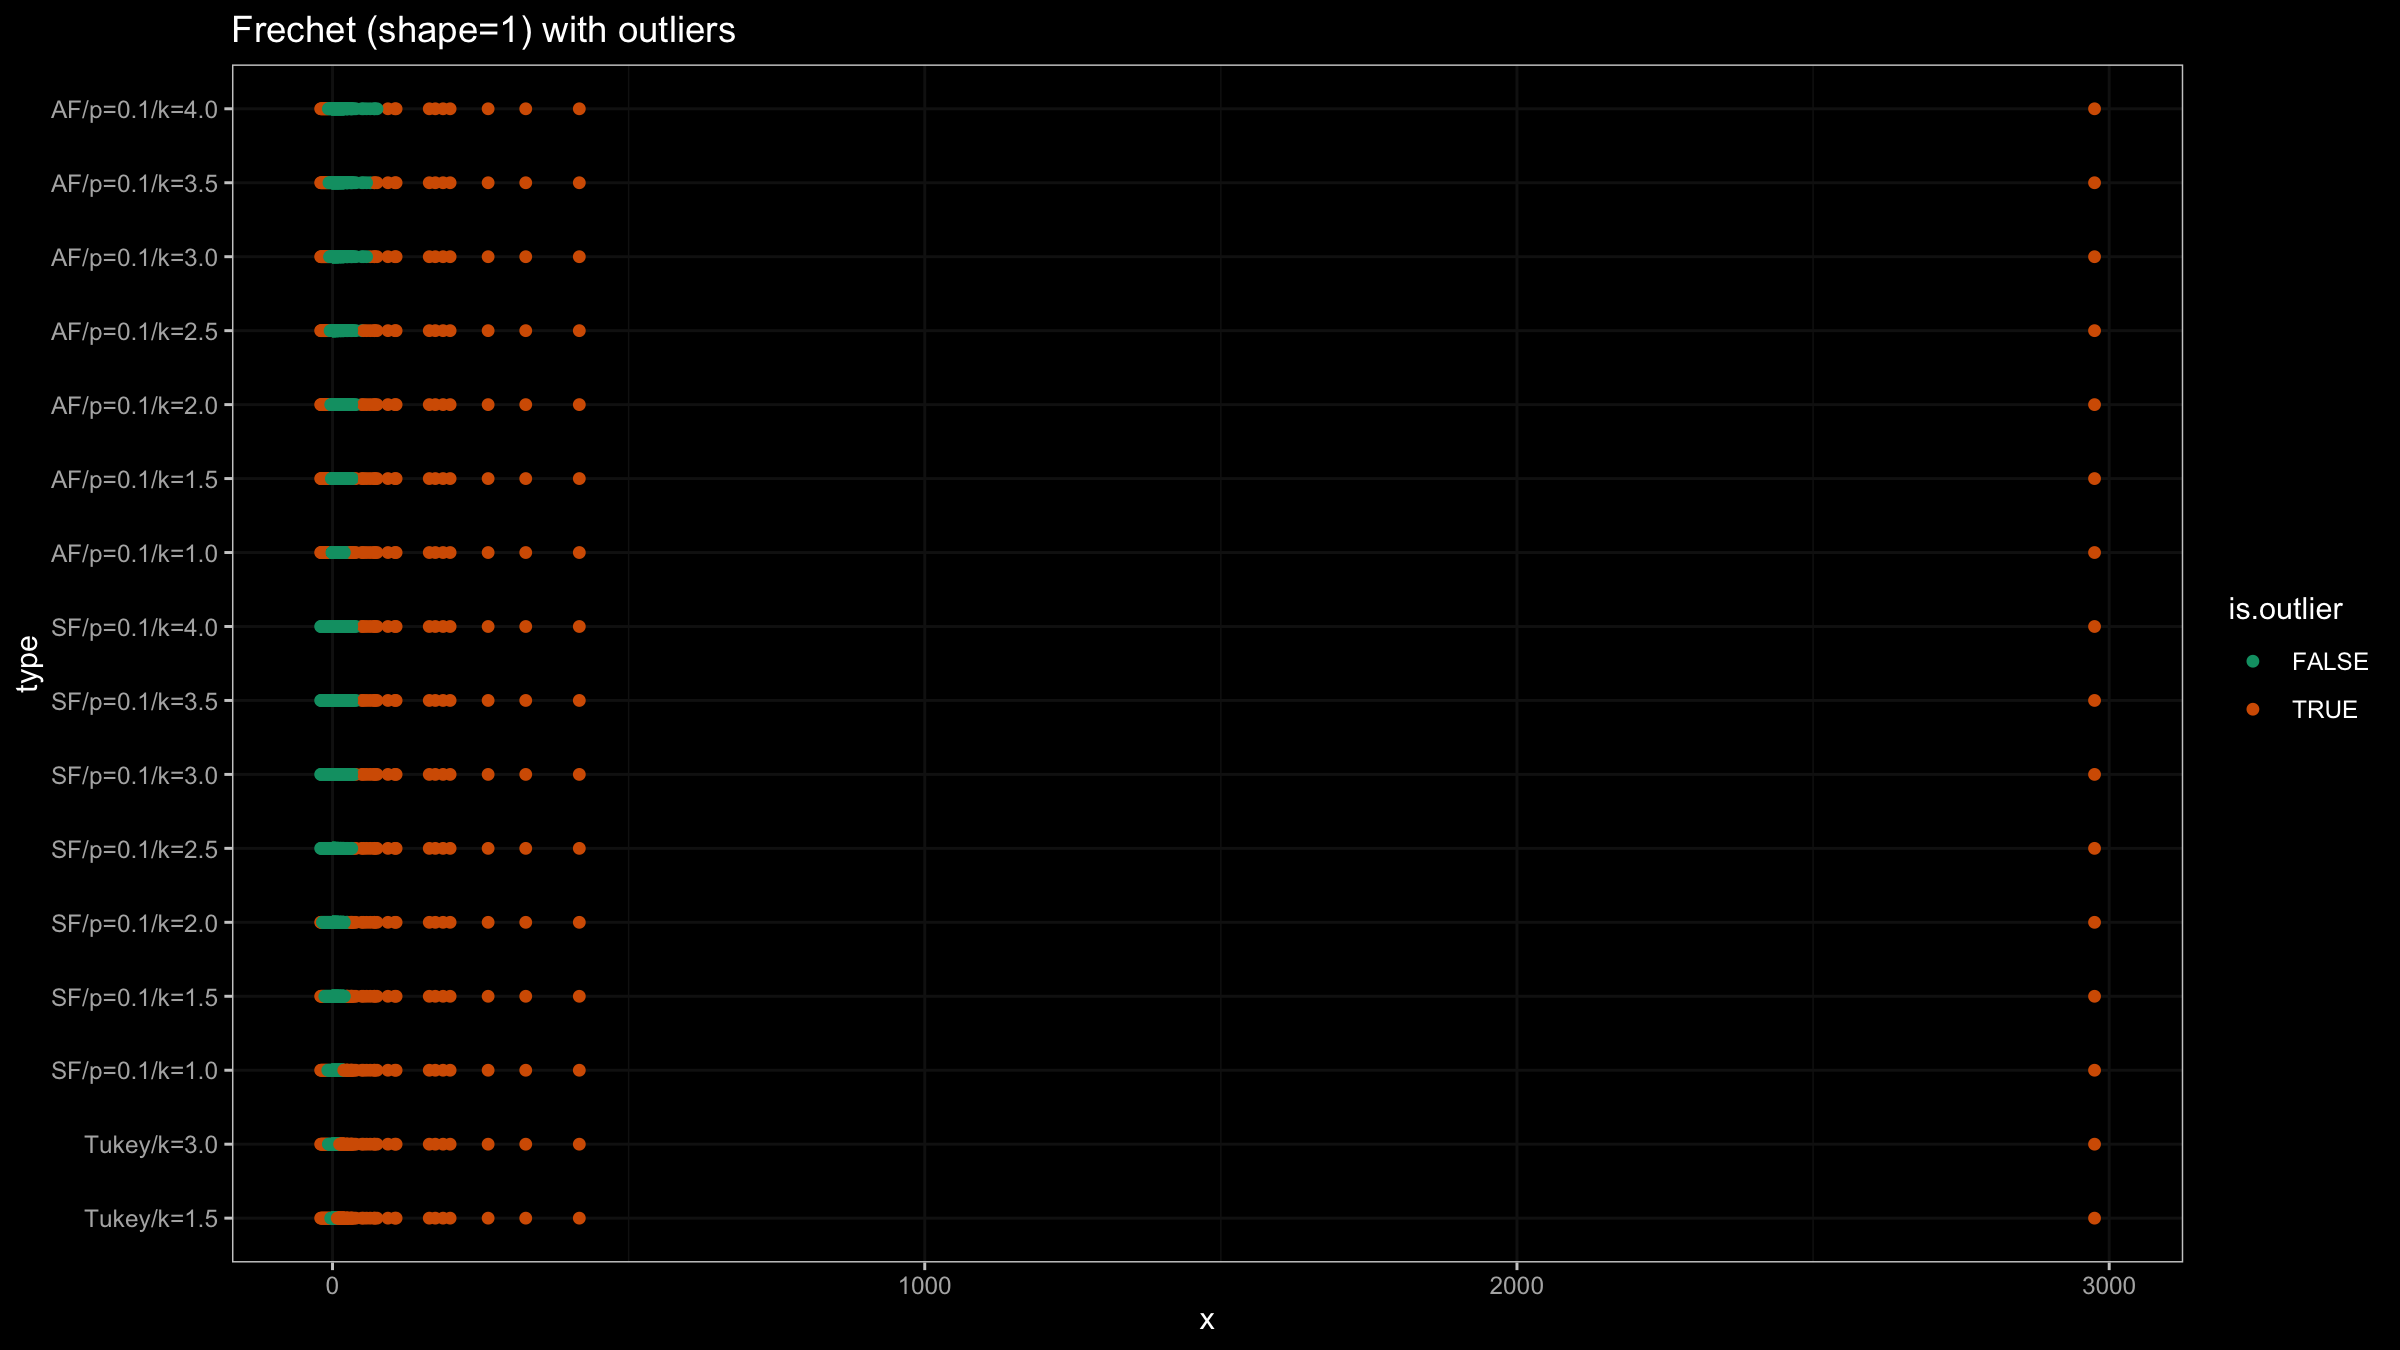
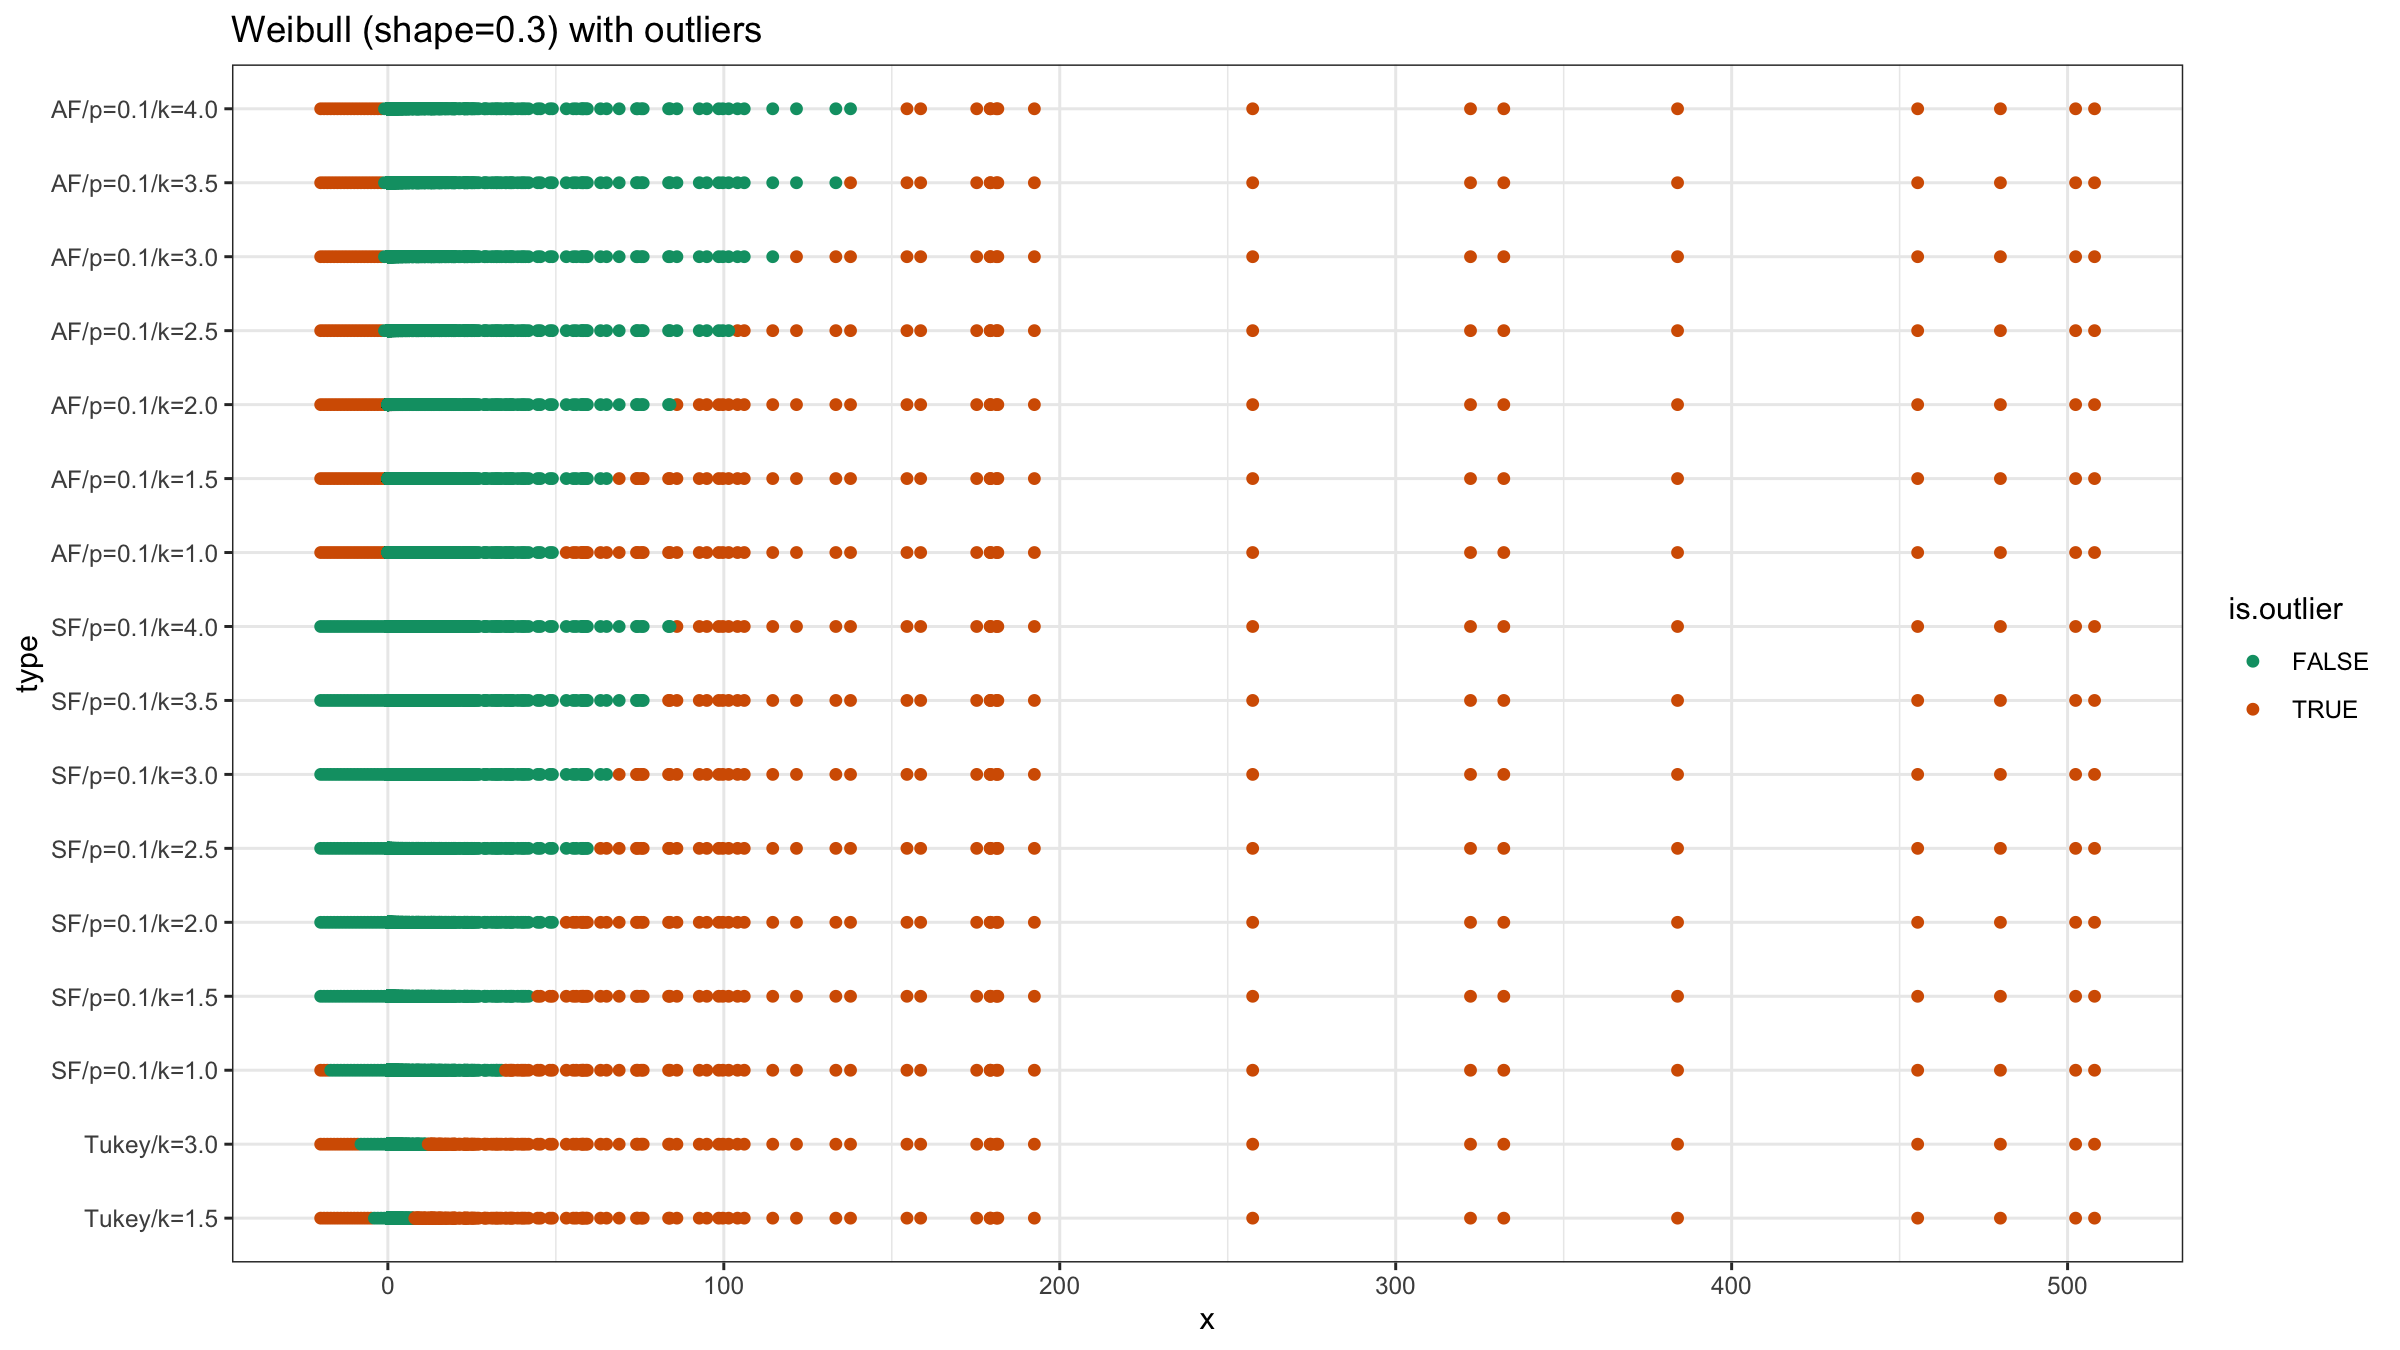
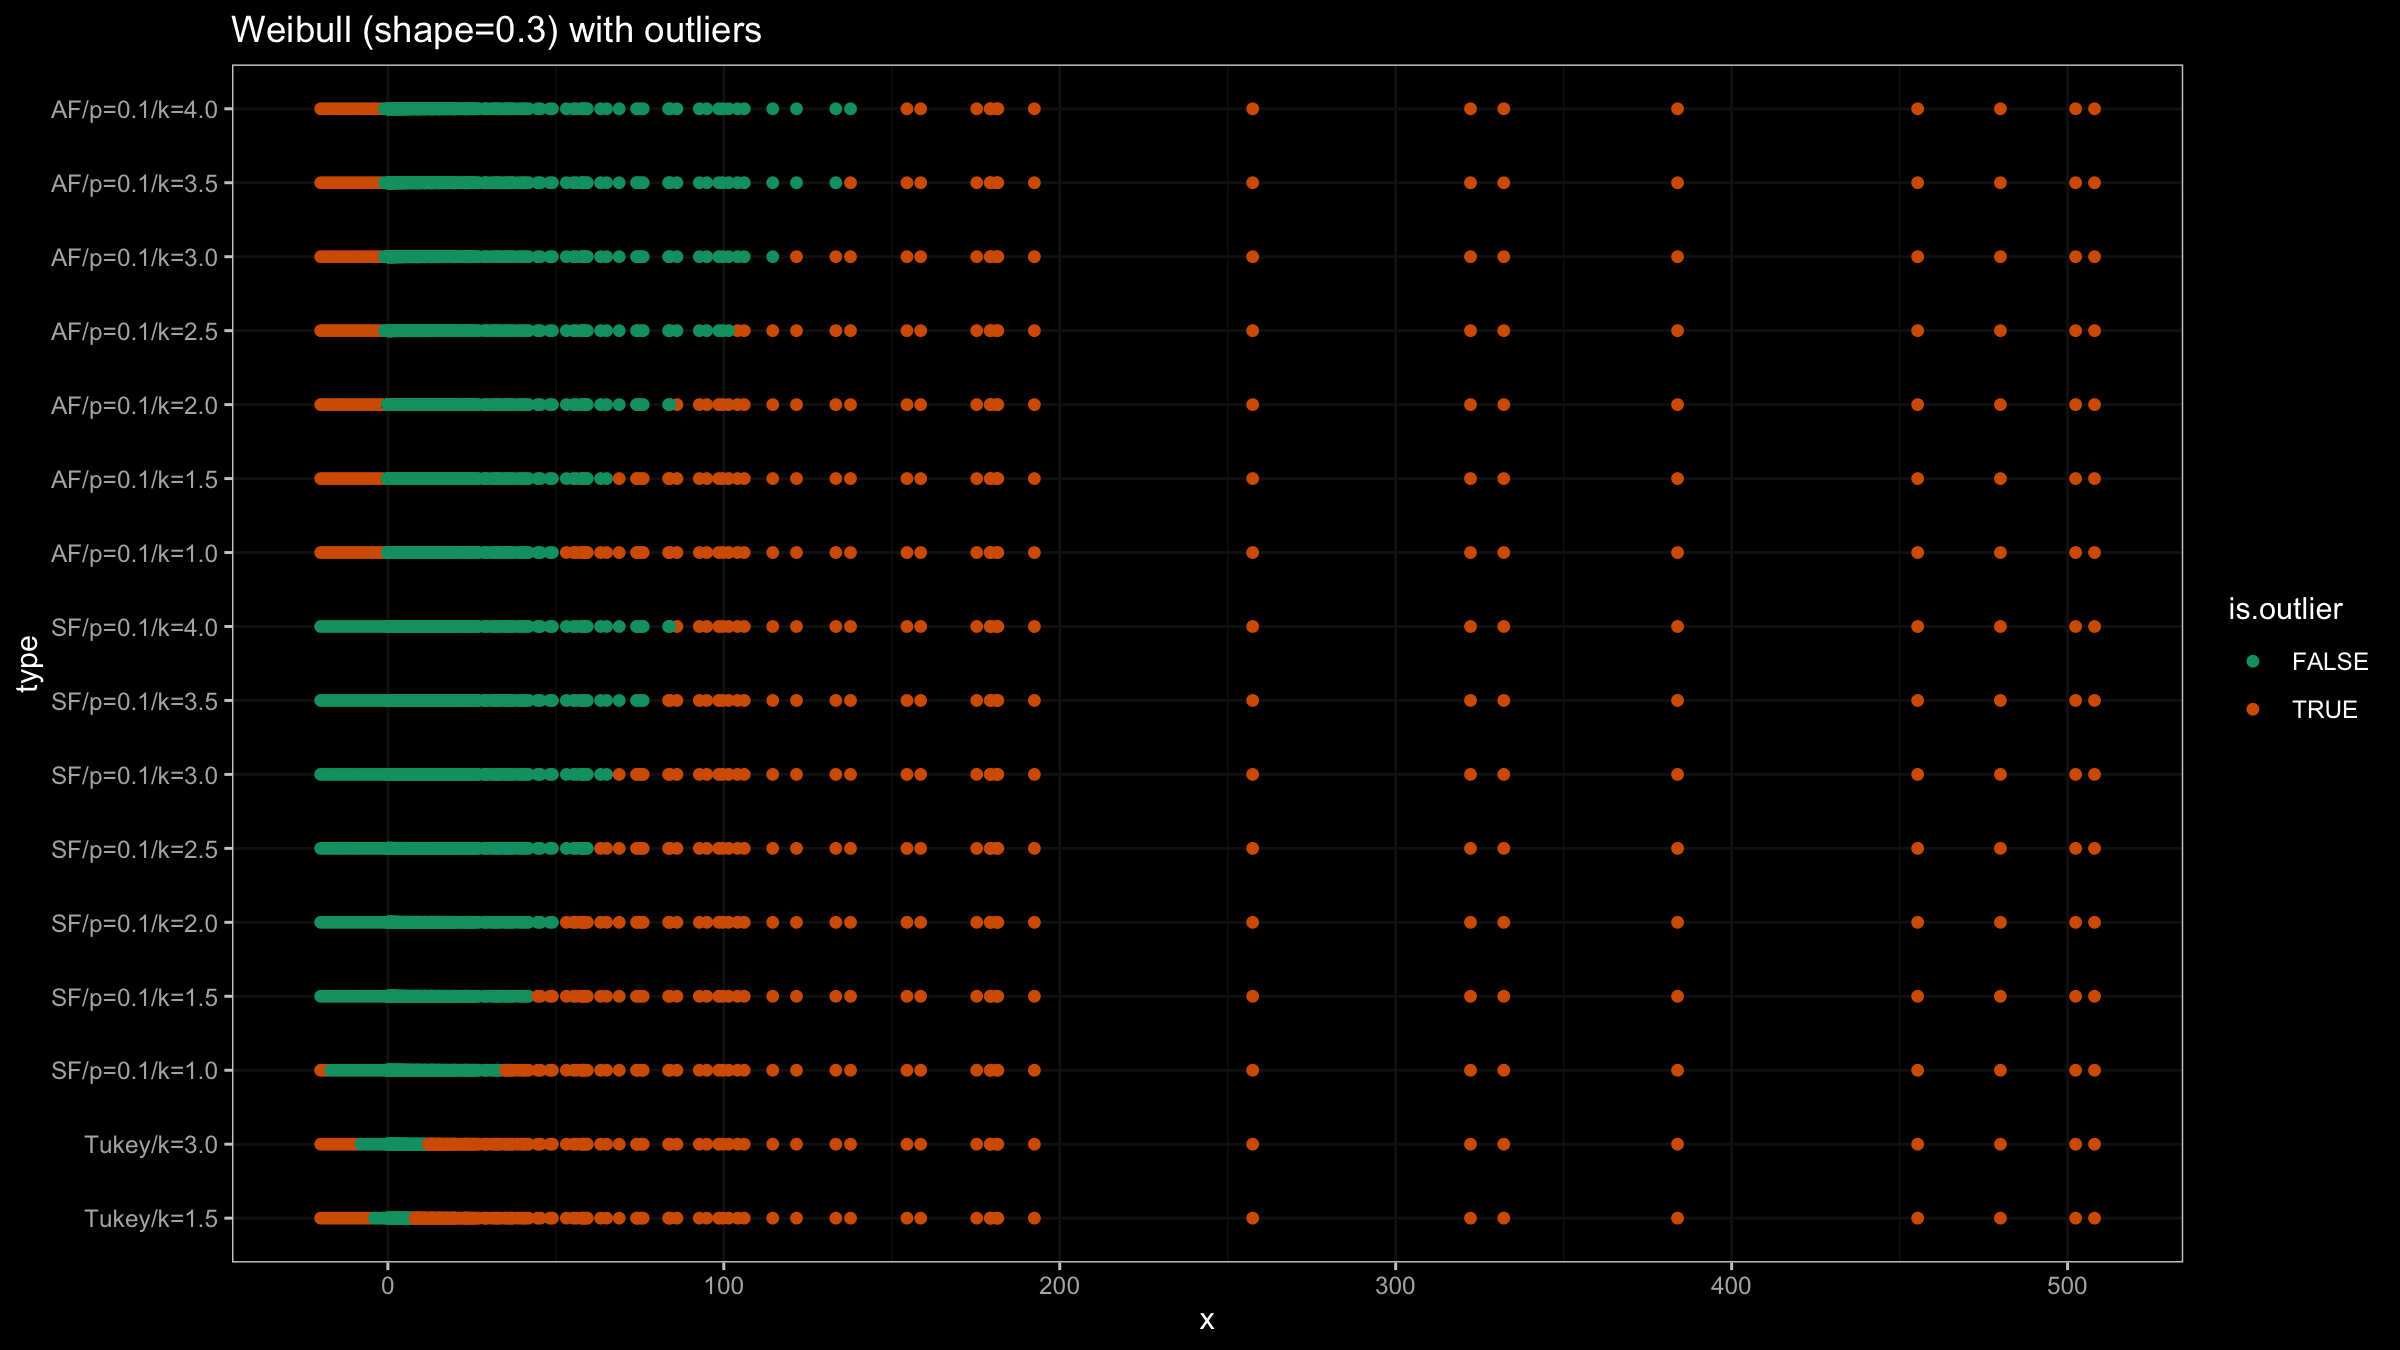
- Enumerate different outlier detection methods and highlight detected outliers.
Here are the results:
