Inconsistent violin plots
The usefulness and meaningfulness of the violin plots are dubious (e.g., see this video and the corresponding discussion). While this type of plot inherits issues of density plots (e.g., the bandwidth selection problem) and box plots, it also introduces new problems. One such problem is data inconsistency: default density plots and box plots are often incompatible with each other. In this post, I show an example of this inconsistency.
I have generated the following sample of 30 elements from the standard normal distribution:
set.seed(7353)
x <- rnorm(30)
x

## [25] -1.52650715 -2.01070341 -0.19995910  1.74372029  1.32134575 -0.01428428
Here is a possible violin plot for this sample:
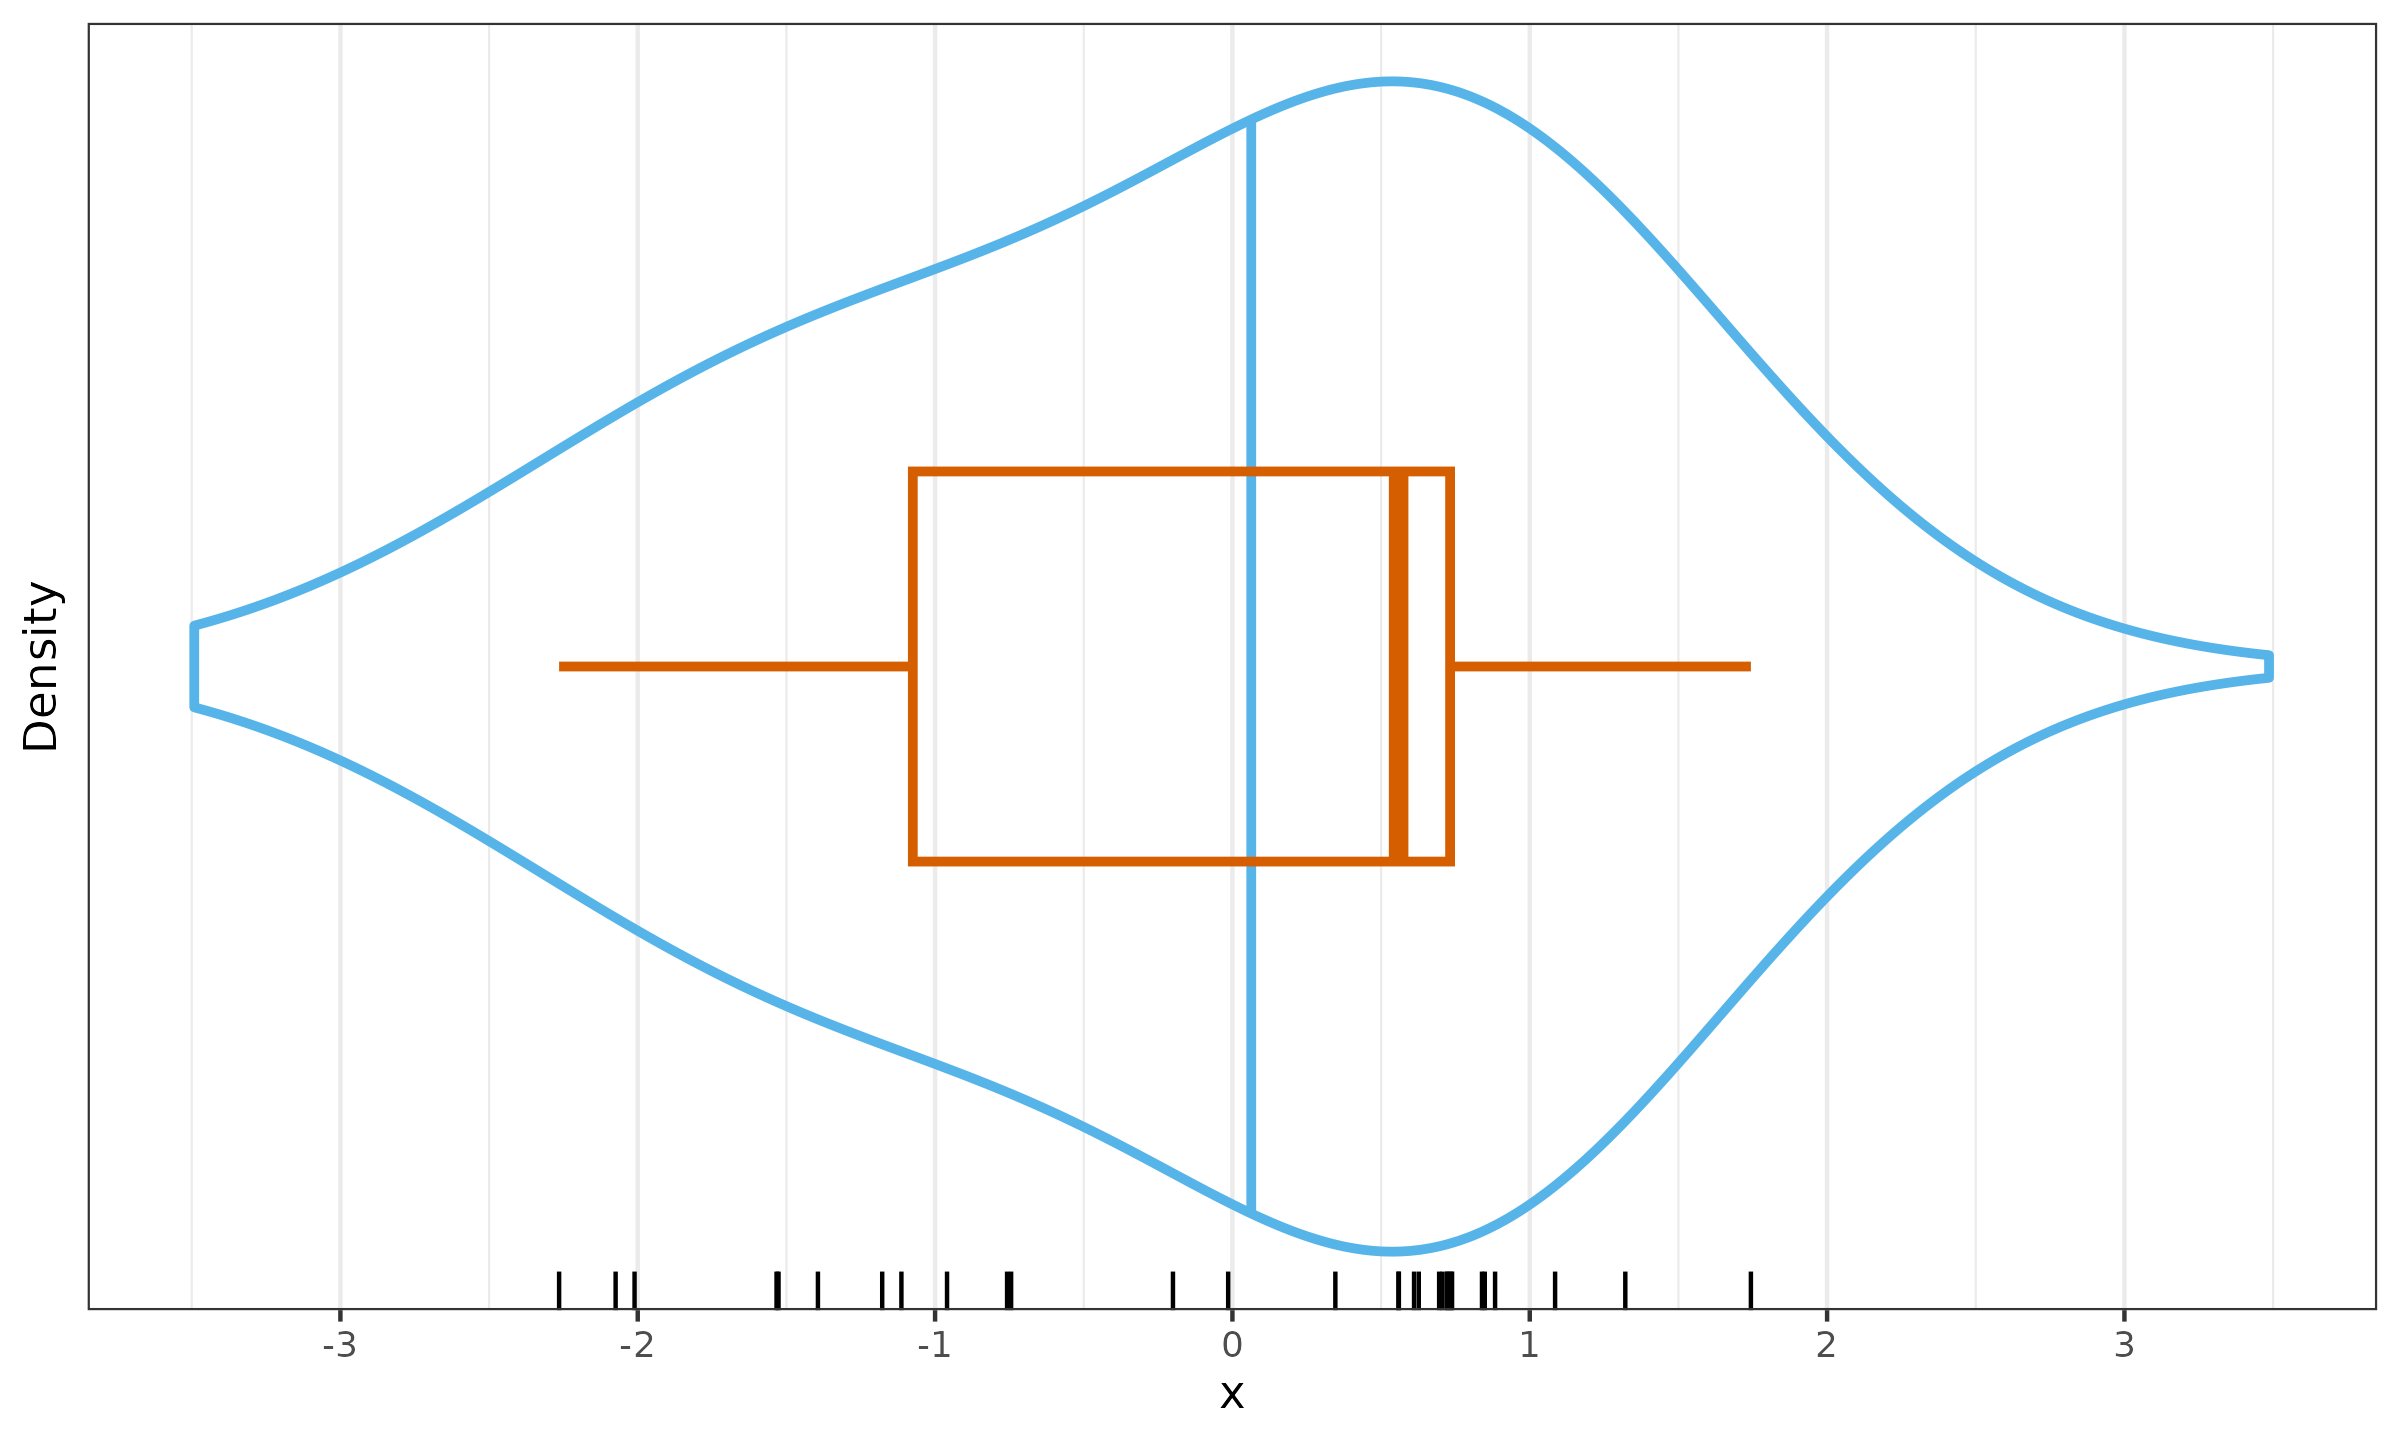
This plot combines two other visualizations:
- A density plot (we use kernel density estimation with the default normal kernel; bandwidth = 0.9)
- A box plot (we use the default Hyndman-Fan Type 7 quantile estimator)
I have also added two additional elements:
- A rug plot on the bottom shows the raw sample elements
- The true median of the density plot (large vertical segment)
As we can see, the density plot median and the box plot median are noticeably inconsistent: $\approx 0.06$ vs. $\approx 0.56$. The difference between the medians is about $0.5$, which is half of the standard deviation. Usually, the KDE median is not presented in the plot, but an experienced researcher can make a good guess about its location. However, the violin plot specifically highlights the sample median, which is inconsistent with the KDE shape. The density and boxplot parts of the violin plot contradict each other, while they are supposed to complement.
The inconsistency inside the violin plot is just an example of a more general pitfall. If some parts of the research are based on sample quantiles and other parts are based on density estimations, the results may be inconsistent. One of the possible workarounds for this issue is the usage of quantile-respectful density estimation based on the Harrell-Davis quantile estimator, which gives a consistent pair of density and quantile estimators.