Exploring the power curve of the Lepage test
Previously, I already discussed the Cucconi test. In this post, I continue the topic of nonparametric tests and check out the Lepage test.
The Lepage test
Let $\mathbf{x} = (x_1, x_2, \ldots, x_n)$ and $\mathbf{y} = (y_1, y_2, \ldots, y_m)$ be random samples. Let $N=n+m$. Let $\mathbf{V} = (V_1, V_2, \ldots, V_N)$ be a boolean vector of zeros and ones, where $V_i = 1$ if the $i^\textrm{th}$ order statistic of the pooled sample $(\mathbf{x}, \mathbf{y})$ is come from $\mathbf{x}$.
With this notation, we can define the Wilcoxon statistic $T_1$ and Ansari-Bradley statistic $T_2$ as follows:
$$ T_1 = \sum_{i=1}^N i \cdot V_i, $$$$ T_2 = \frac{1}{2} n (N + 1) - \sum_{i=1}^N \left| i - \frac{1}{2}(N+1) \right| \cdot V_i. $$Let
$$ \mu_1 = \frac{1}{2} n (N + 1), $$$$ \sigma_1^2 = \frac{1}{12} nm (N + 1), $$$$ \mu_2 = \begin{cases} \frac{1}{4} n(N + 2), & \;\textrm{if}\;N\;\textrm{is even,}\\ \frac{1}{4} n(N + 1)^2/N, & \;\textrm{if}\;N\;\textrm{is odd,} \end{cases} $$$$ \sigma_2^2 = \begin{cases} nm(N^2-4) / (48(N-1)) & \;\textrm{if}\;N\;\textrm{is even,}\\ nm(N+1)(N^2+3) / (48N^2) & \;\textrm{if}\;N\;\textrm{is odd.} \end{cases} $$The Lepage statistic is the squared Euclidean distance of standardized Wilcoxon and Ansari–Bradley statistics:
$$ T = \left( \frac{T_1-\mu_1}{\sigma_1} \right)^2 + \left( \frac{T_2-\mu_2}{\sigma_2} \right)^2 $$Power curve
Here is the power curve by effect size for the two-sided Student’s t-test, Mann-Whitney U test, Cucconi test, and Lepage test under normality ($n=\{ 5, 7 \}$, $\alpha = 0.05$):
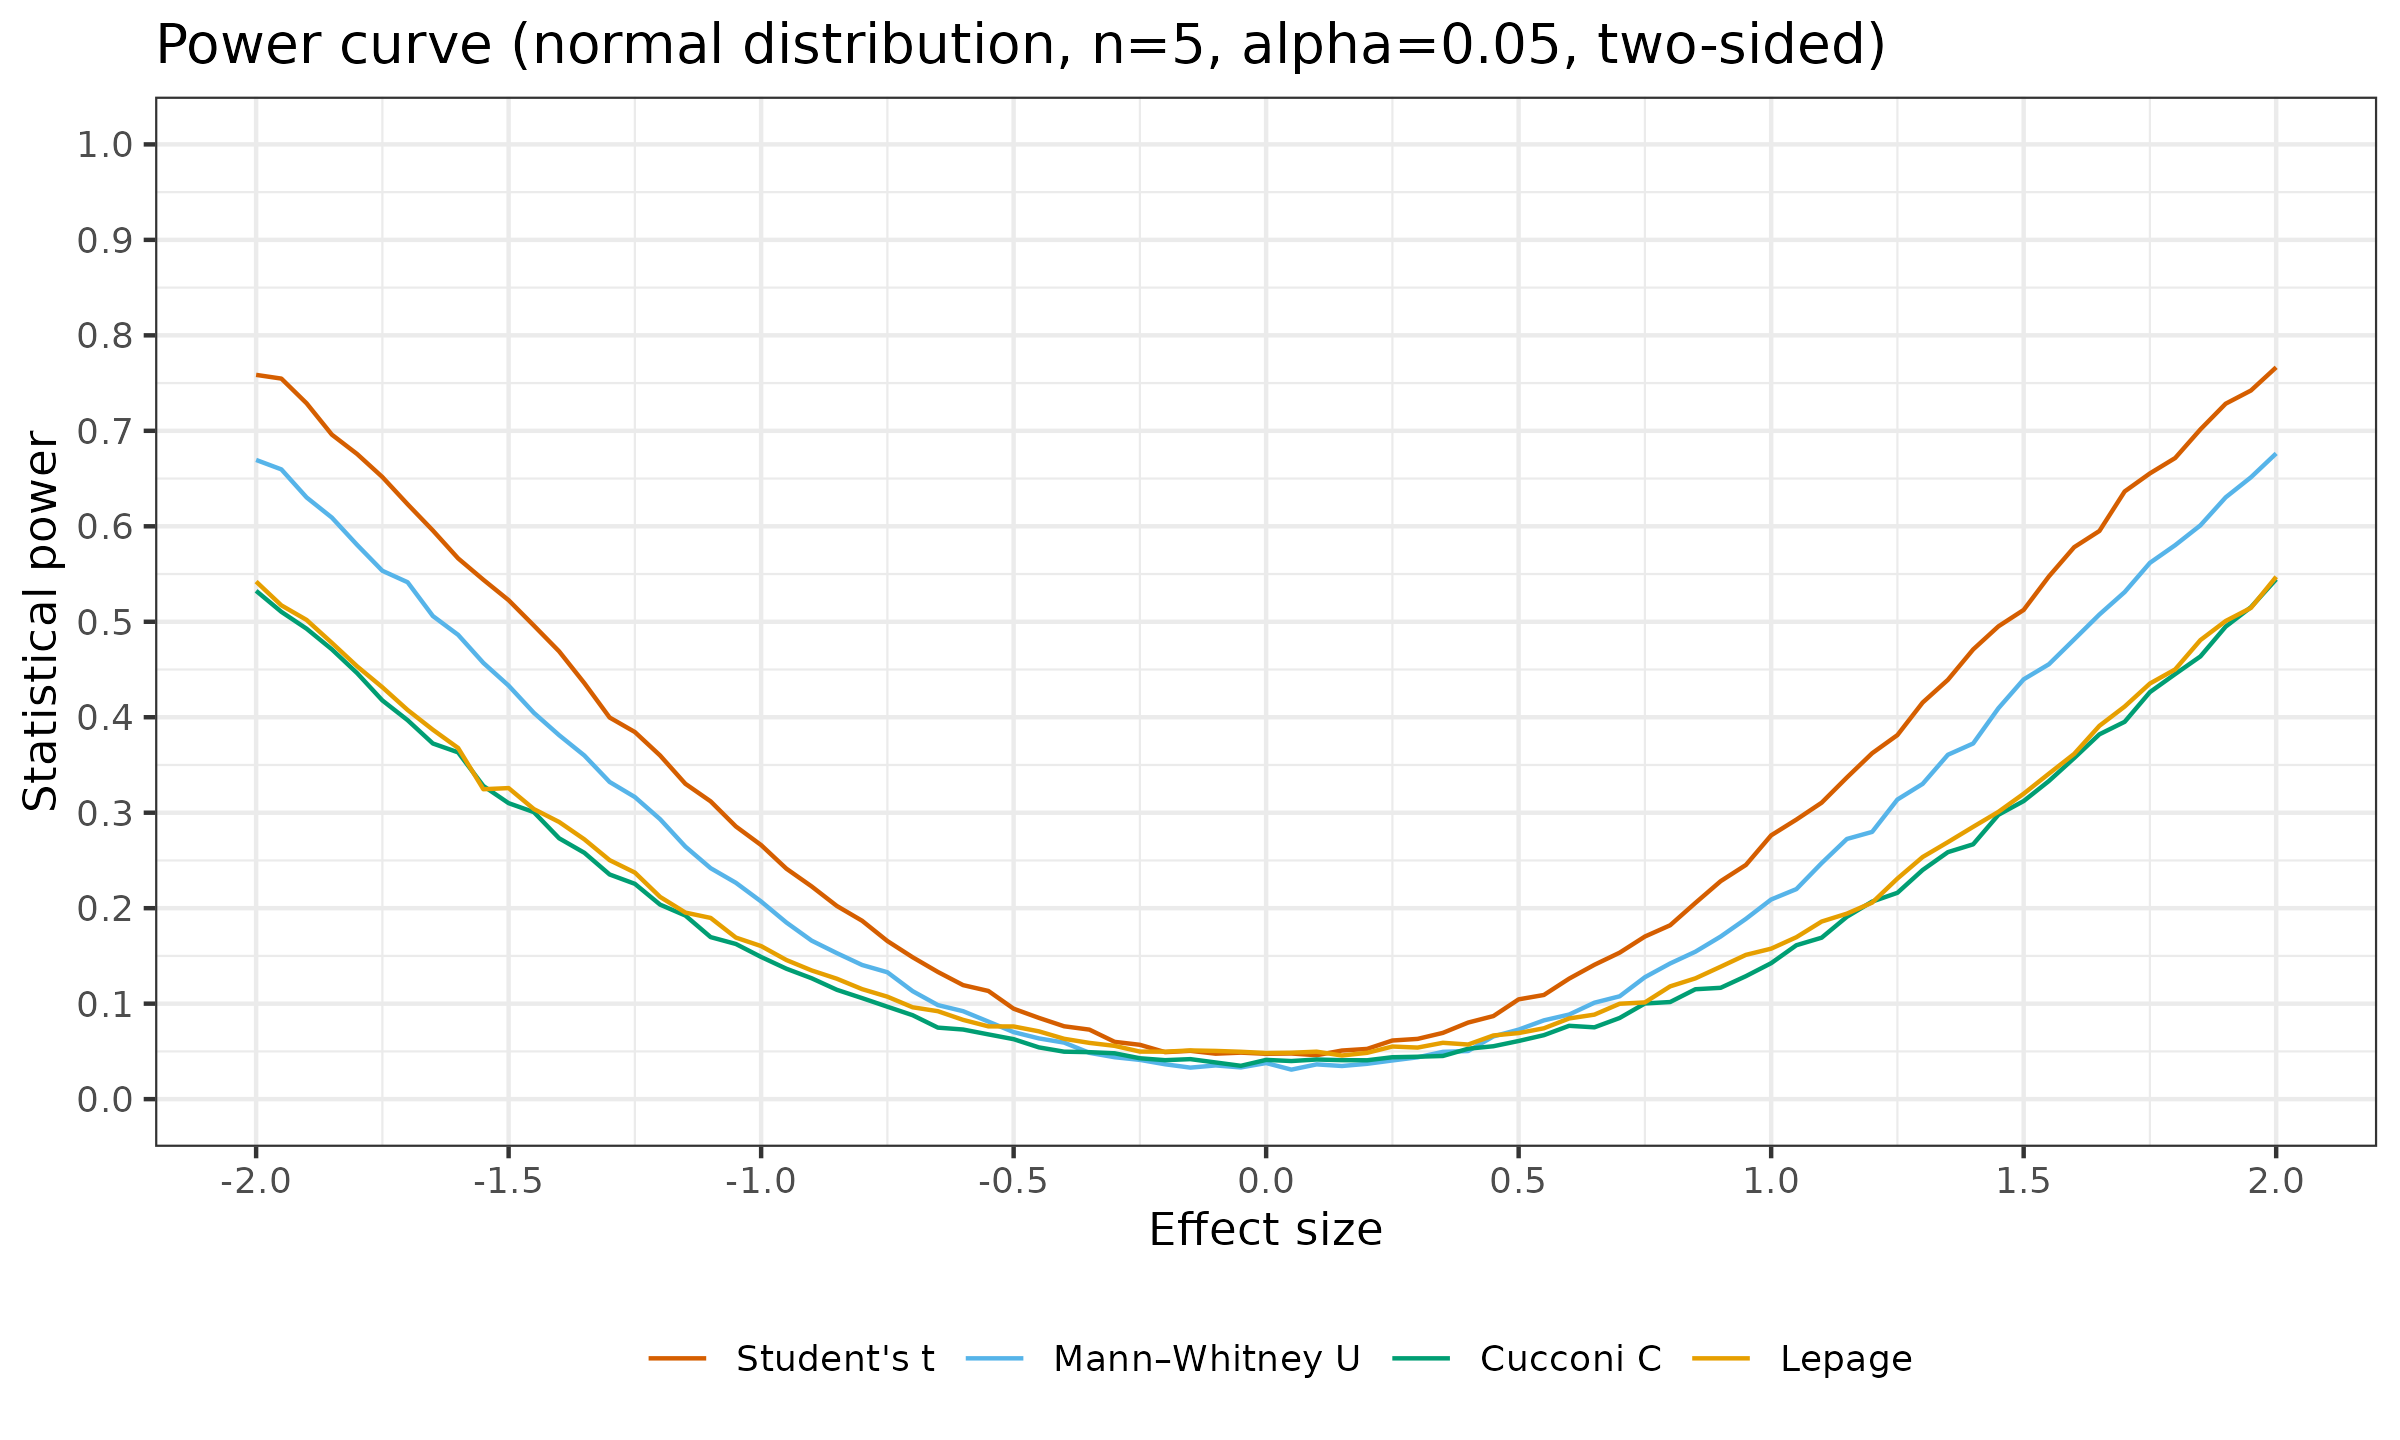
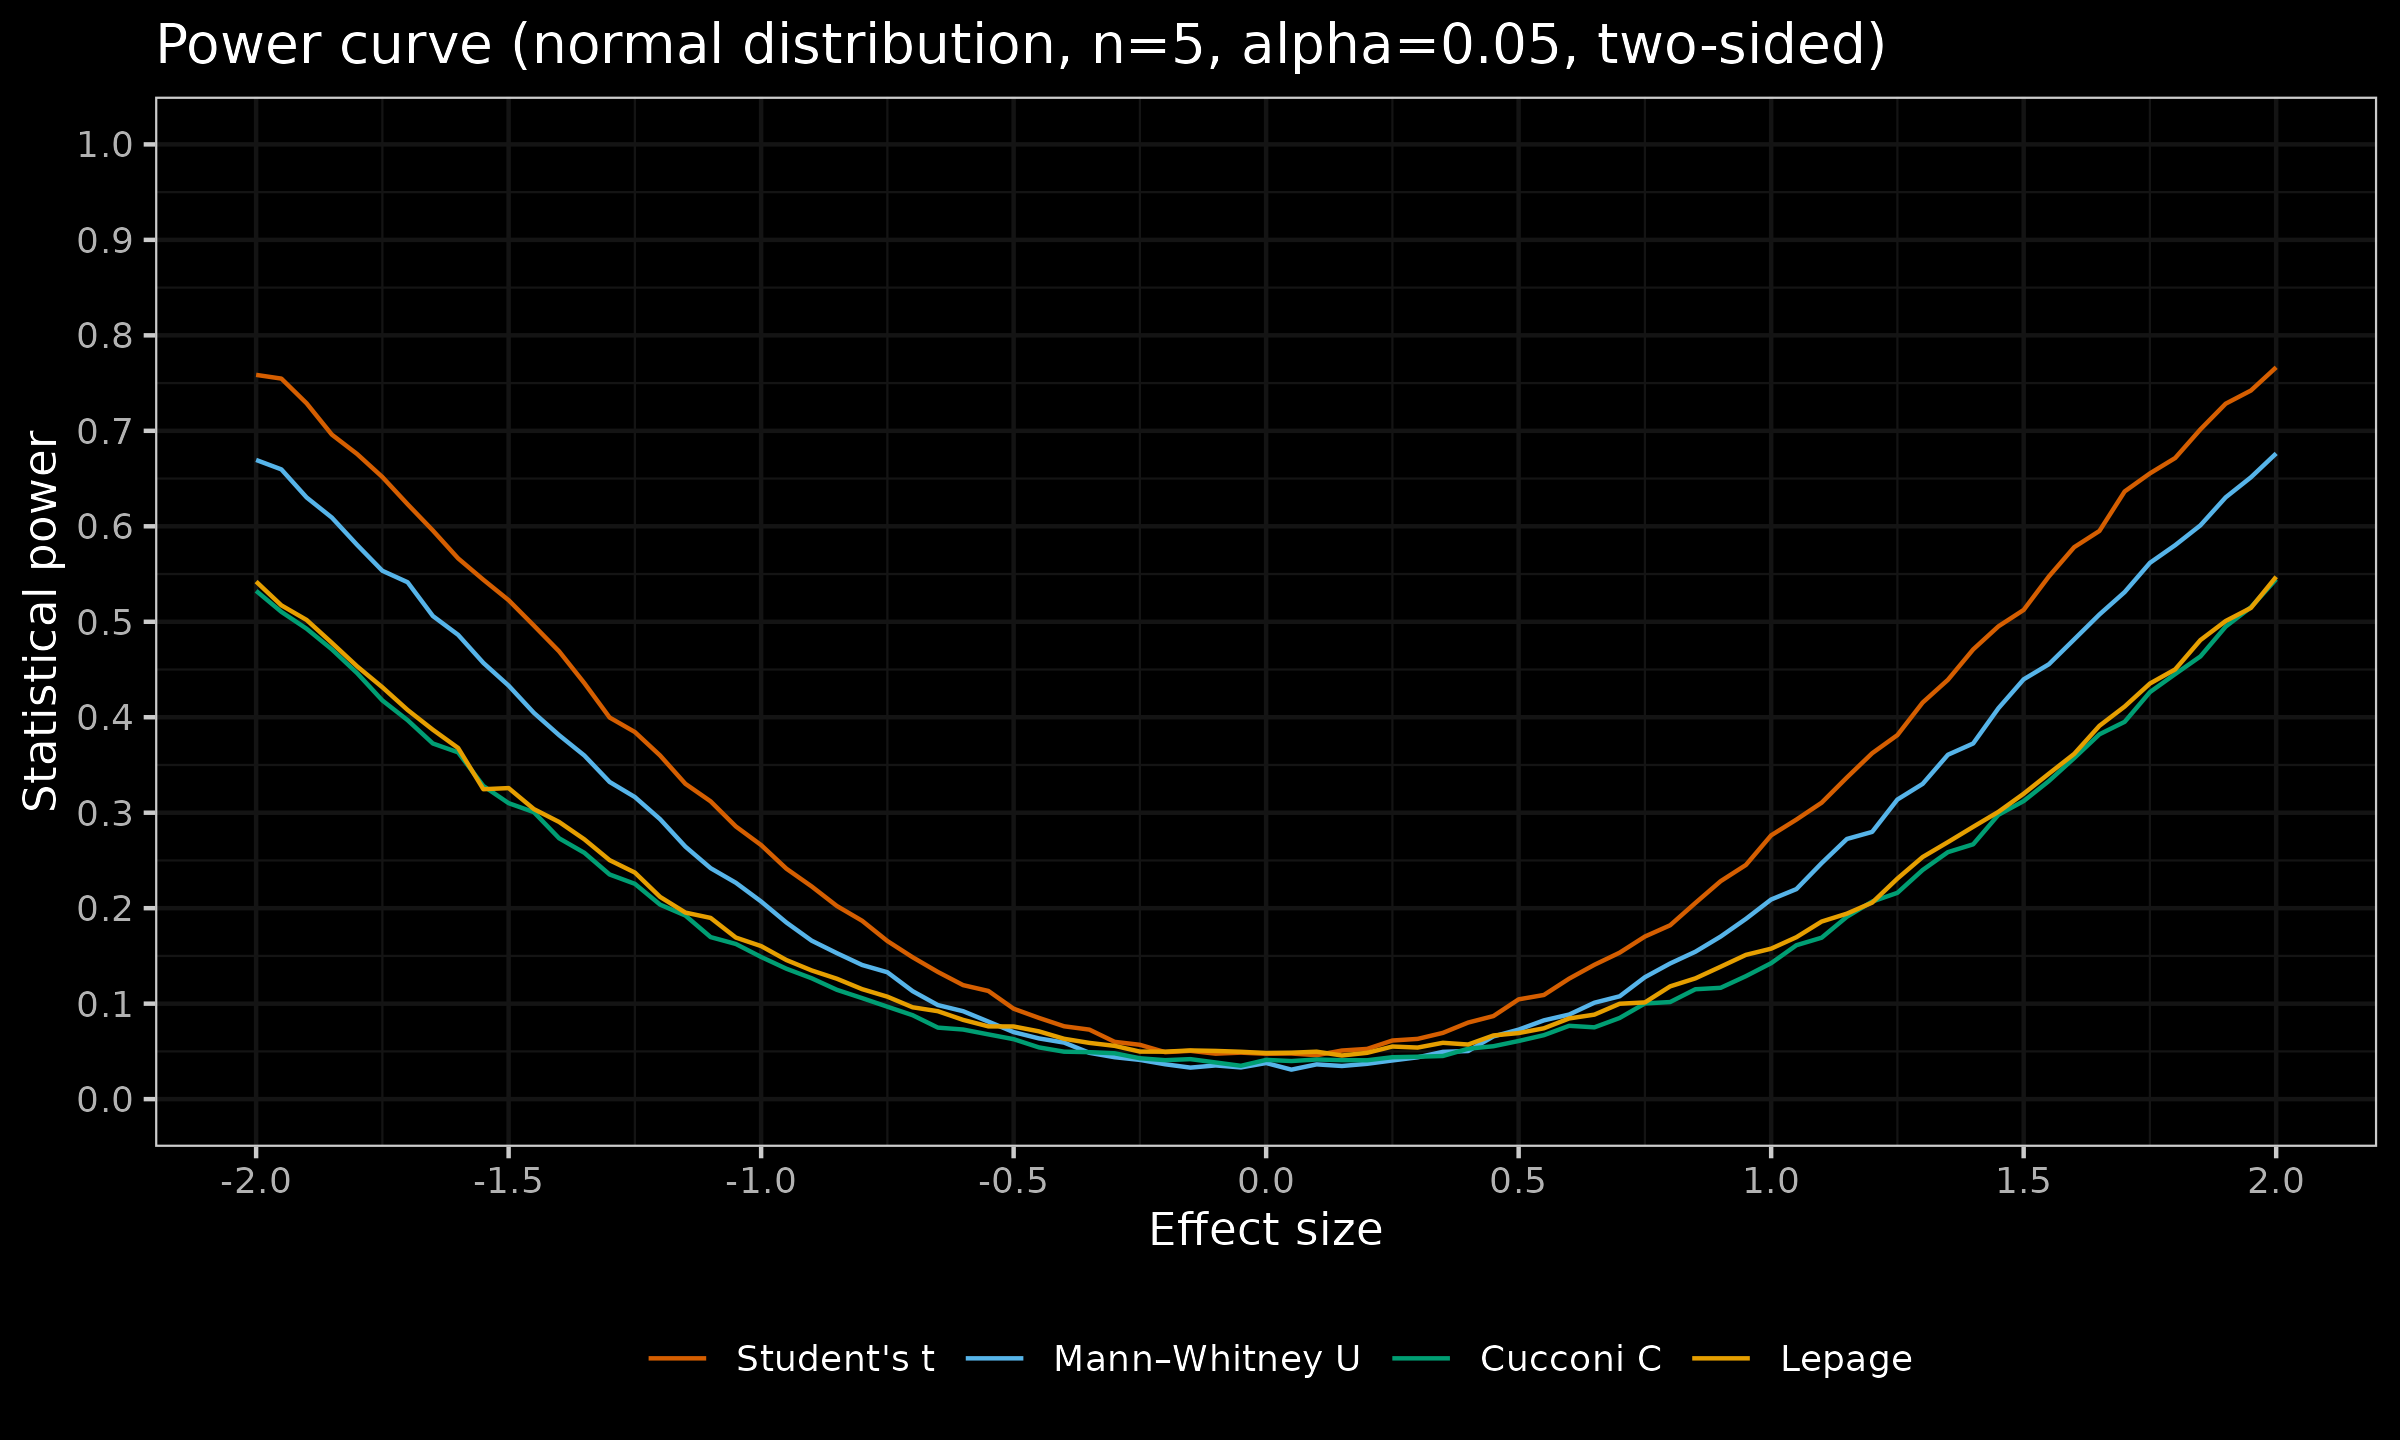
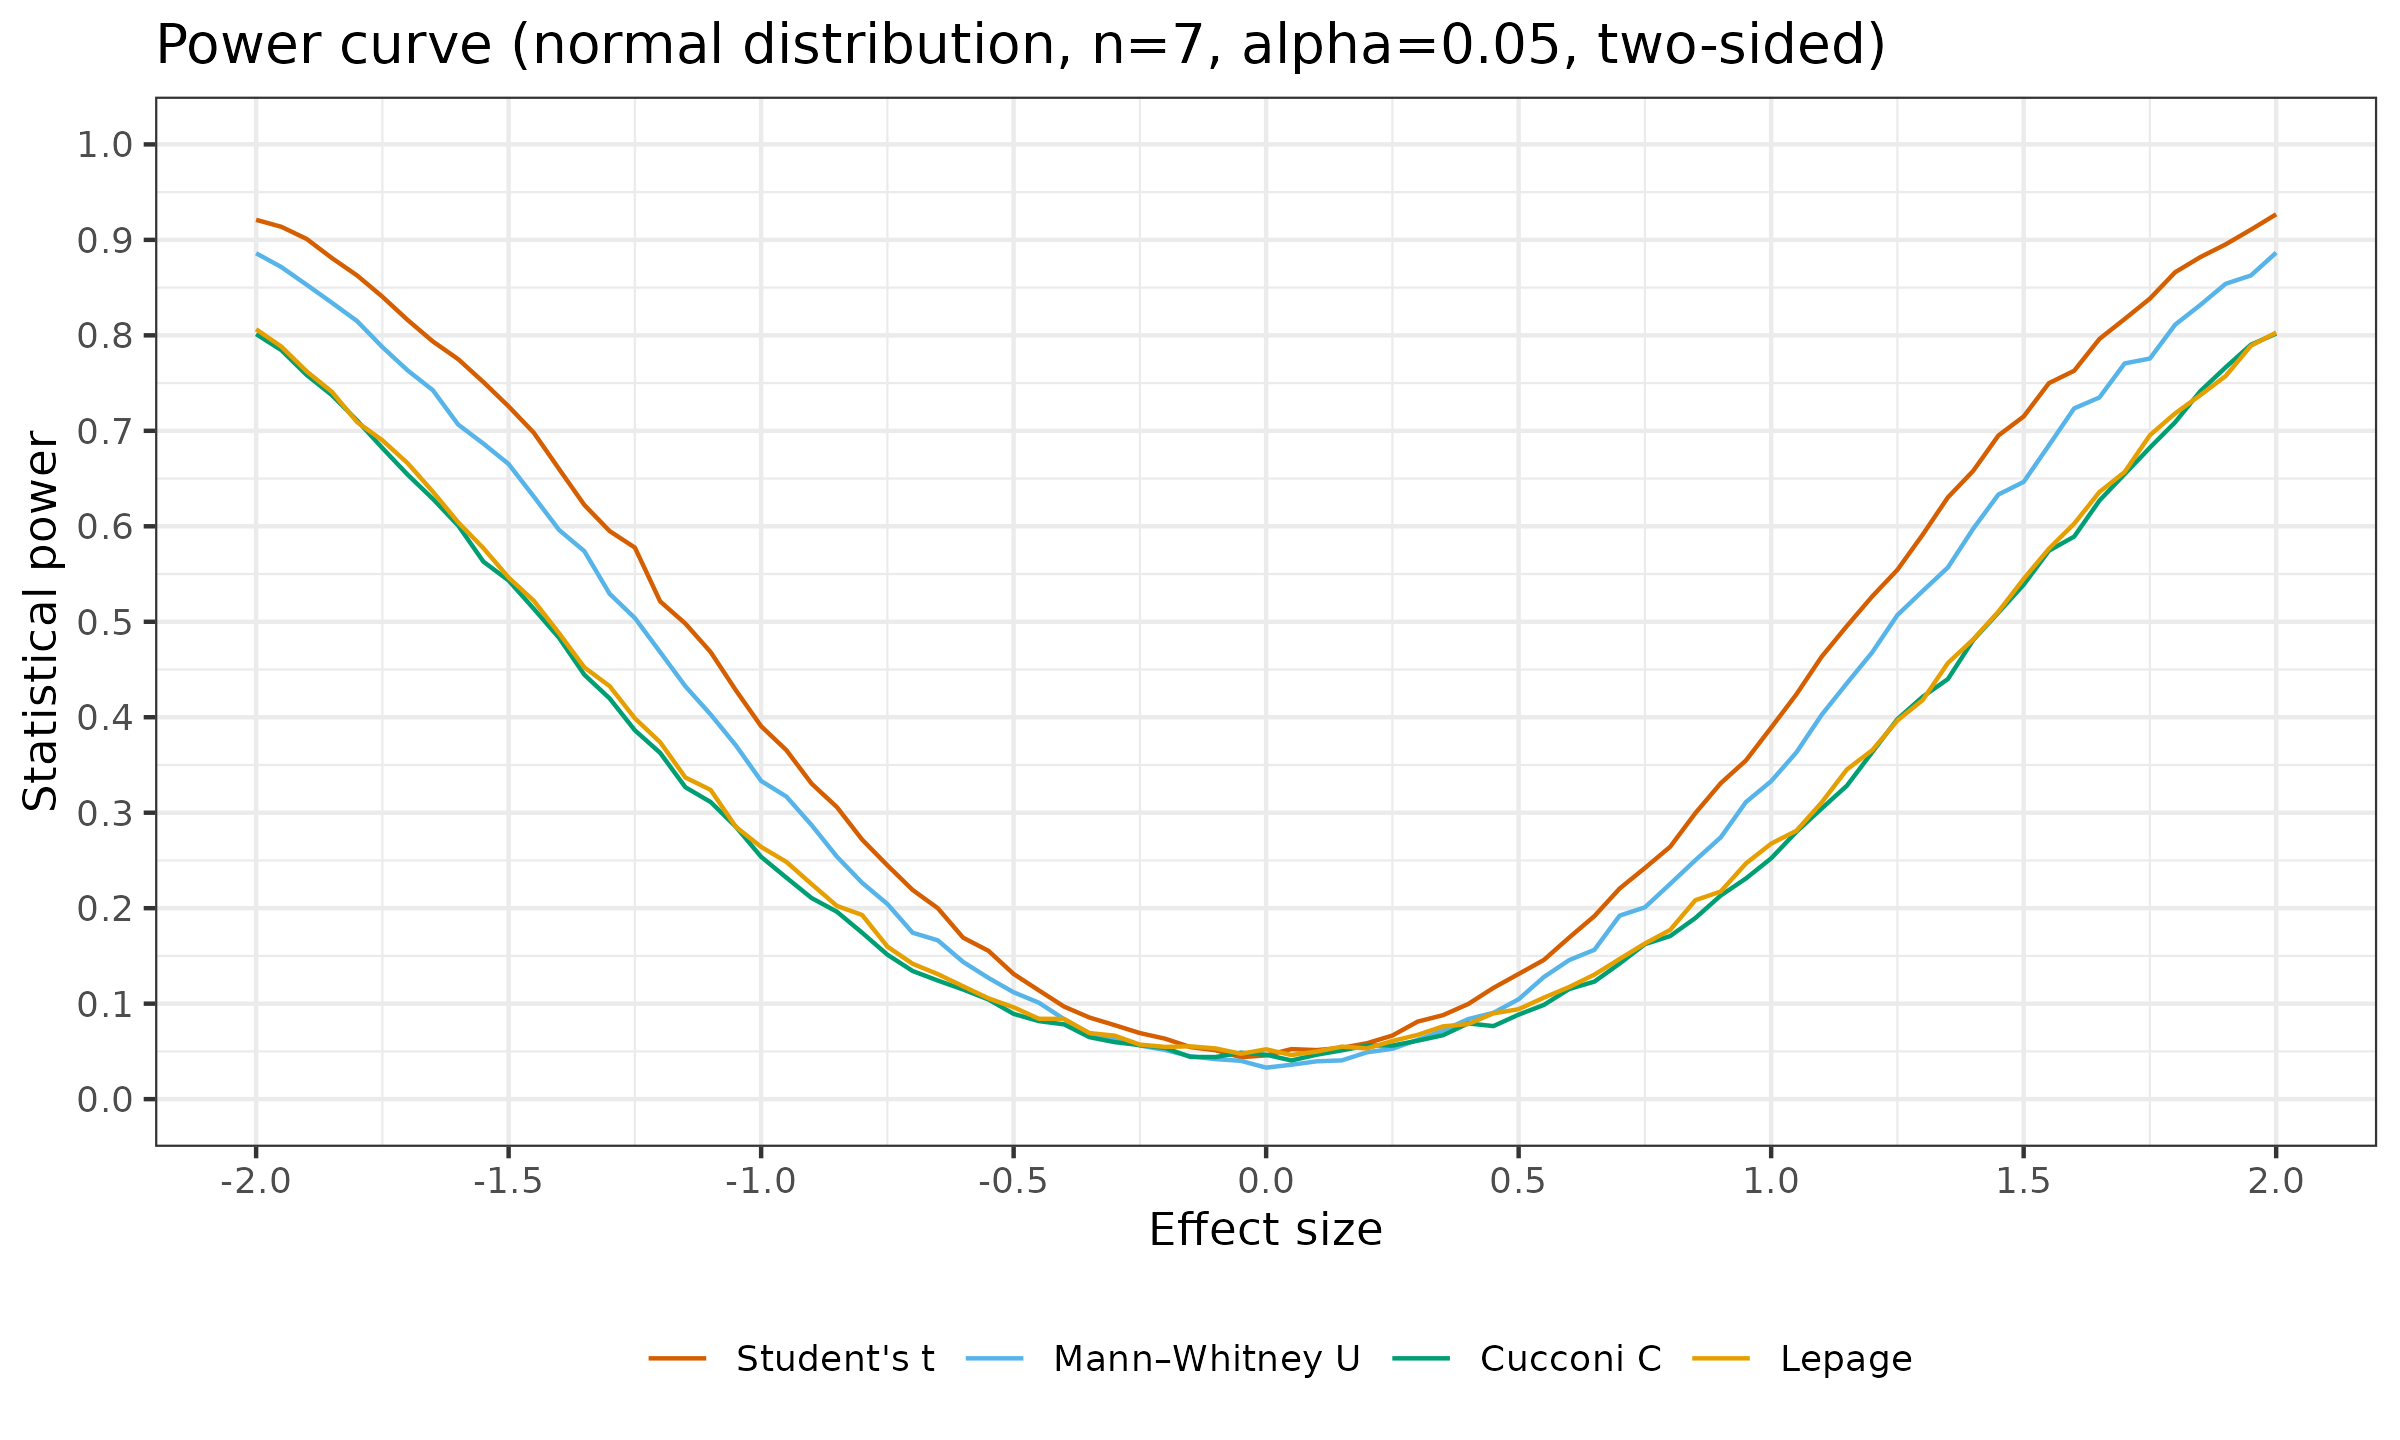
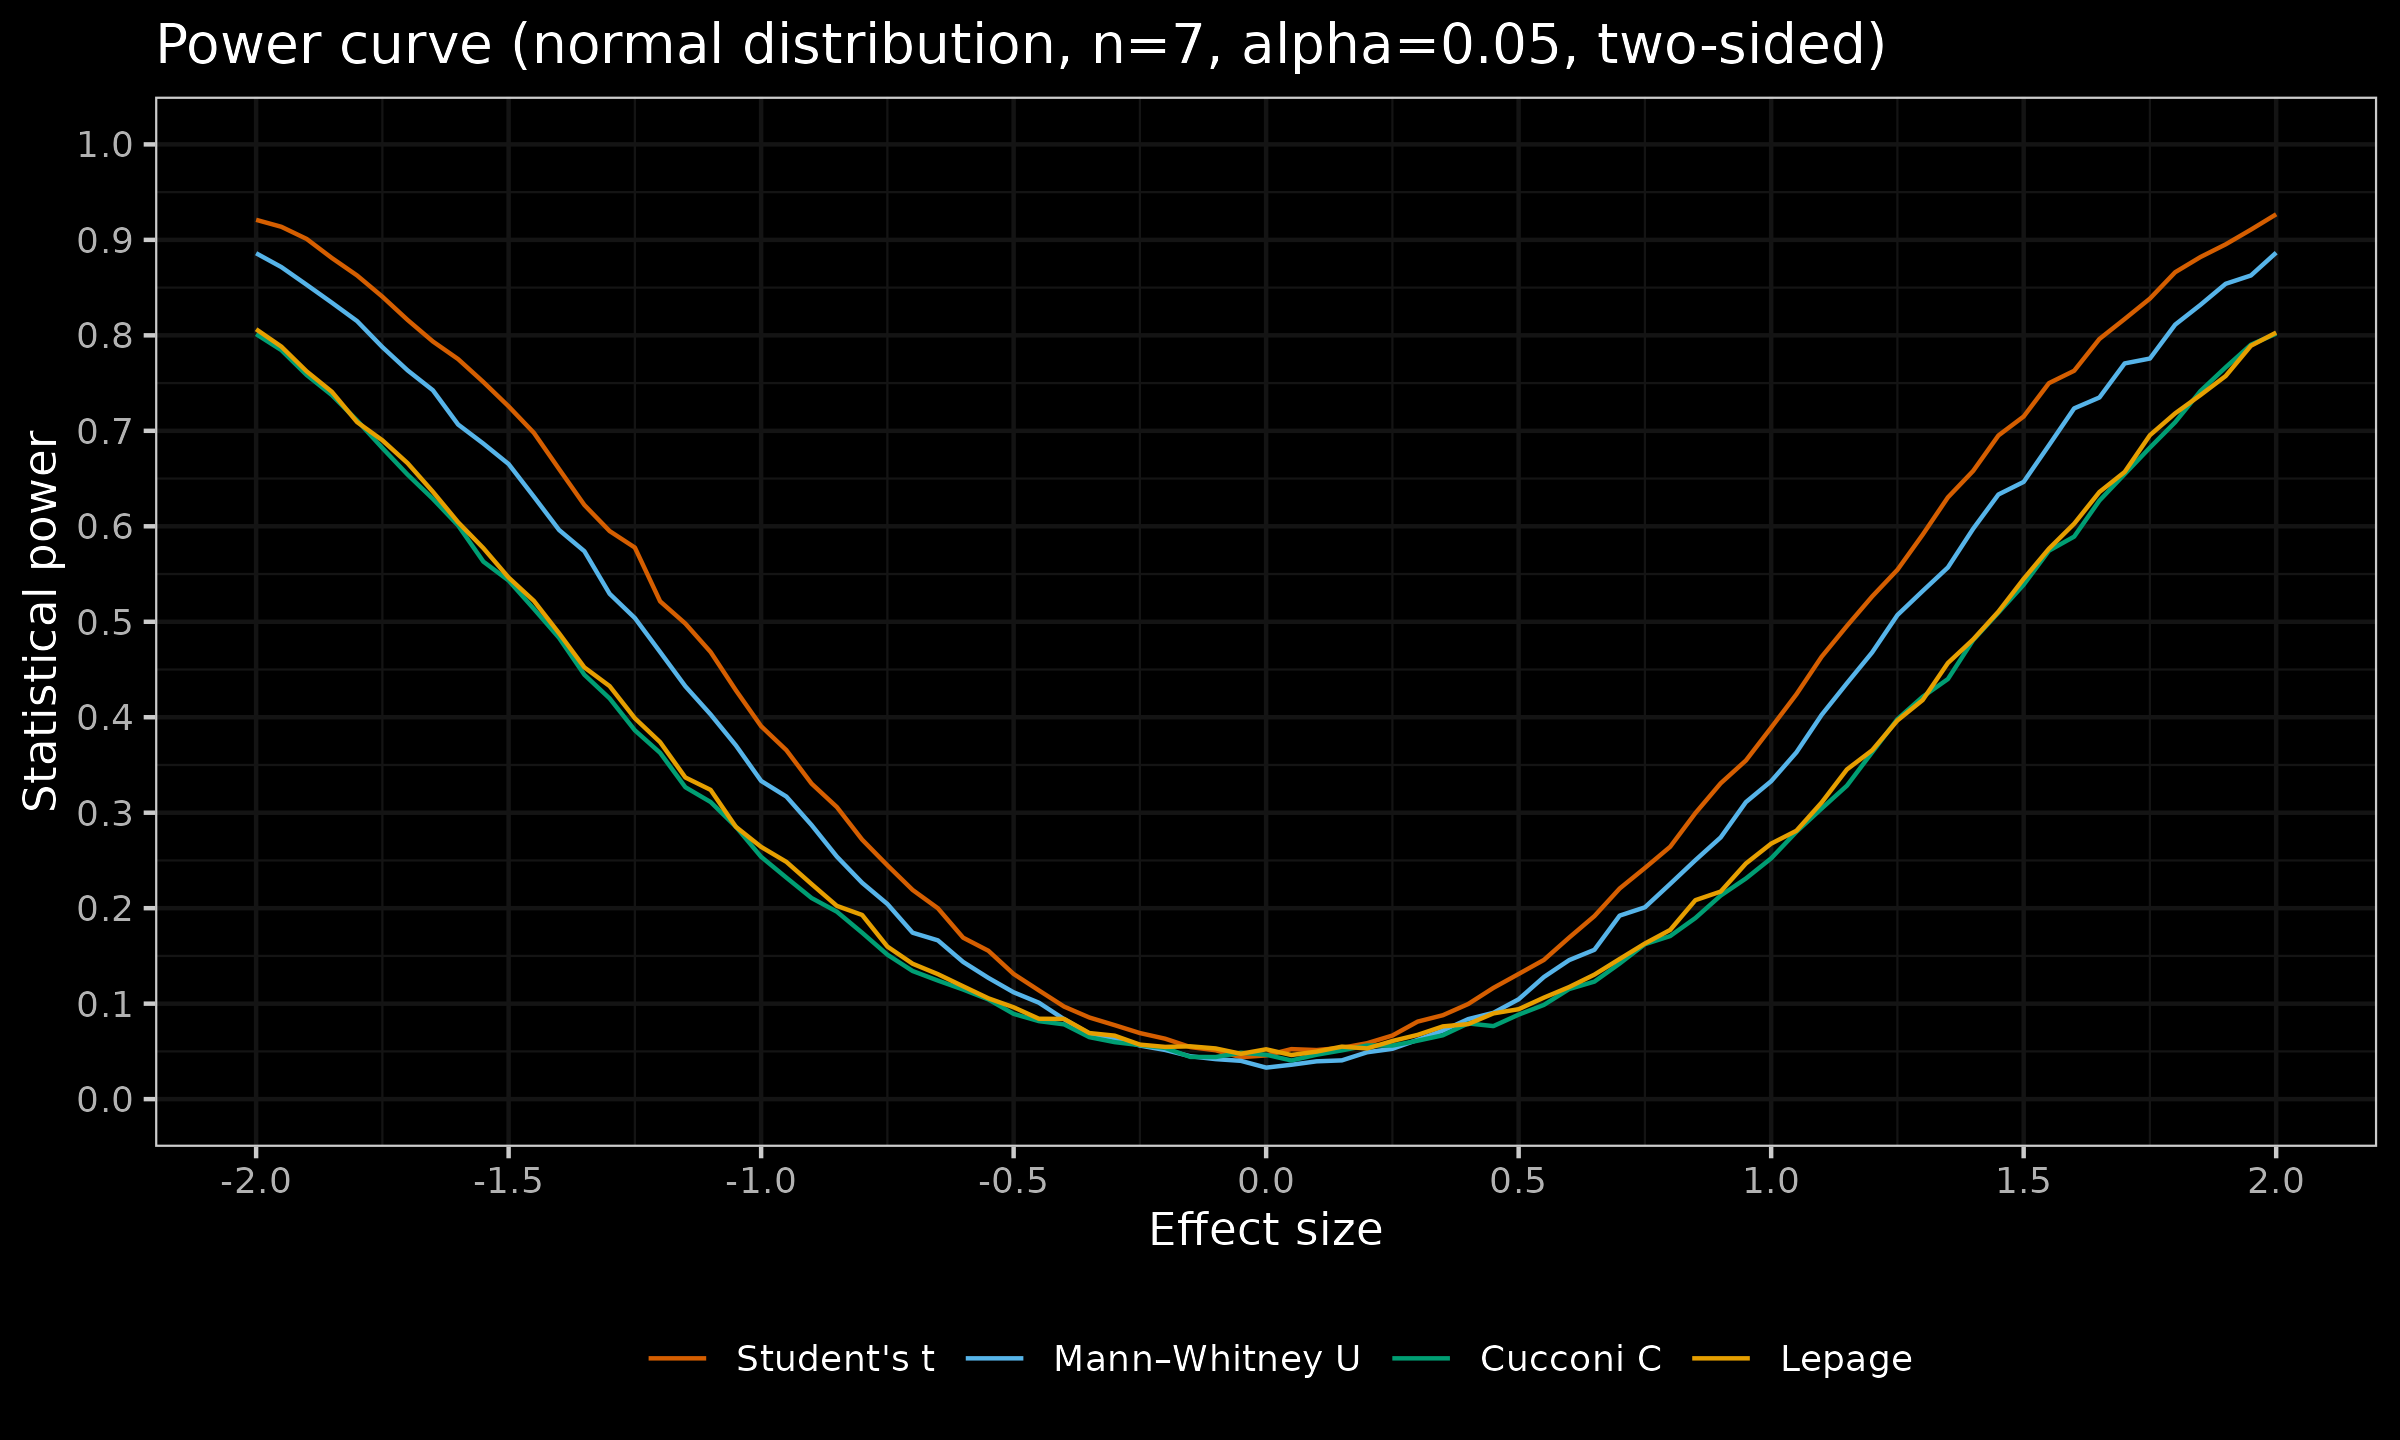
As we can see, in this simulation study, the Cucconi test and the Lepage test have approximately the same statistical power.
References
- [Lepage1971]
Lepage, Yves. “A combination of Wilcoxon’s and Ansari-Bradley’s statistics.” Biometrika 58, no. 1 (1971): 213-217.
DOI: 10.2307/2334333