Median absolute deviation vs. Shamos estimator
There are multiple ways to estimate statistical dispersion. The standard deviation is the most popular one, but it’s not robust: a single outlier could heavily corrupt the results. Fortunately, we have robust measures of dispersions like the median absolute deviation and the Shamos estimator. In this post, we perform numerical simulations and compare these two estimators on different distributions and sample sizes.
Definitions
For a sample $x = \{ x_1, x_2, \ldots, x_n \}$, the median absolute deviation ($\operatorname{MAD}$) and the Shamos EstimatorShamos Estimator are defined as follows:
$$ \operatorname{MAD}_n = C_n \cdot \operatorname{median}(|x - \operatorname{median}(x)|) $$$$ \operatorname{Shamos}_n = C_n \cdot \underset{i < j}{\operatorname{median}} (|x_i - x_j|) $$where $\operatorname{median}$ is a median estimator, $C_n$ is a scale factor.
In the scope of this post, we use the traditional sample median
(if $n$ is odd, the median is the middle element of the sorted sample,
if $n$ is even, the median is the arithmetic average of the two middle elements of the sorted sample).
The $C_n$ scale factors allow using $\operatorname{MAD}$ and $\operatorname{Shamos}$ consistent estimators
for the standard deviation under the normal distribution.
The corresponding values of $C_n$ for both dispersion estimators could be found in Investigation of finite-sample properties of robust location and scale estimators
By Chanseok Park, Haewon Kim, Min Wang
·
2020park2020.
Simulation study
Let’s perform the following experiment:
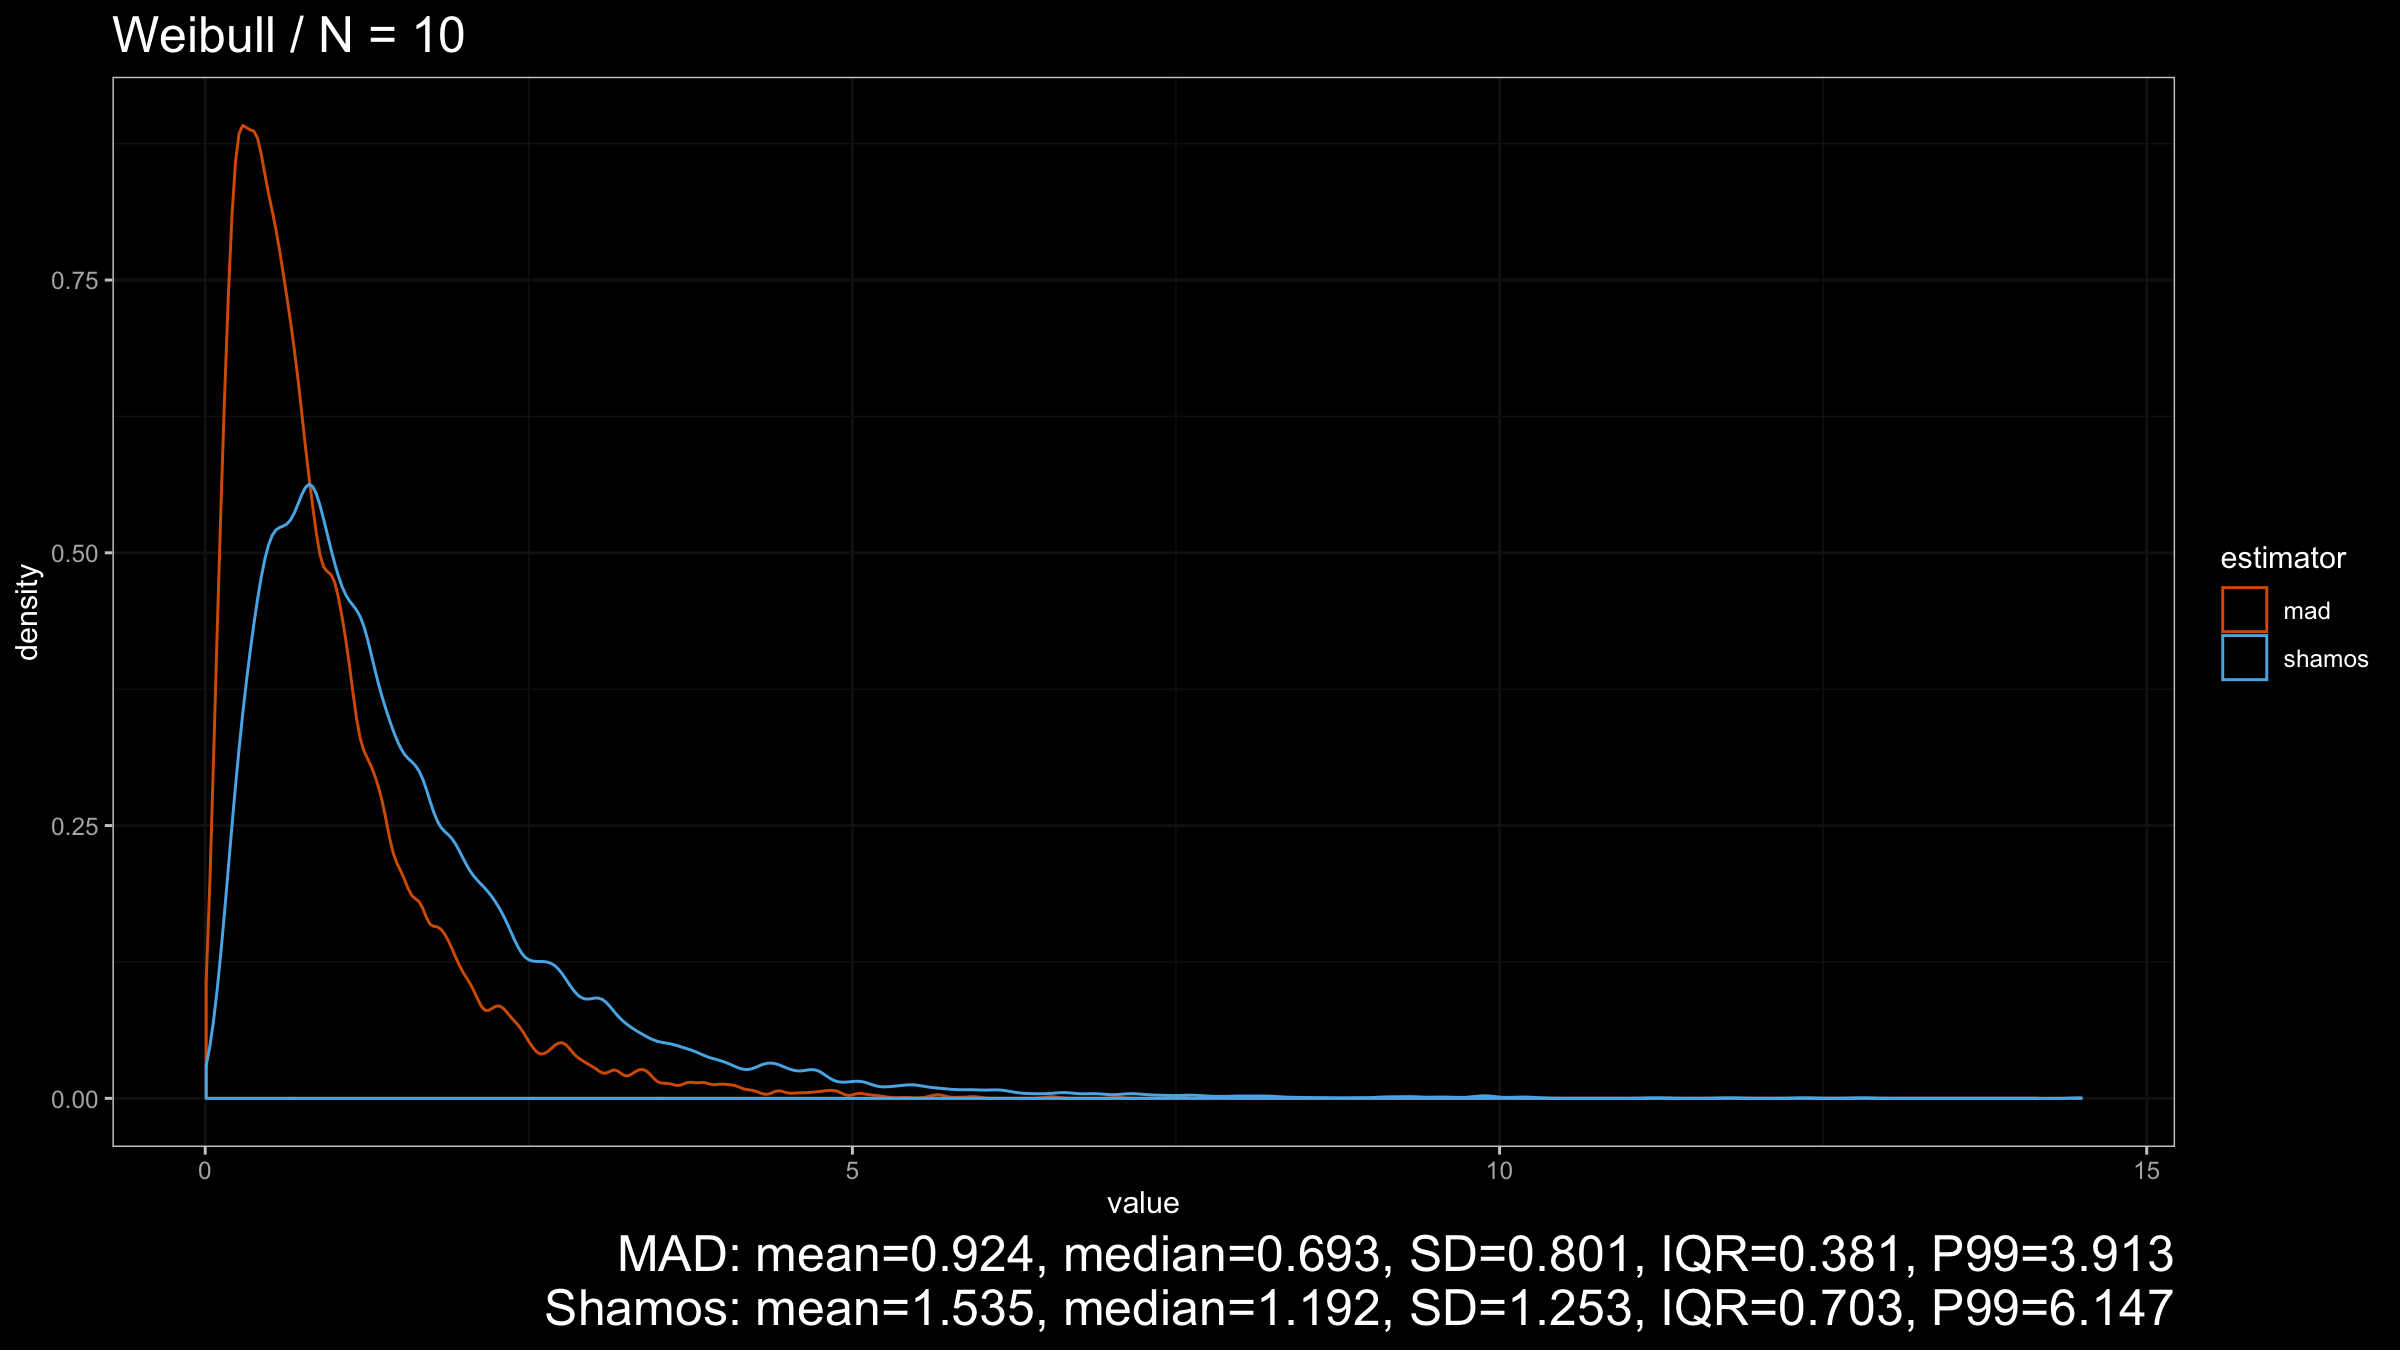
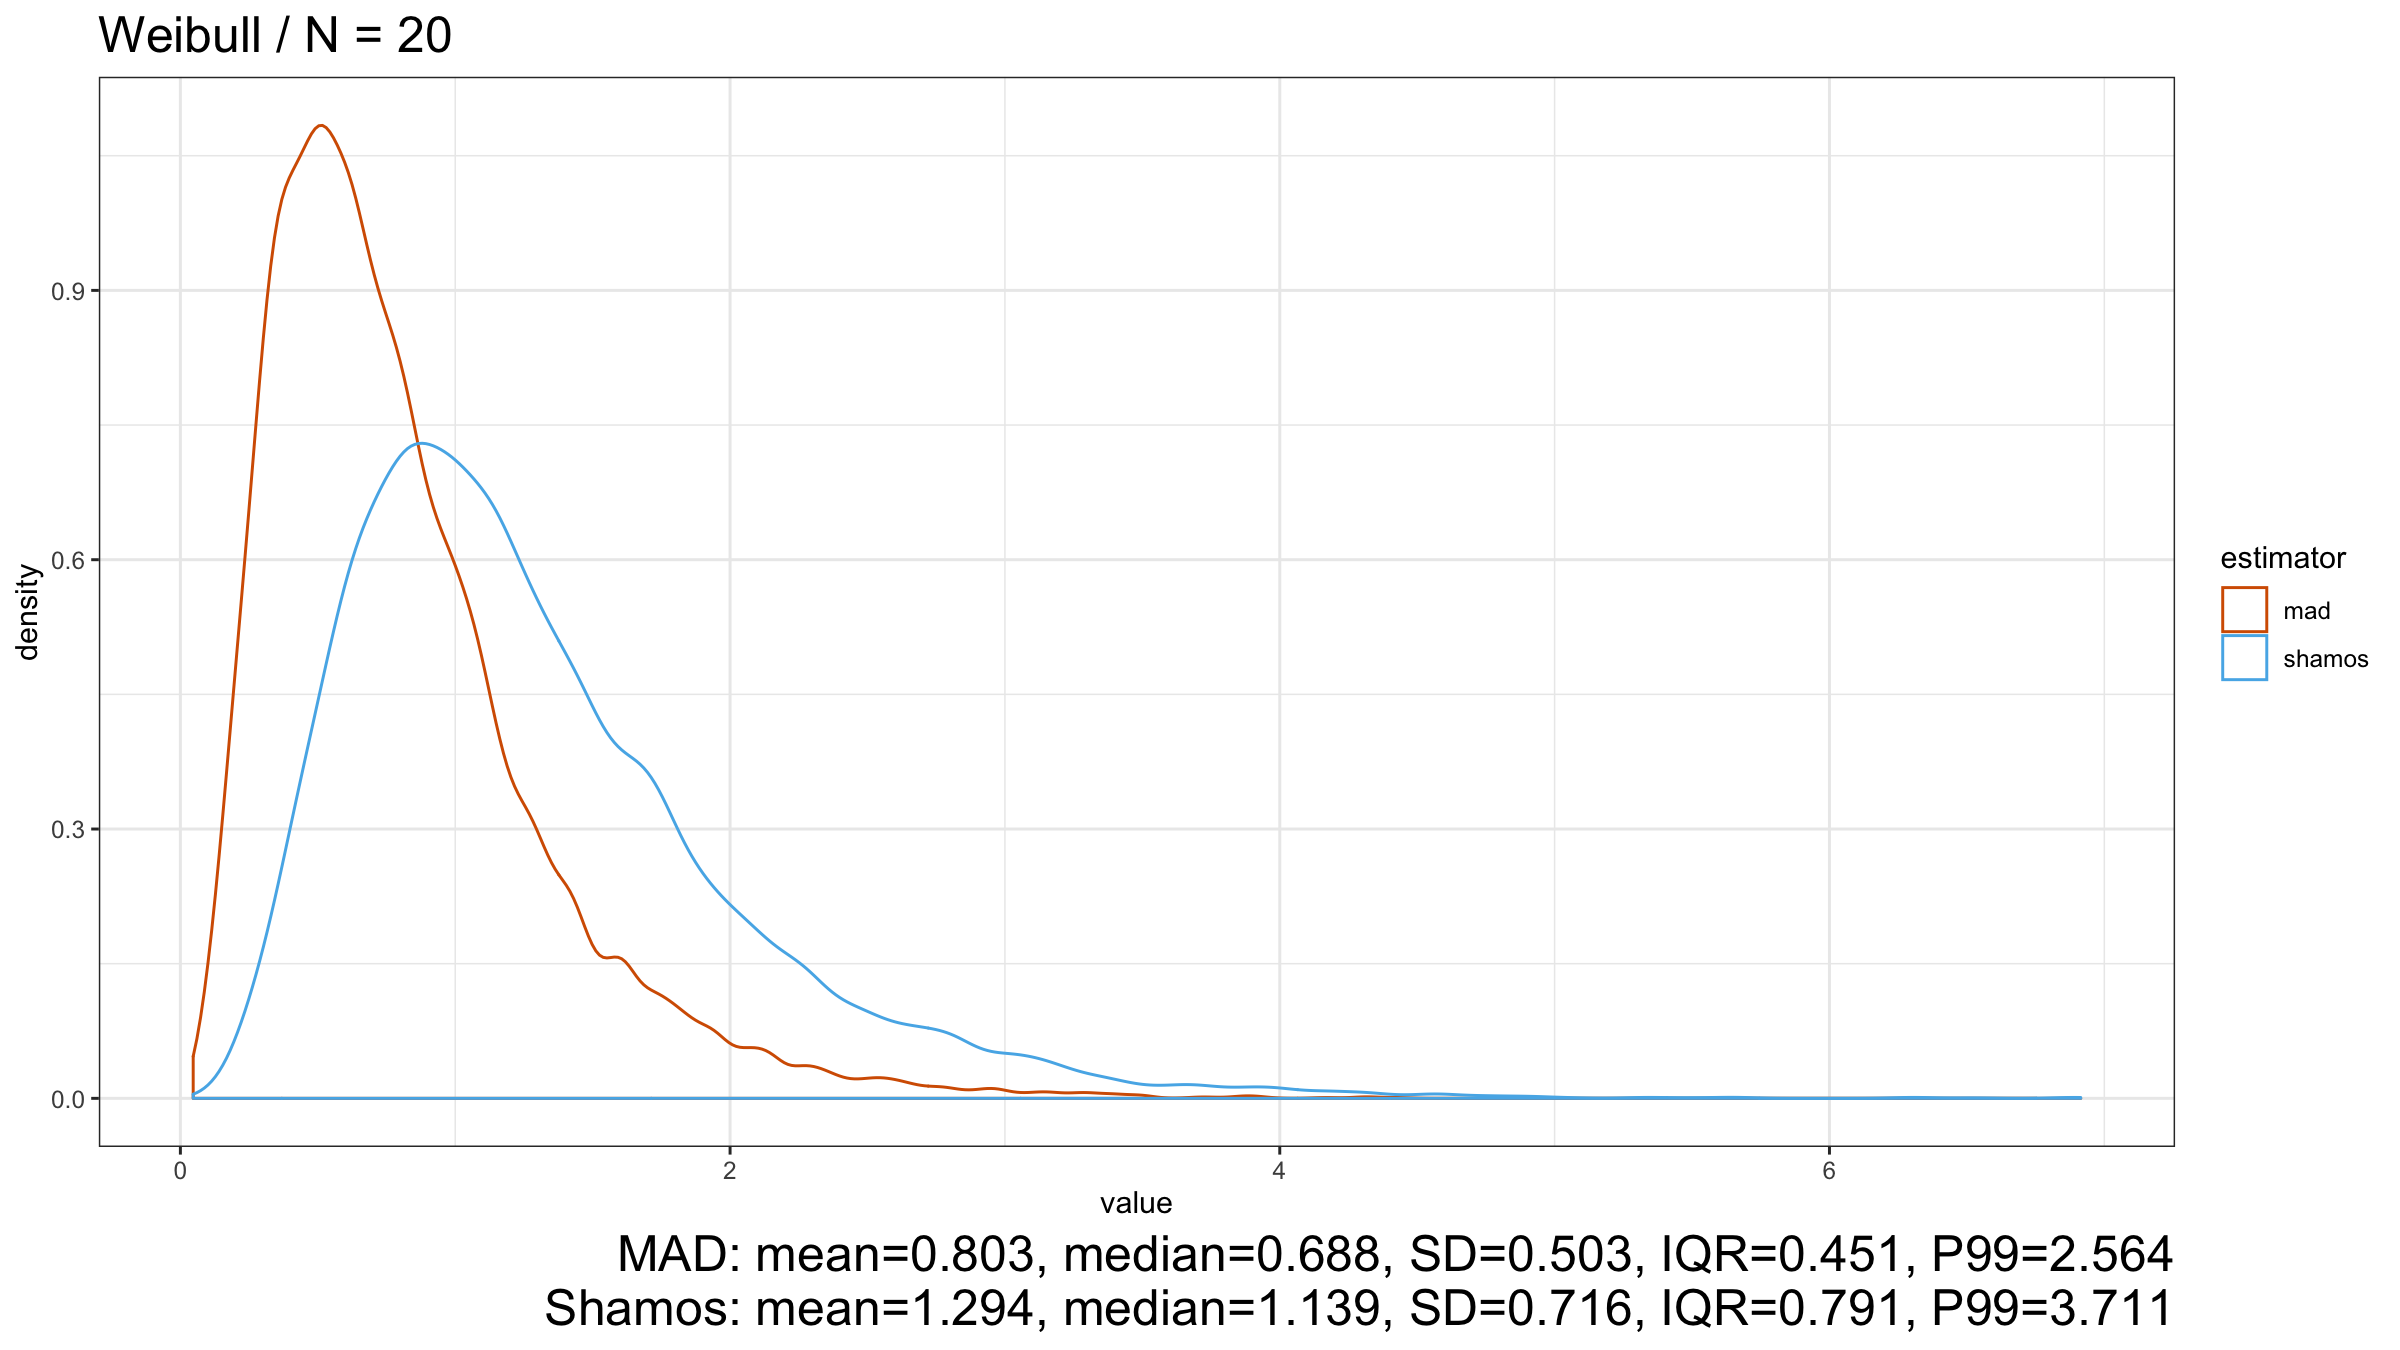
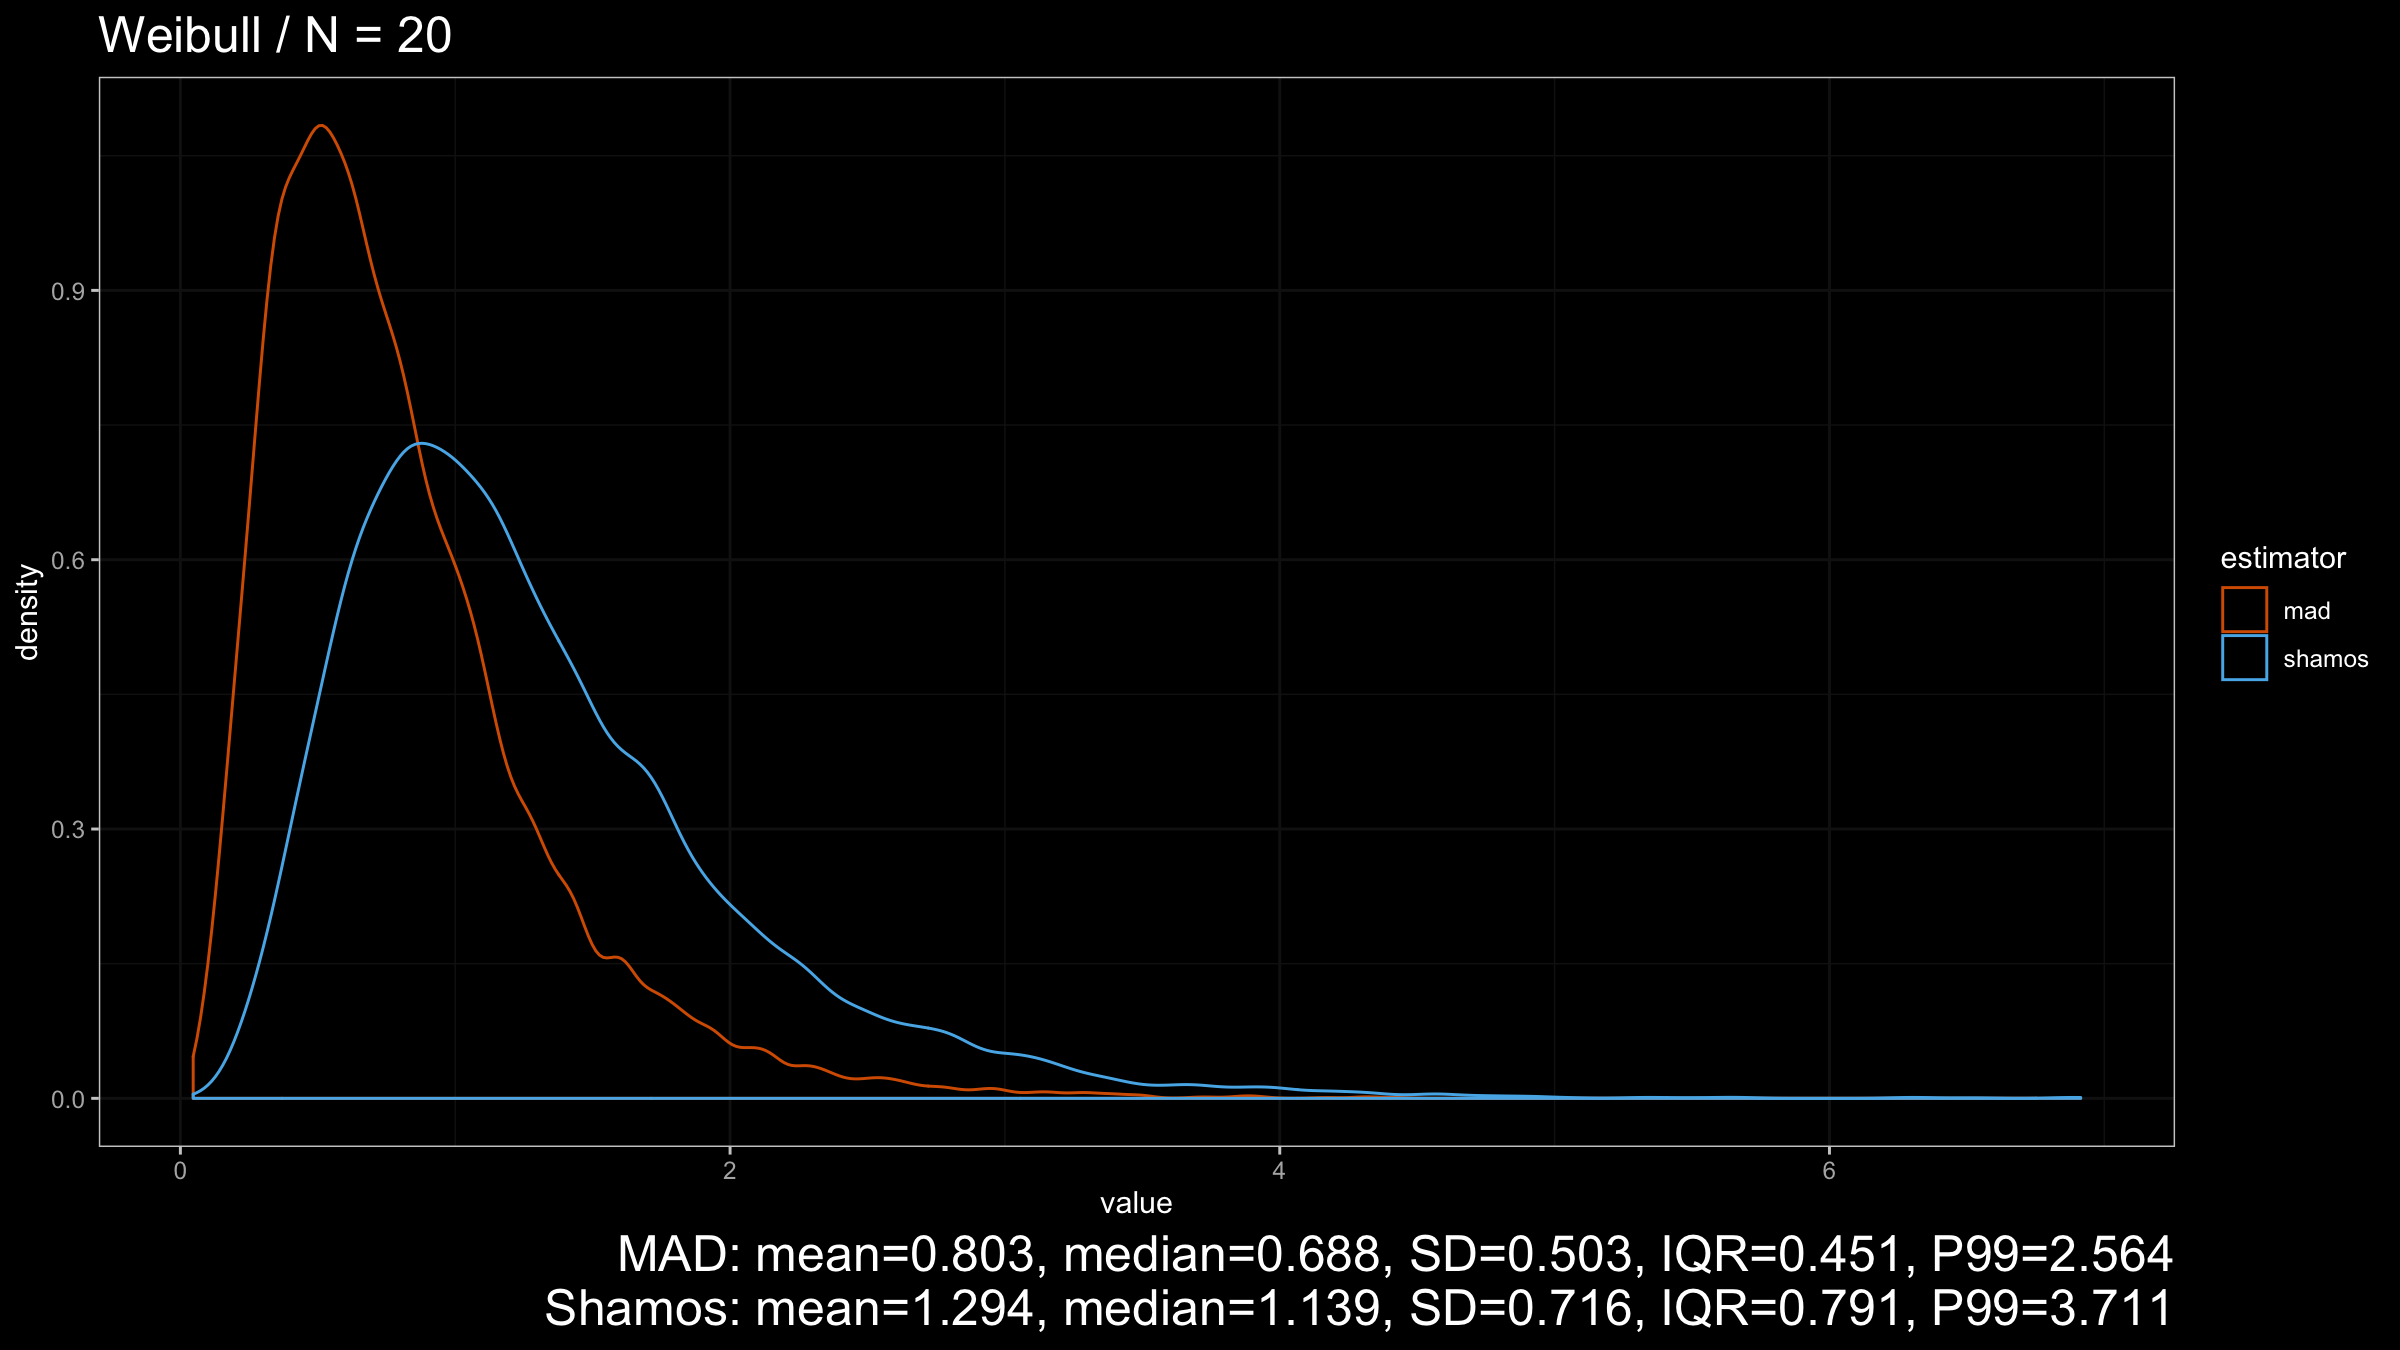
- Enumerate different distributions: the standard Normal distribution (light-tailed), the standard Gumbel distribution (light-tailed), the standard Cauchy distribution (heavy-tailed), the Frechet distribution with shape = 1 (heavy-tailed), and the Weibull distribution with shape = 0.5 (heavy-tailed.)
- Enumerate different sample sizes: 5, 10, 20.
- For each combination of the parameters, we generate $10\,000$ random samples from the given distribution of the given size, and calculate the $\operatorname{MAD}$ and $\operatorname{Shamos}$ estimations. For each group of estimations, we draw a density plot (the Sheather & Jones method, the normal kernel) and calculate some summary statistics: the mean, the median, the standard deviation (SD), the interquartile range (IQR), the $99^\textrm{th}$ percentile (P99).
Let’s start with the Normal distribution:

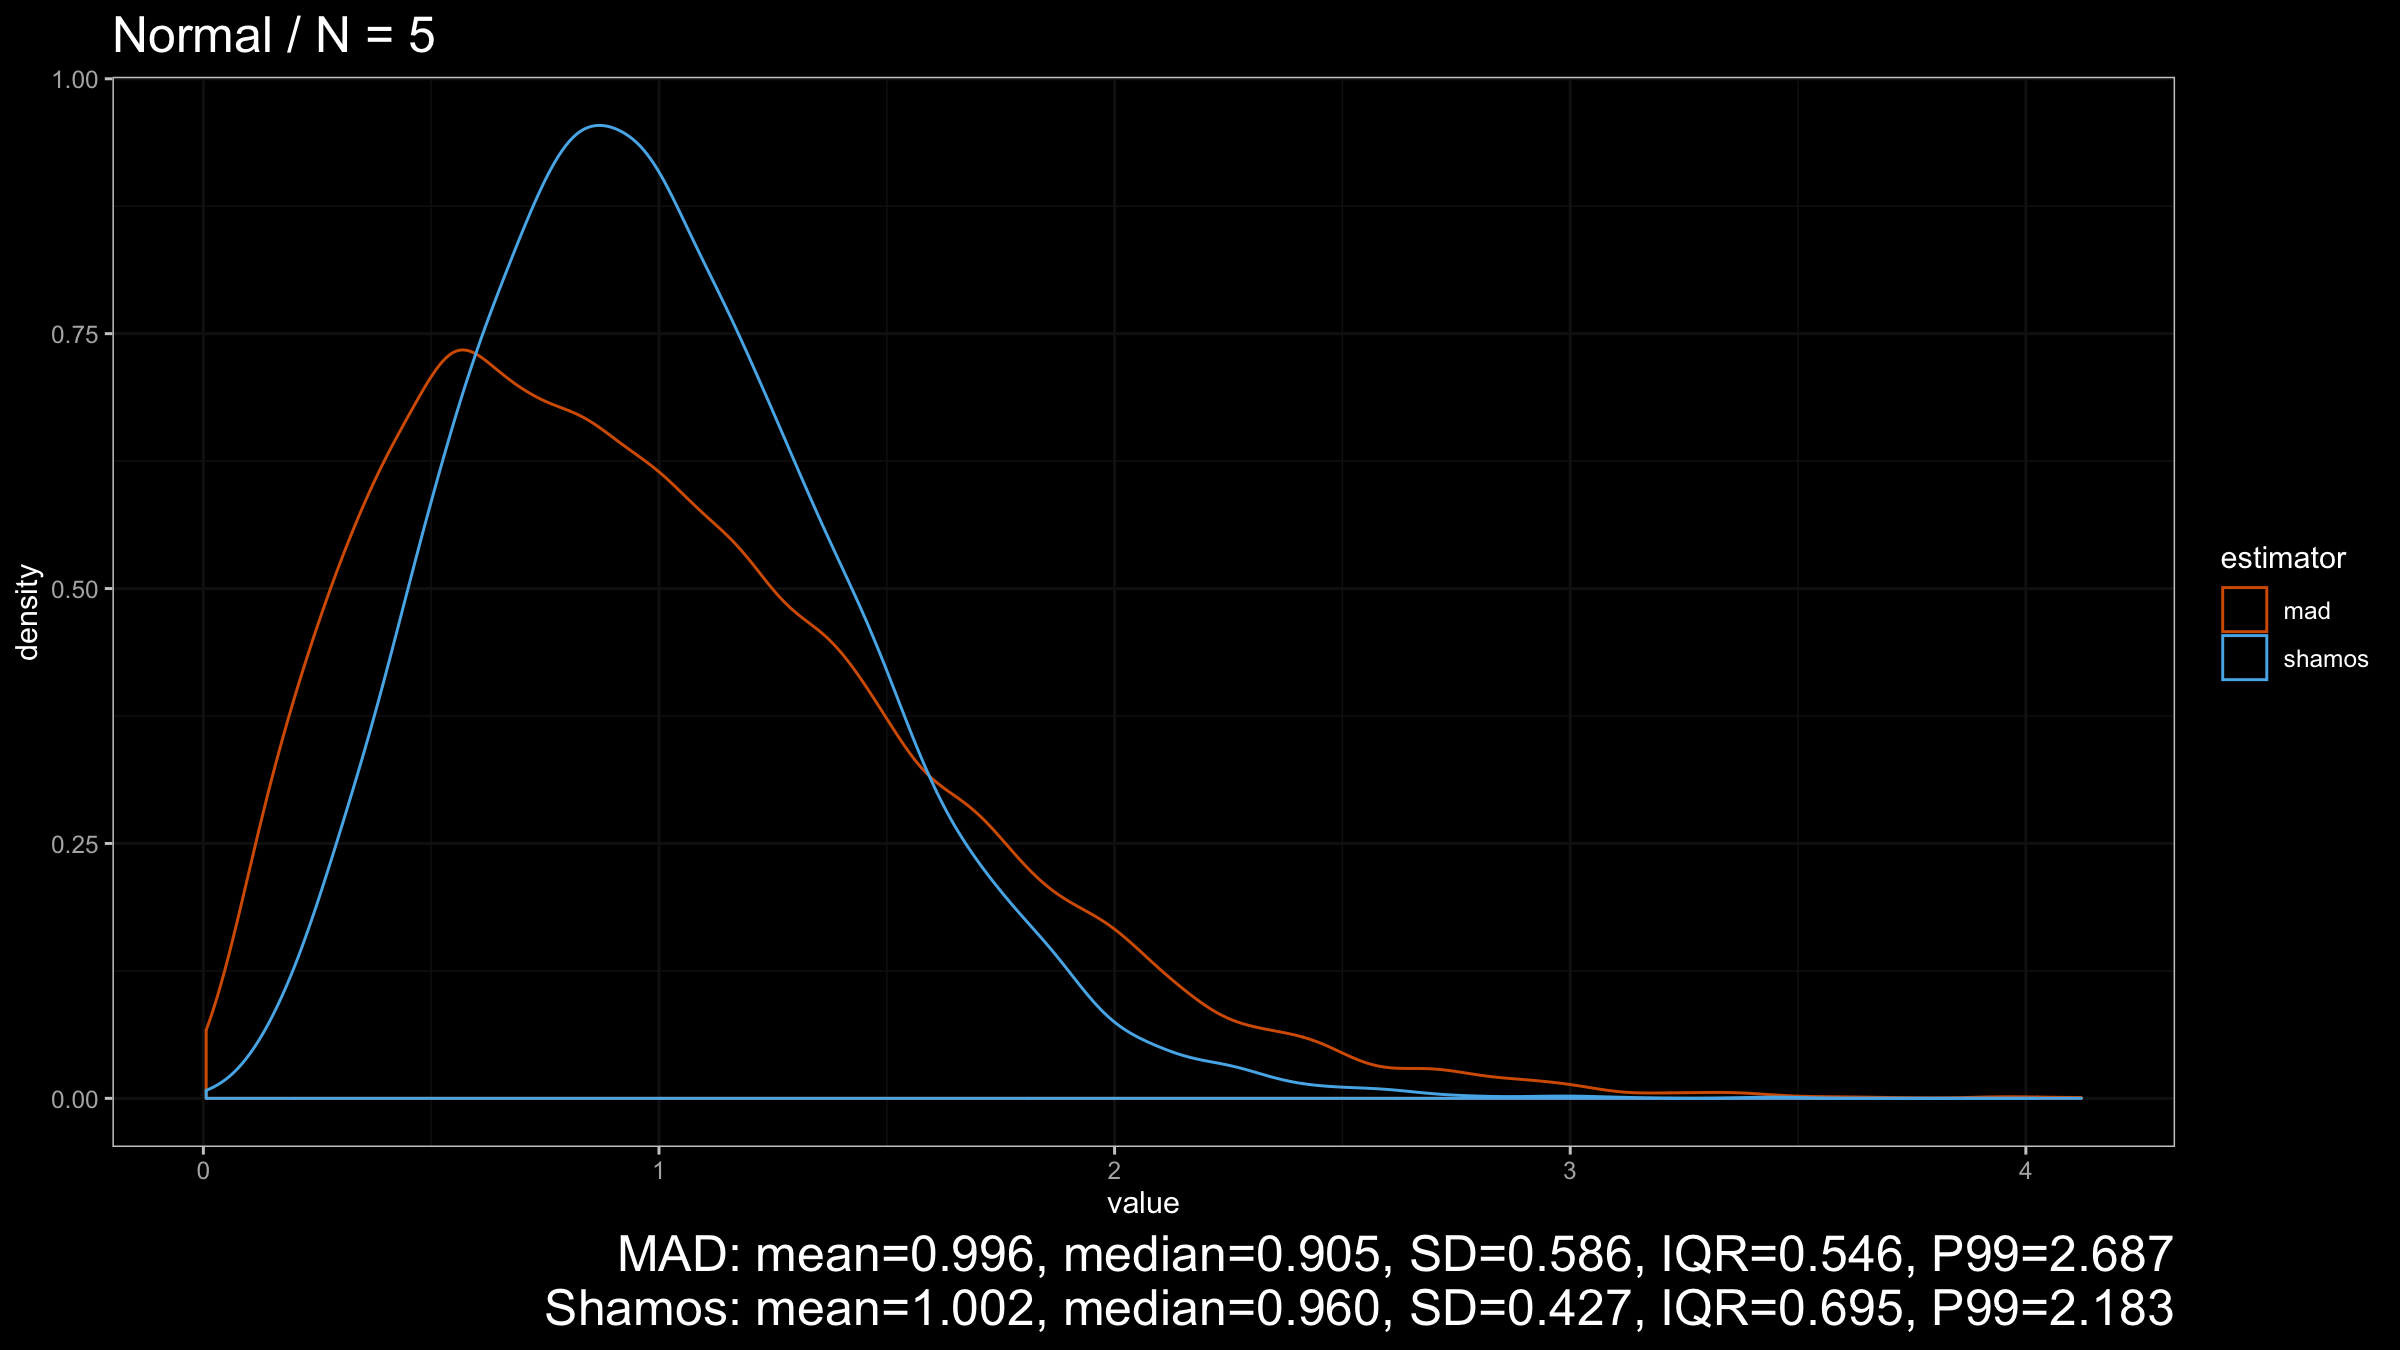
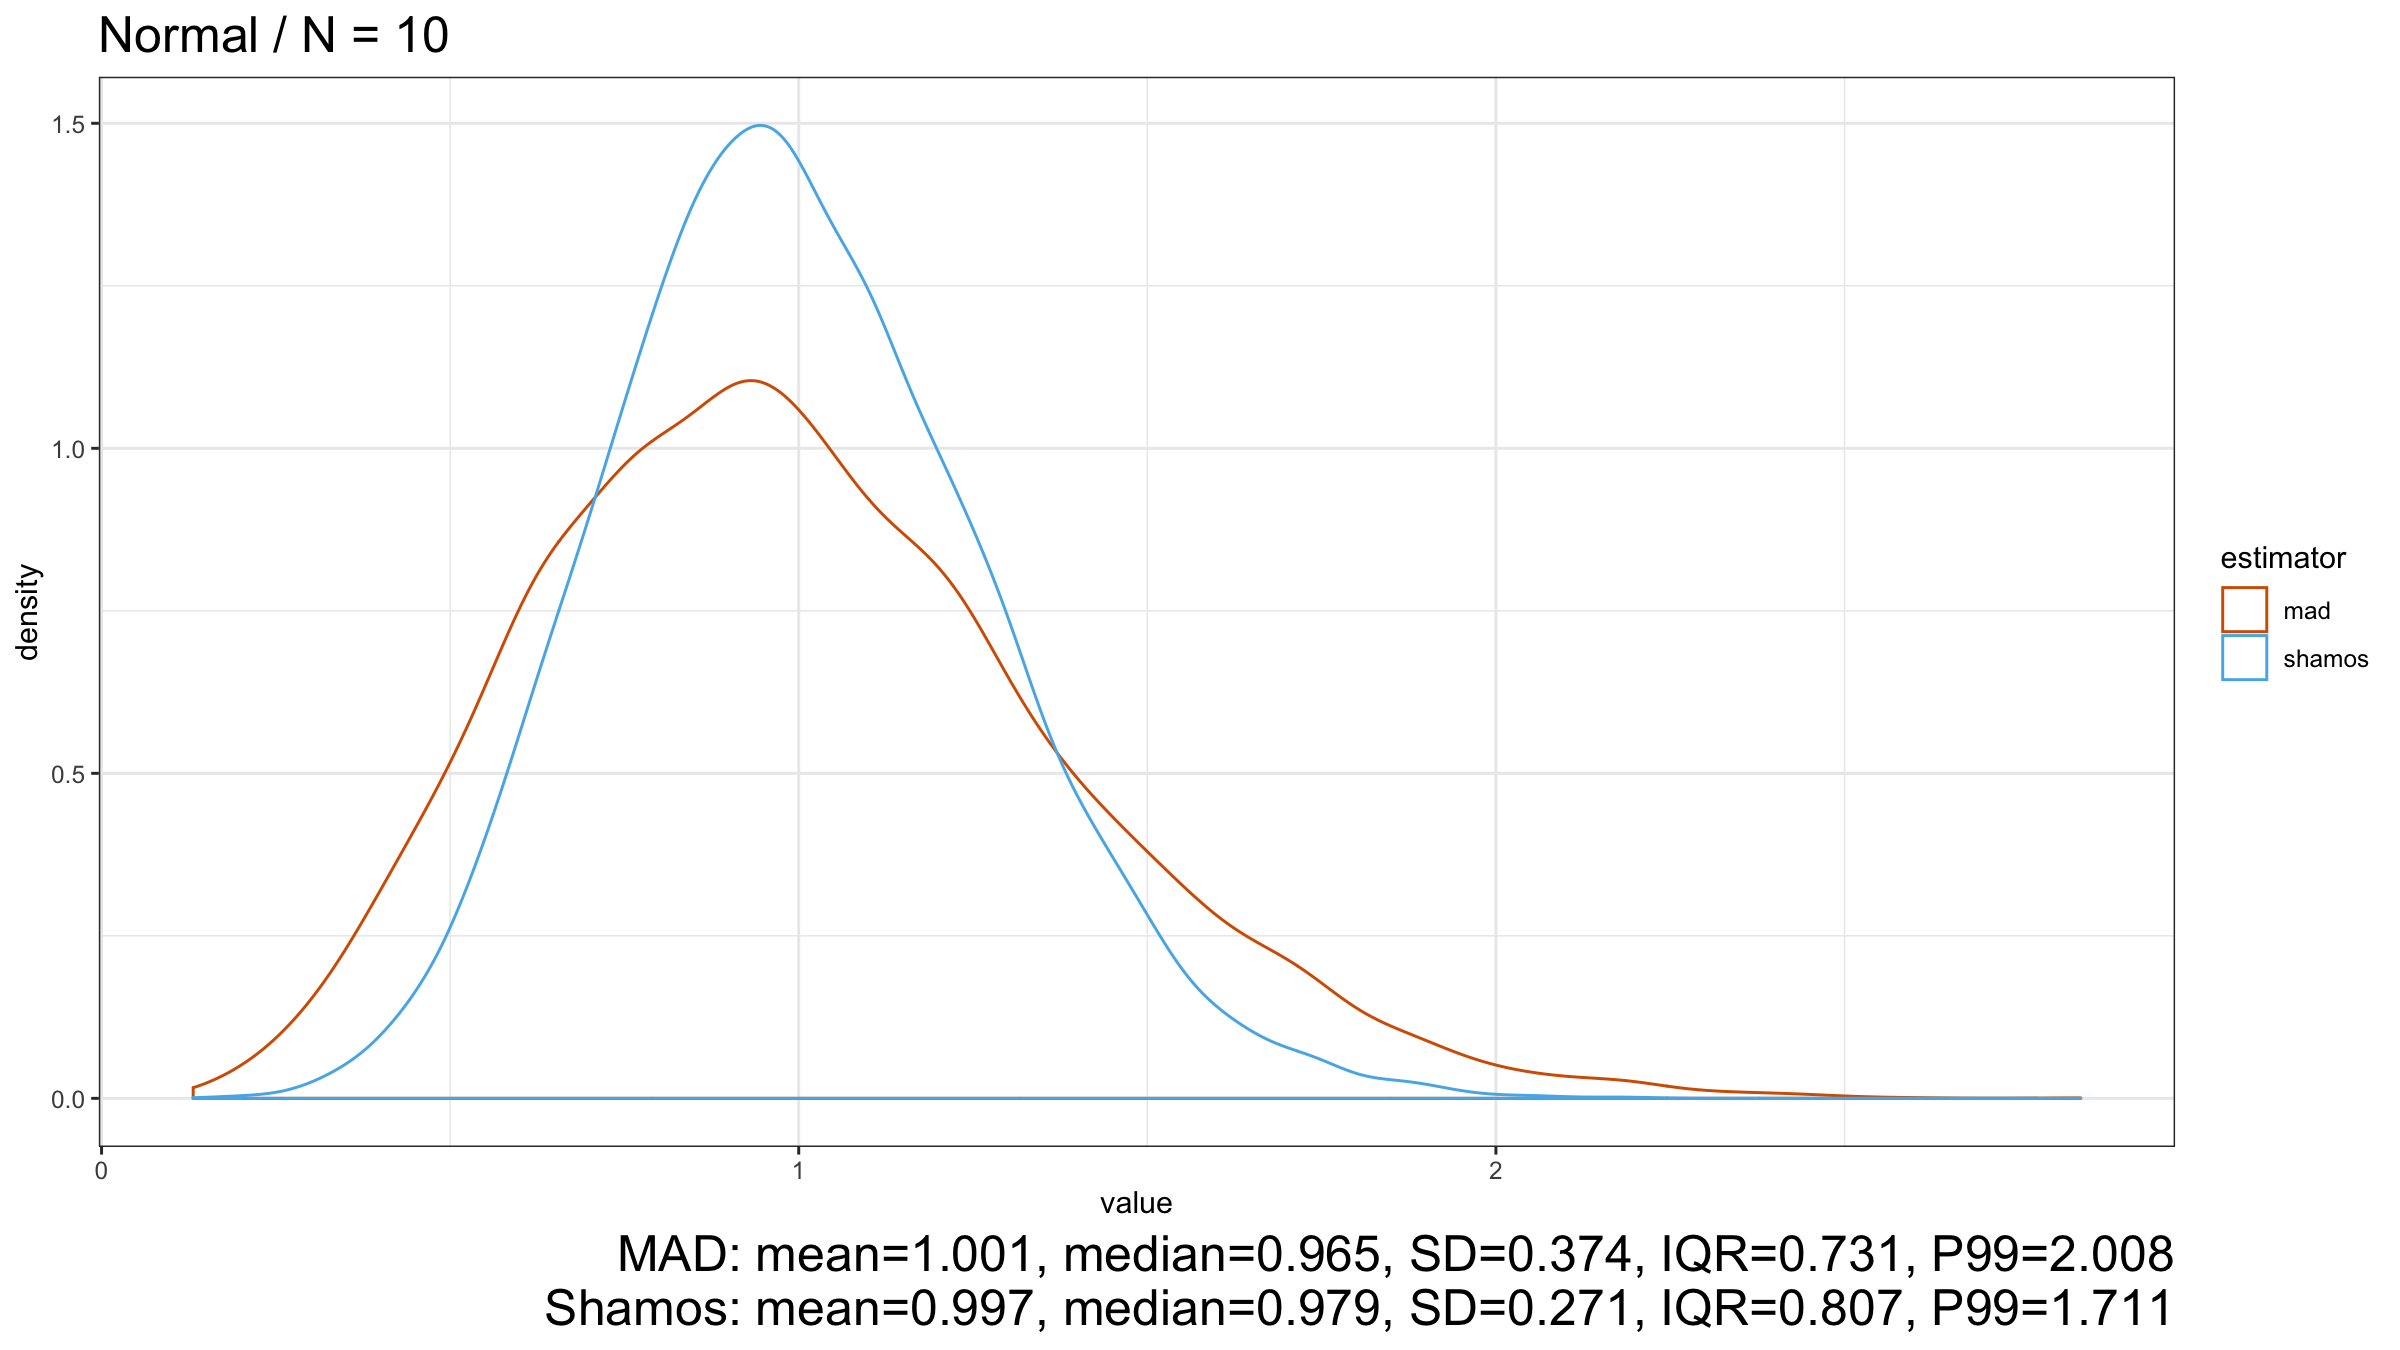
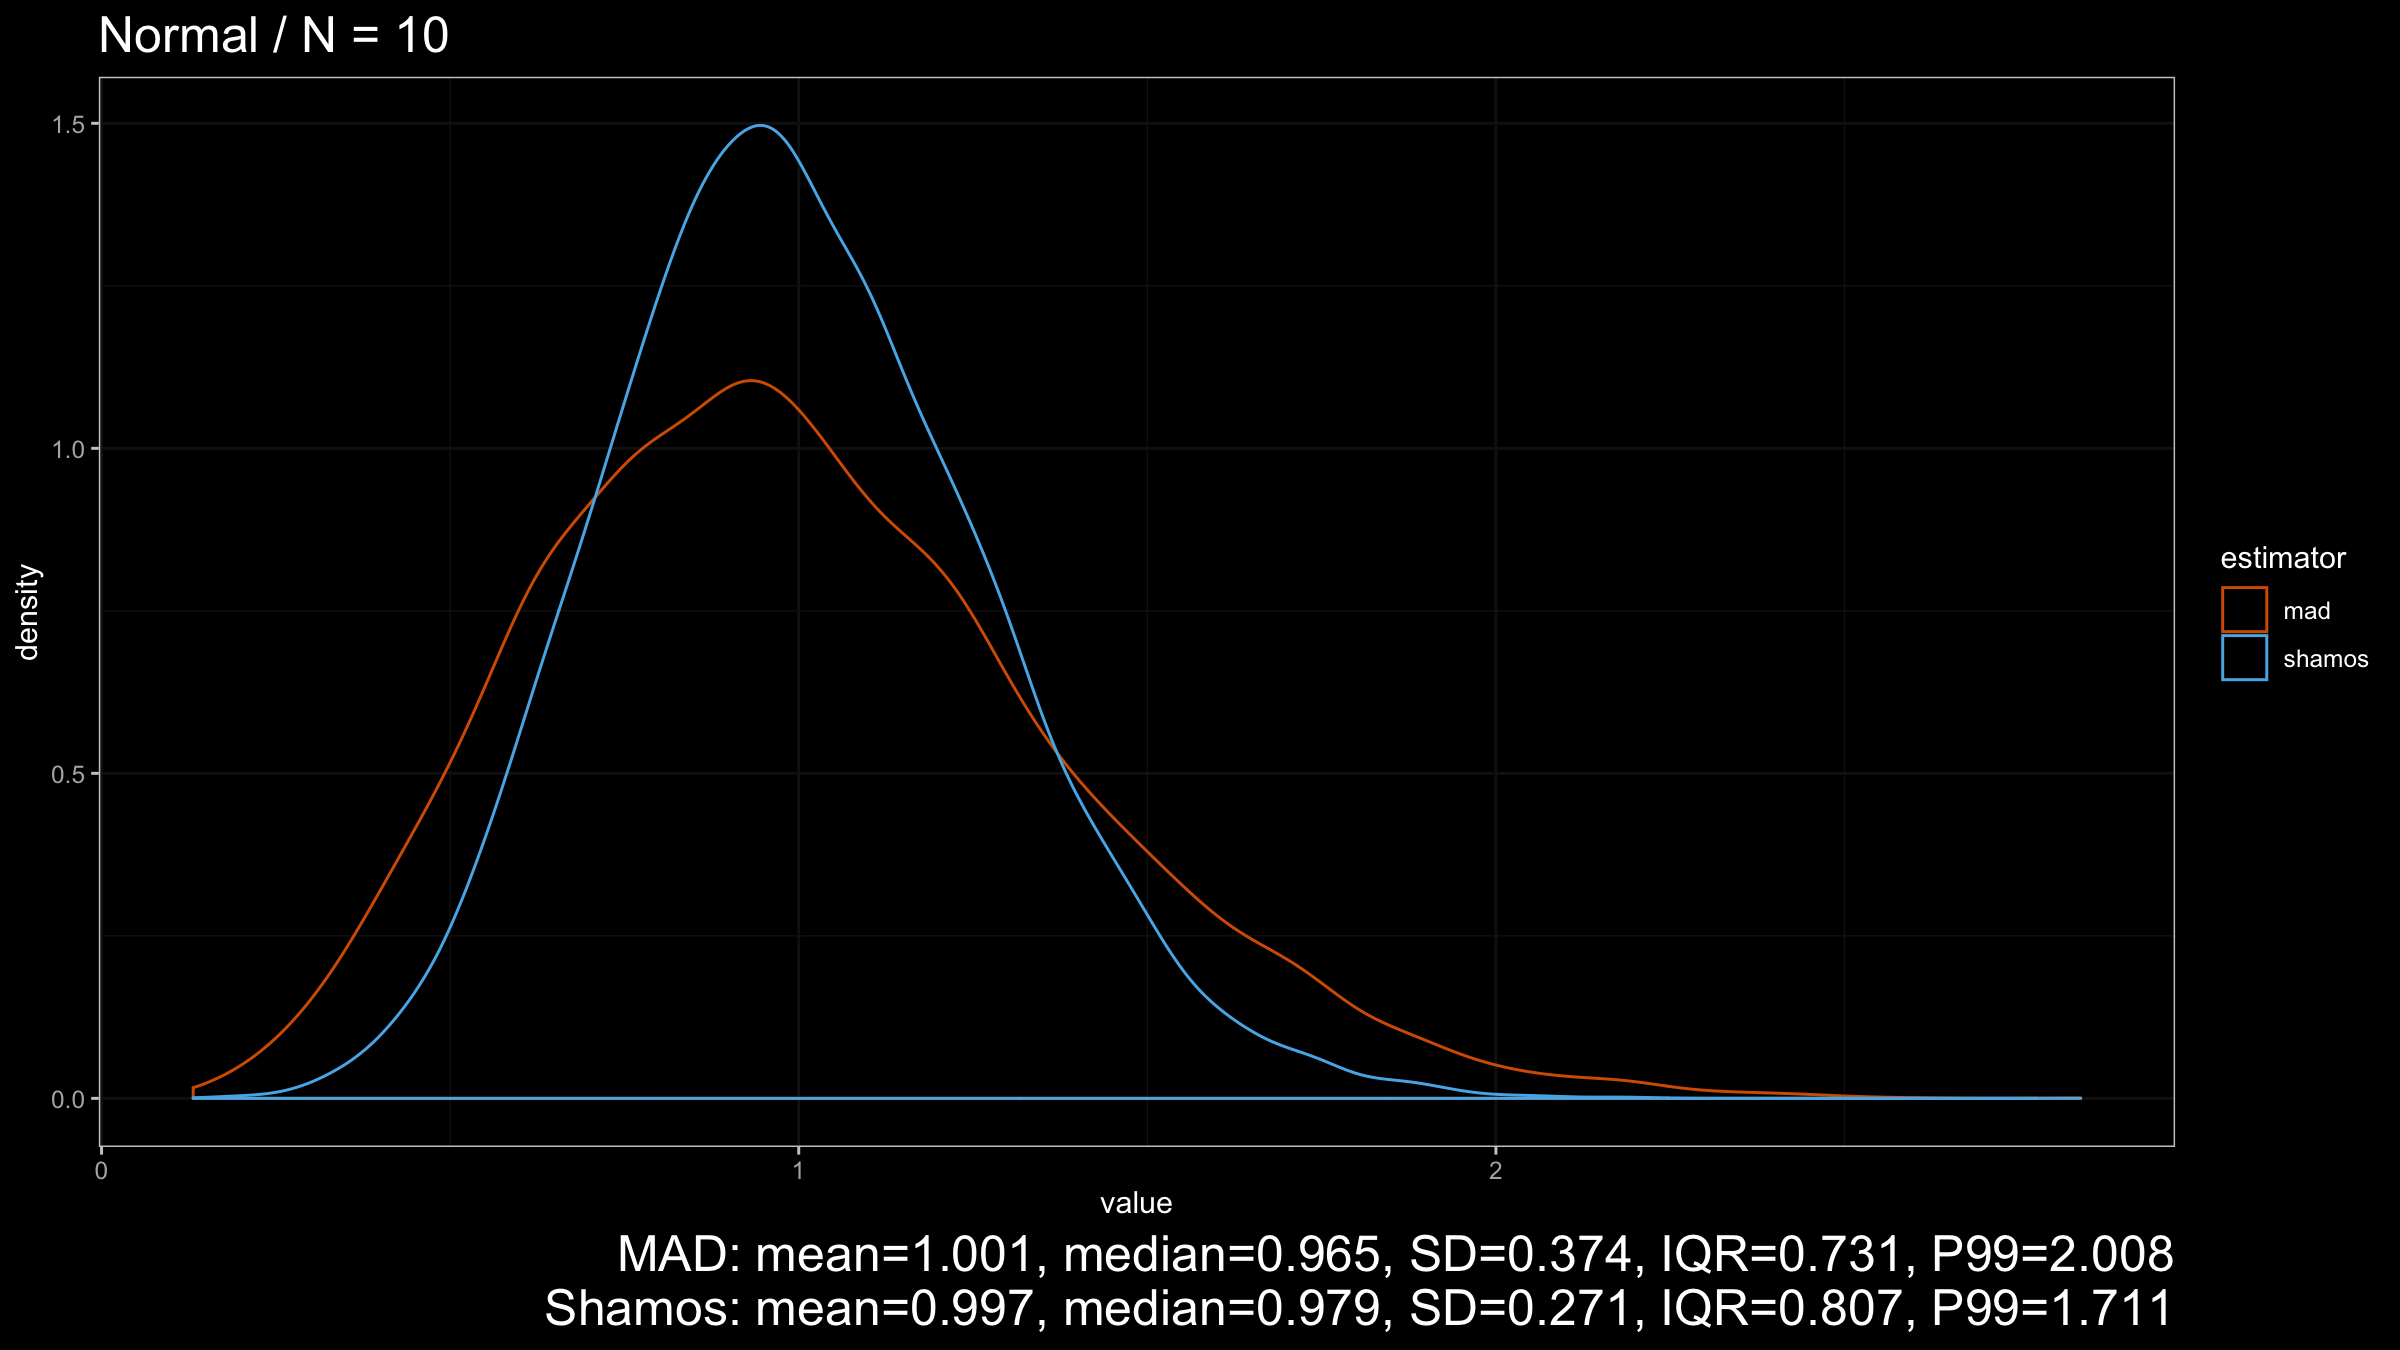
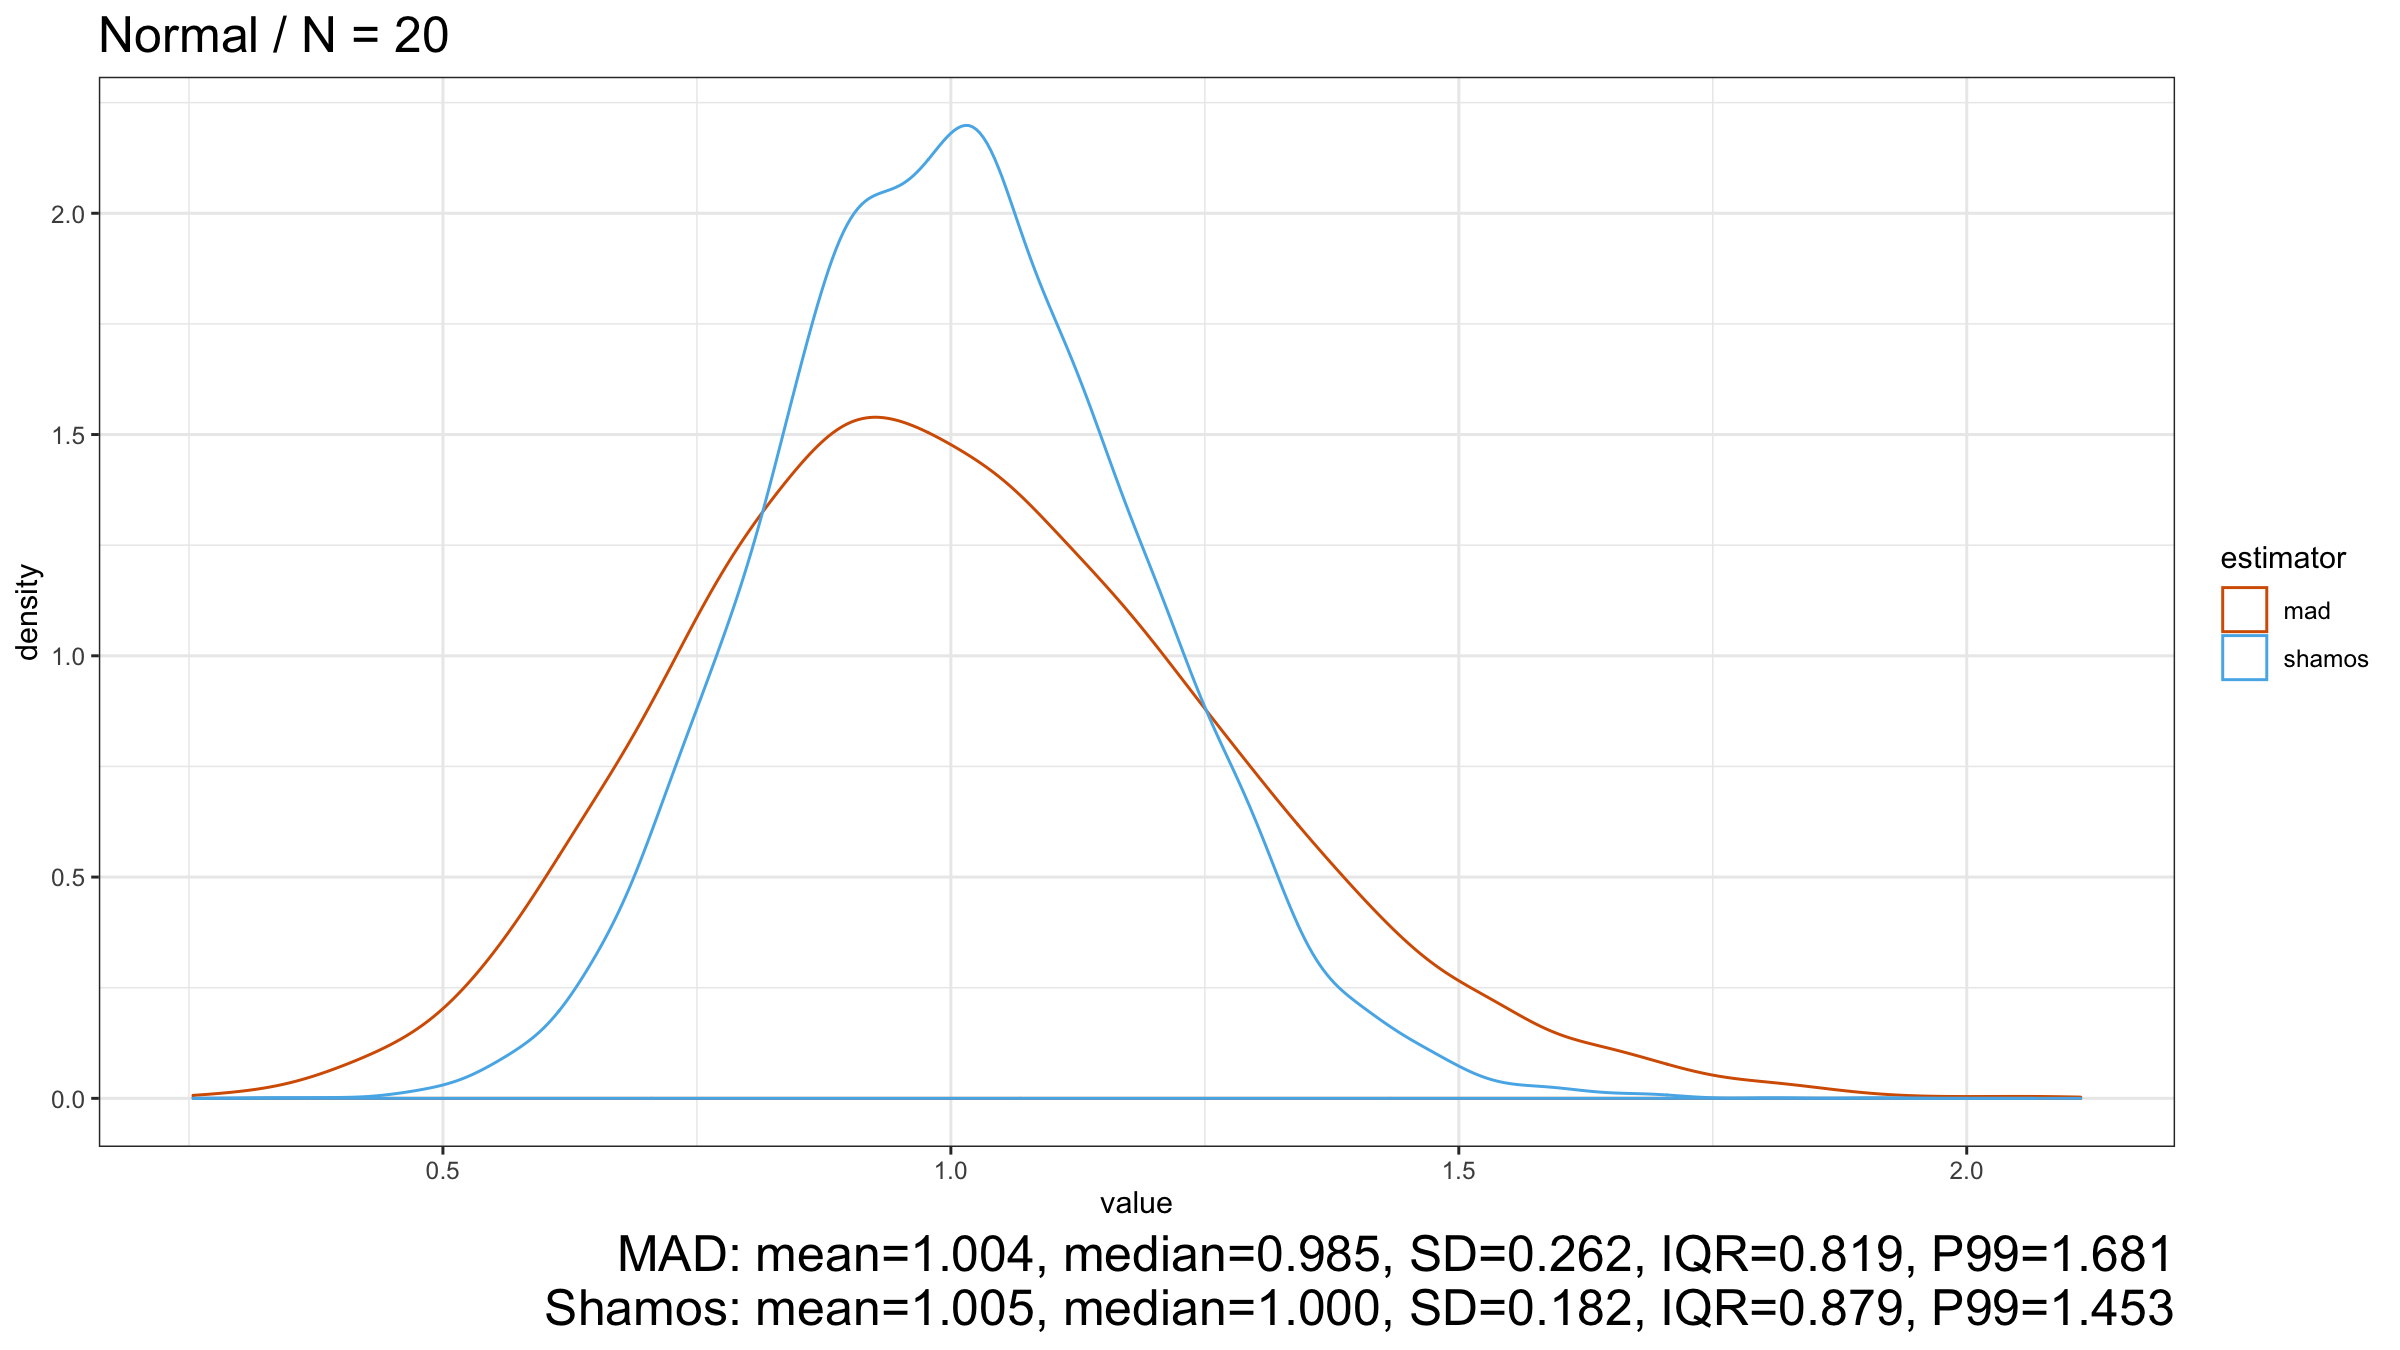
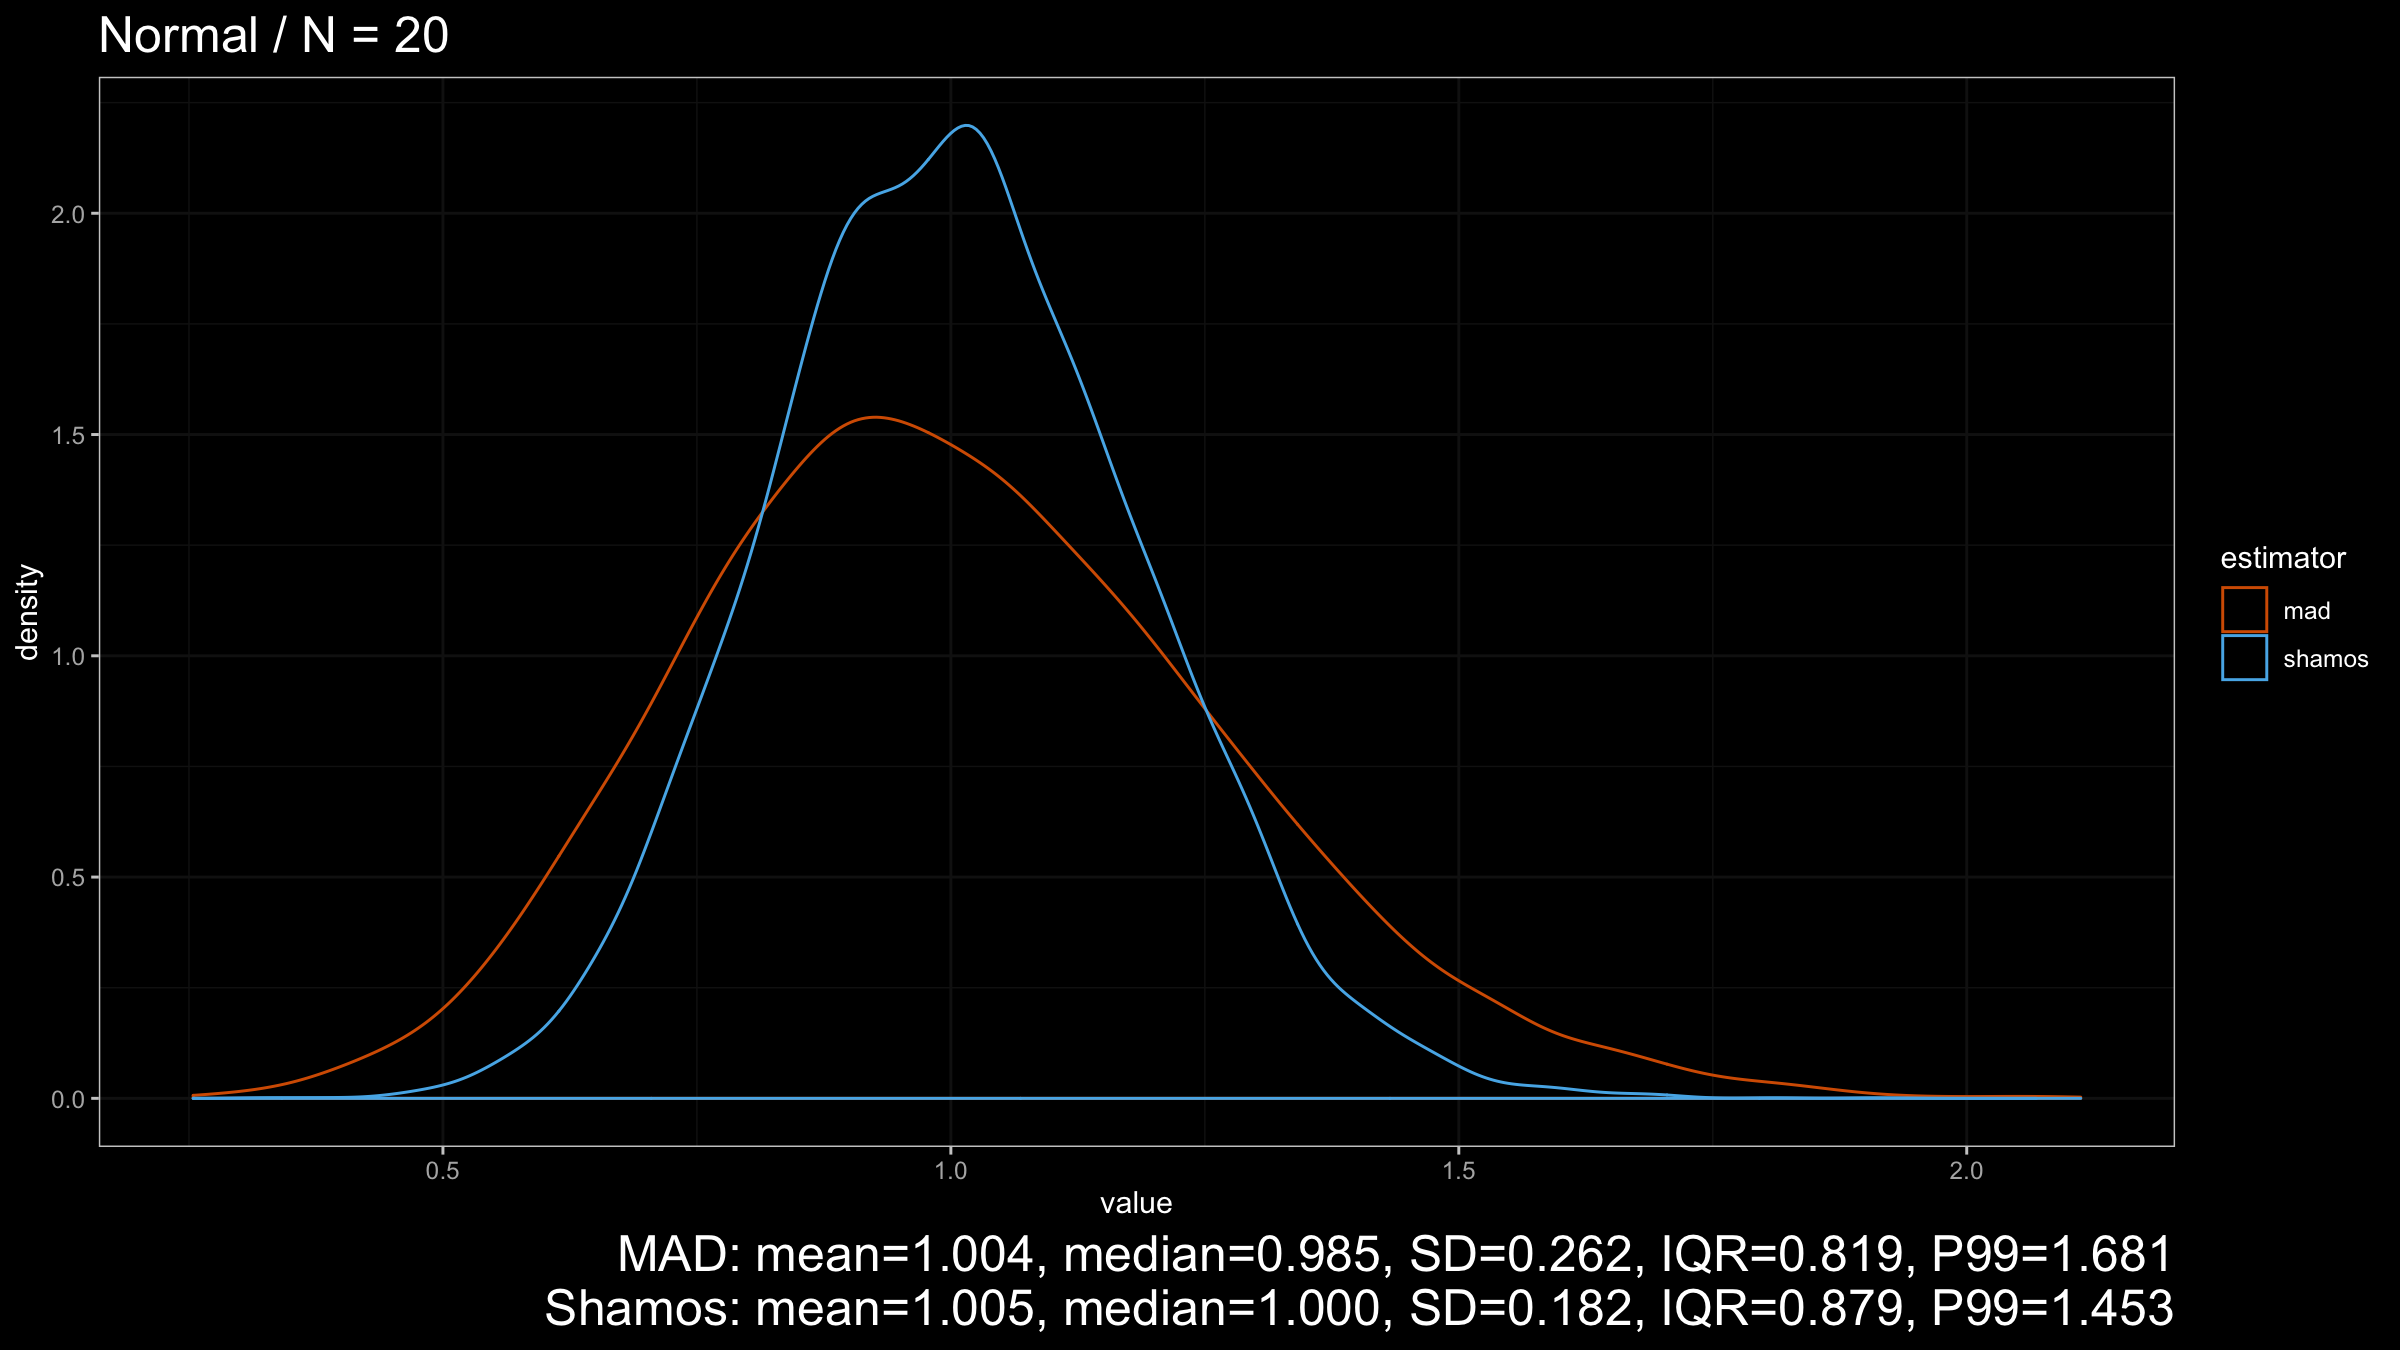
As we can see from the plots, $\operatorname{Shamos}$ has higher statistical efficiency than $\operatorname{MAD}$.
Also, thanks to the $C_n$ scale factors from Investigation of finite-sample properties of robust location and scale estimators
By Chanseok Park, Haewon Kim, Min Wang
·
2020park2020,
the expected value of both estimators is $1$, which makes them a robust replacement
for the unbiased standard deviation.
Now let’s look at the results for the light-tailed Gumbel distribution:
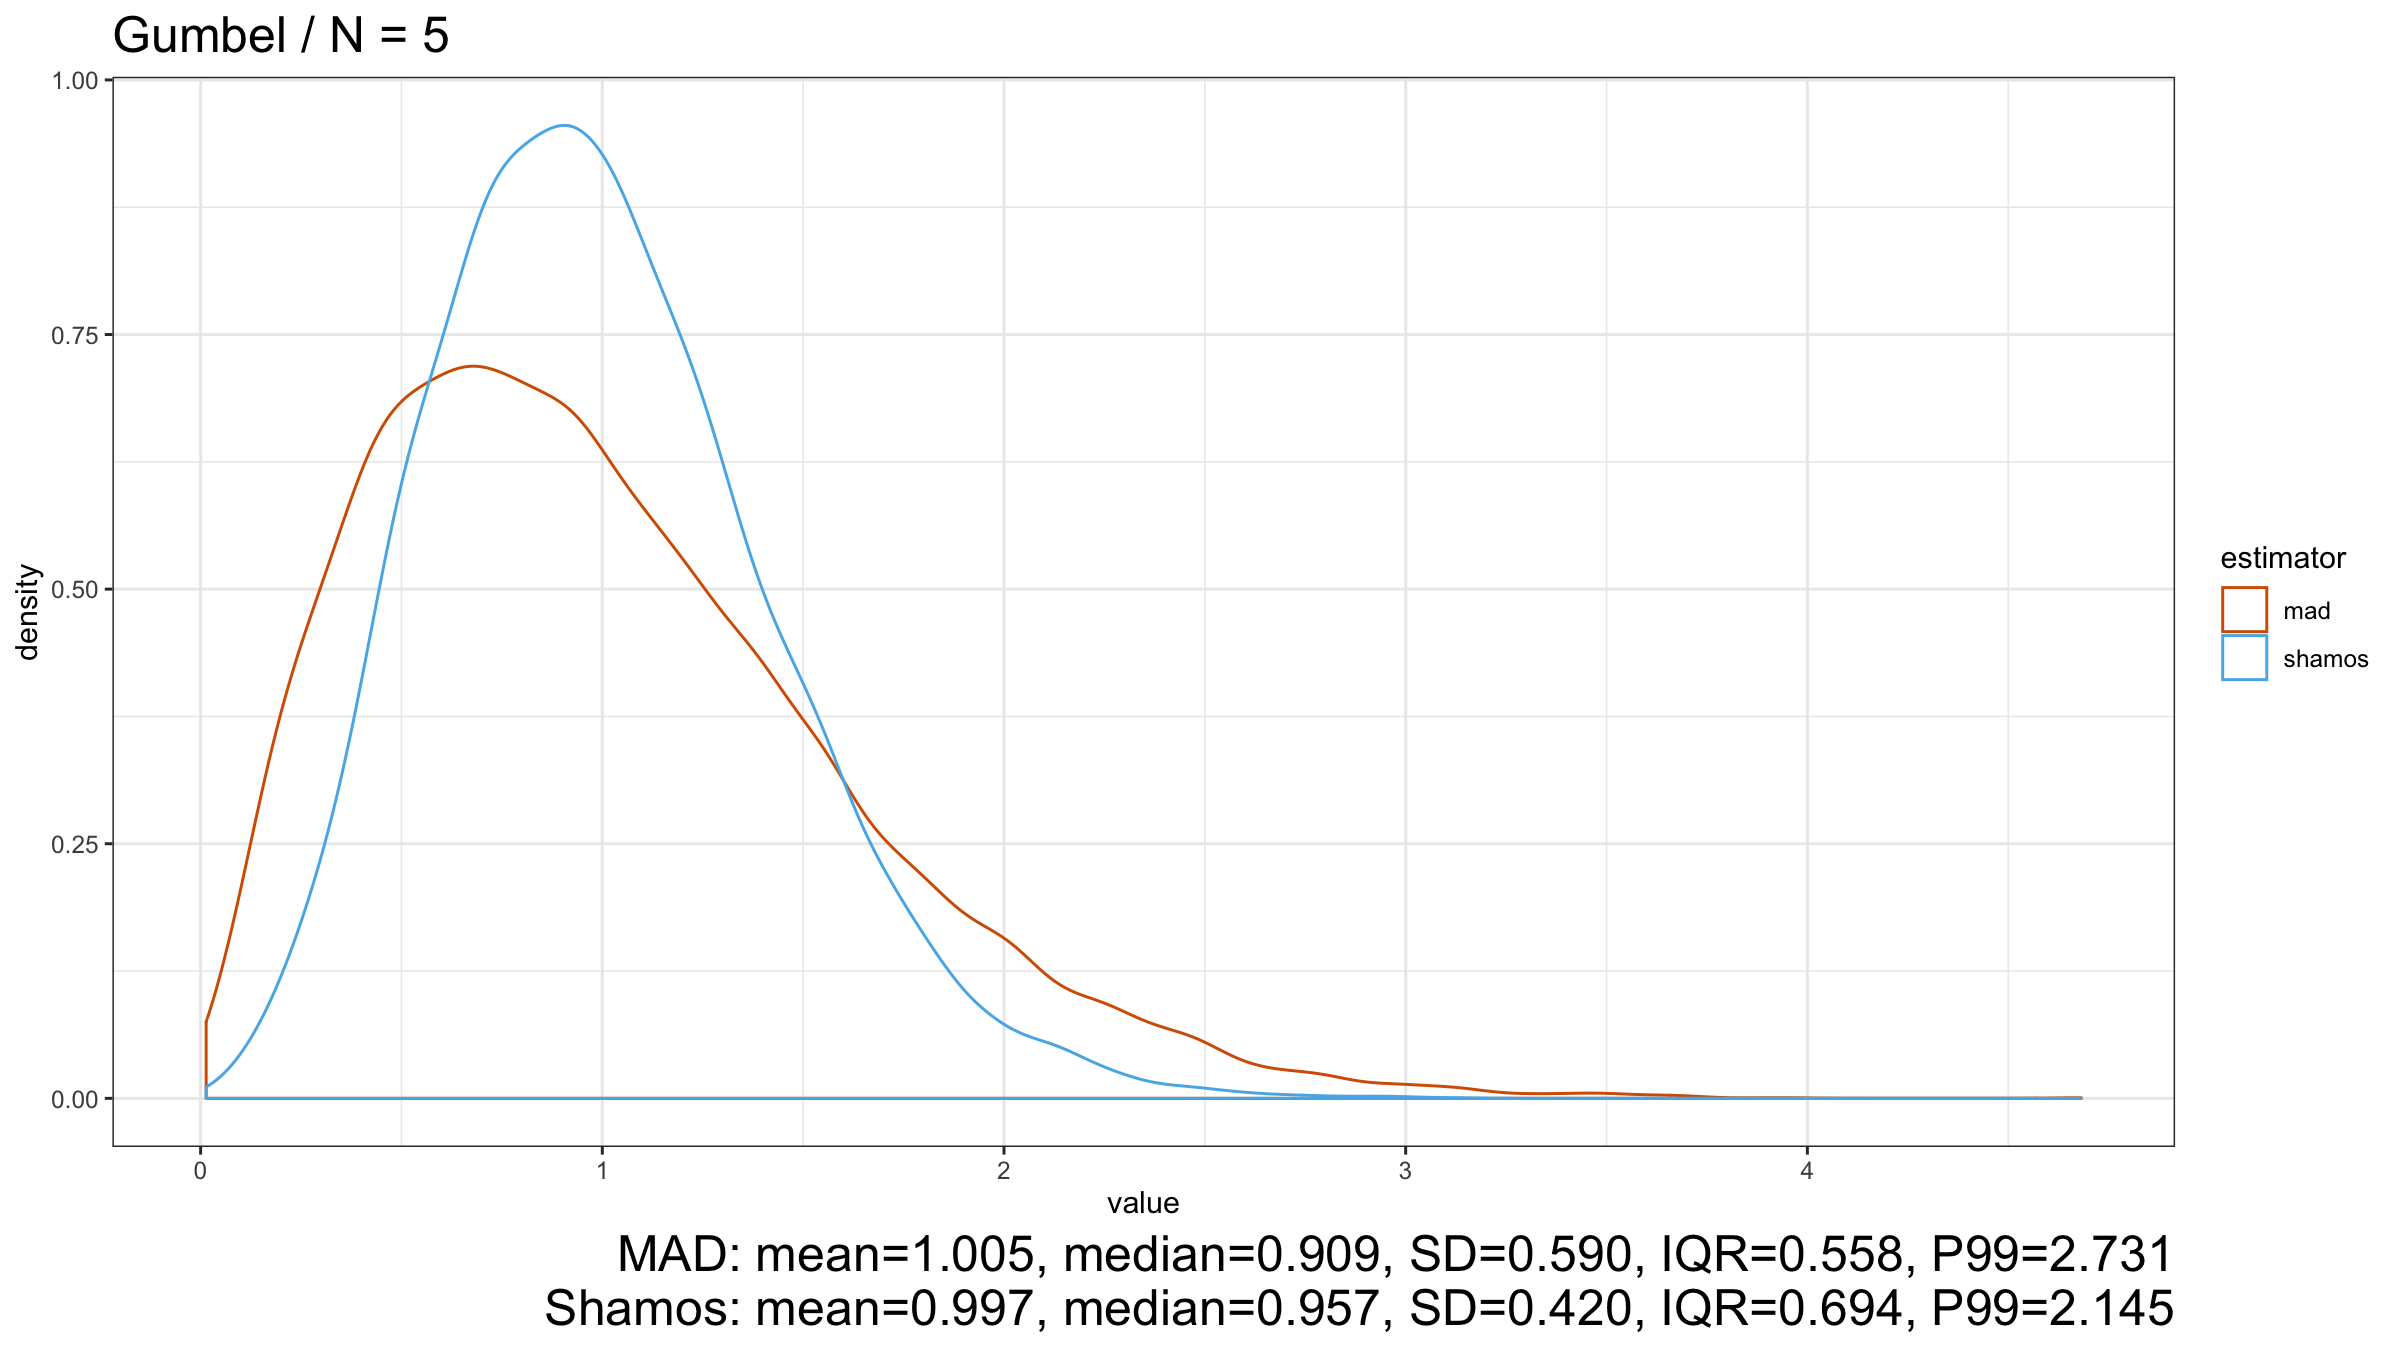
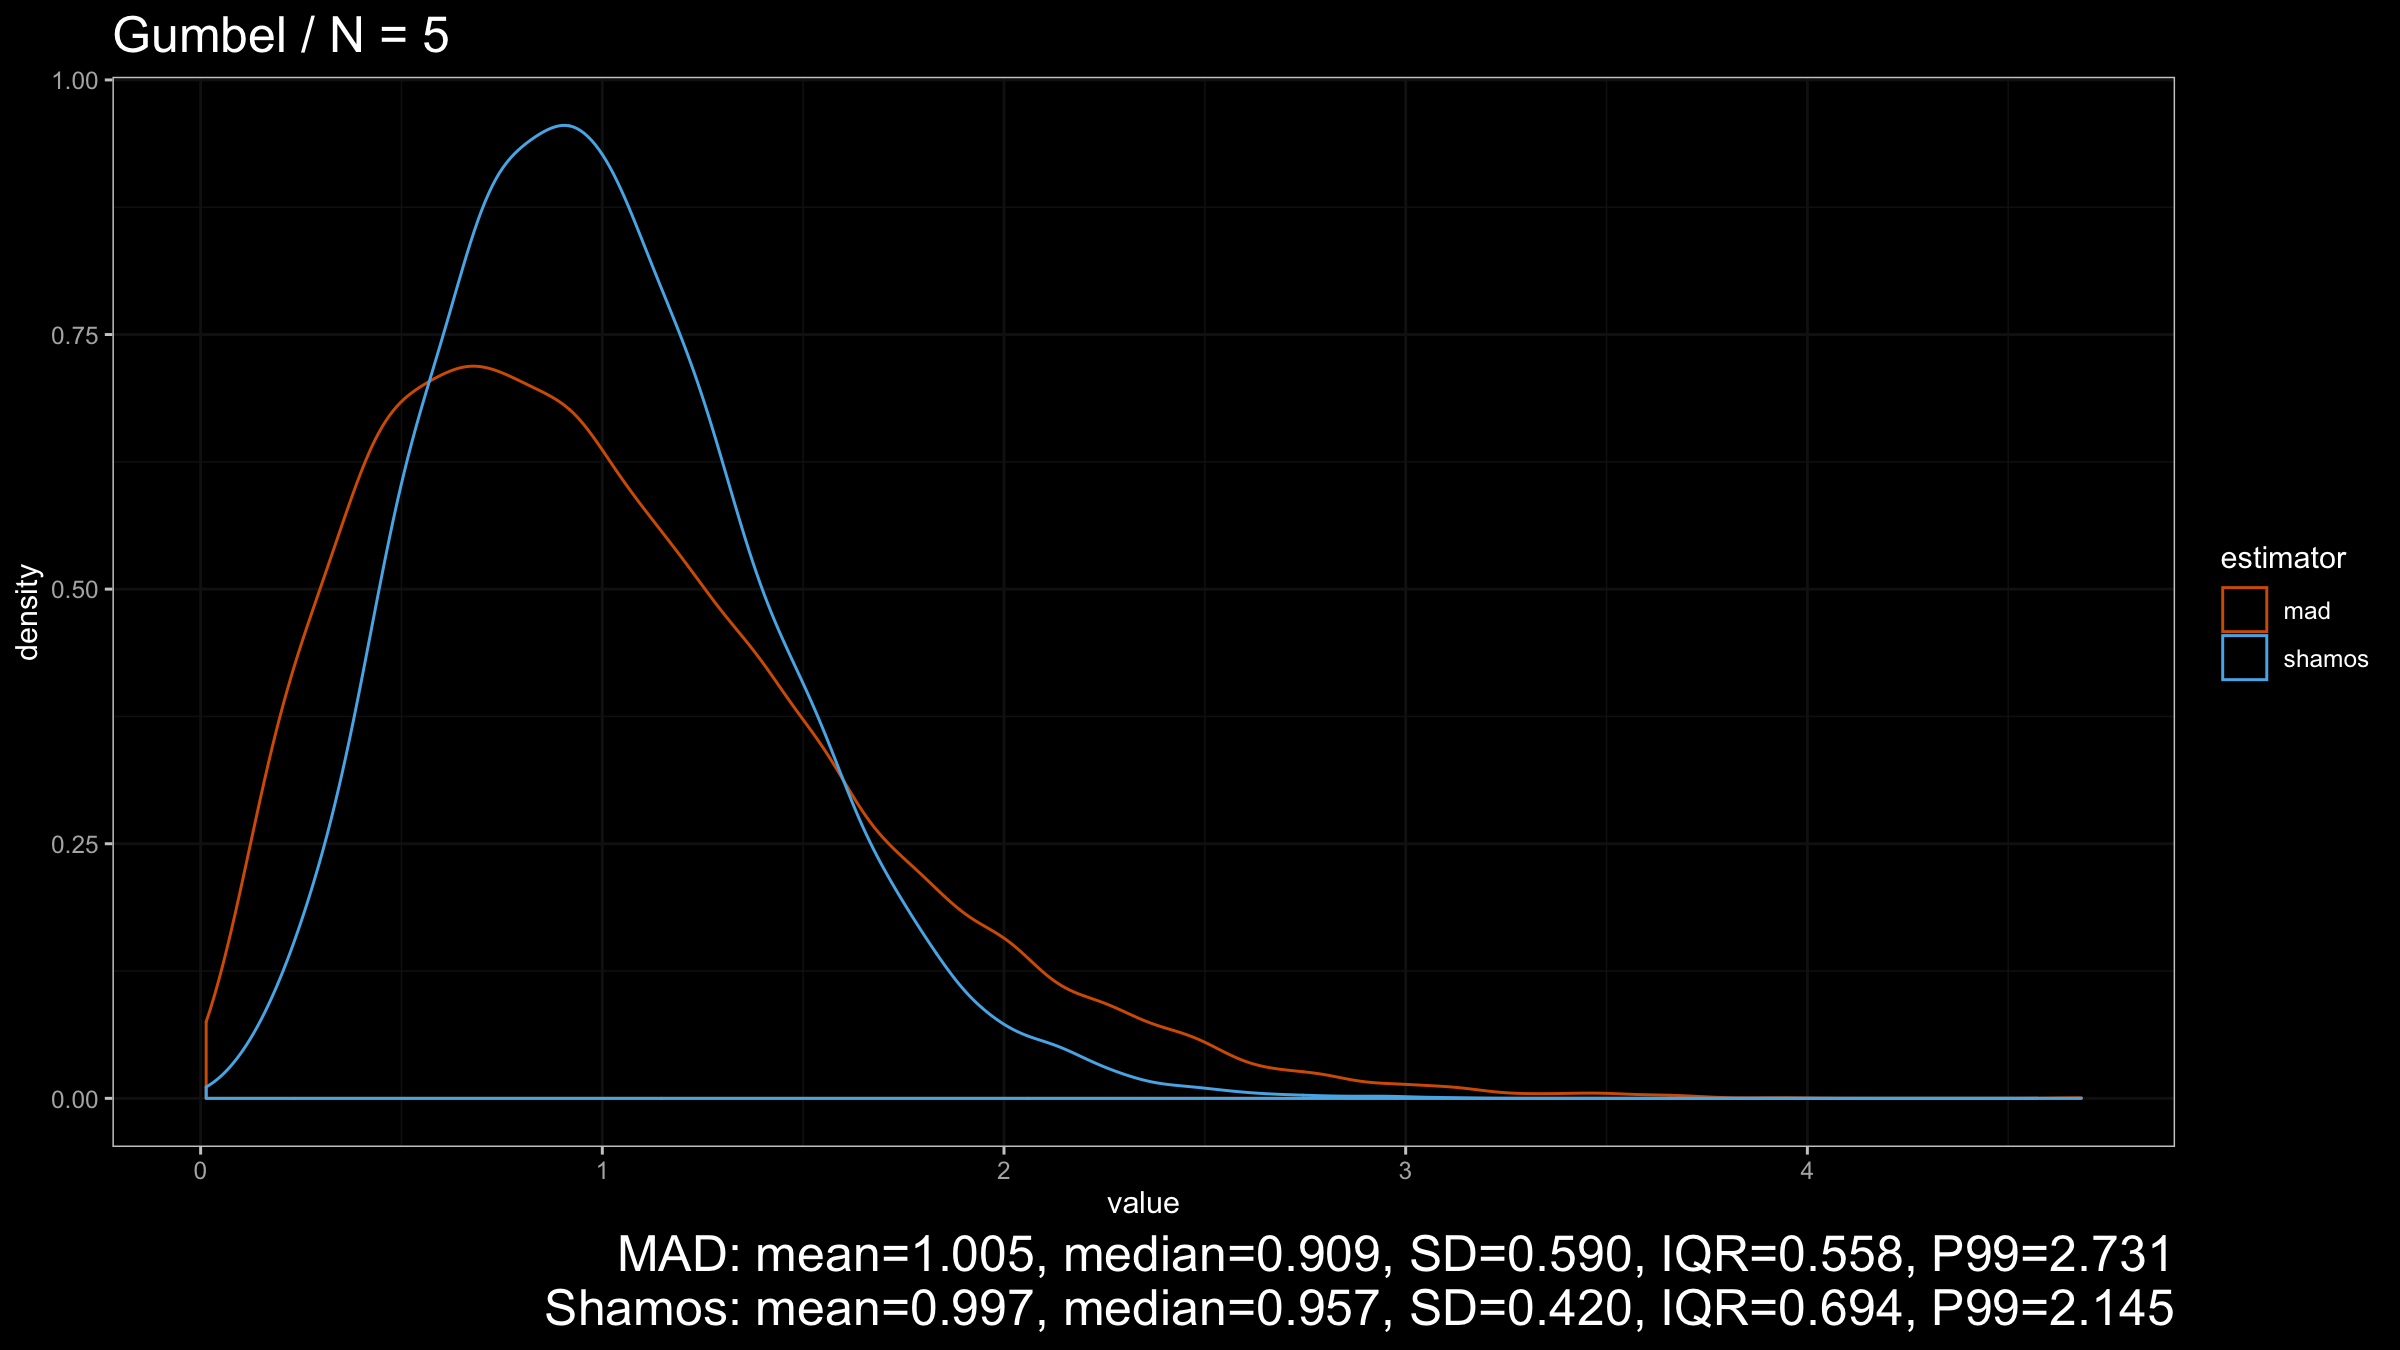
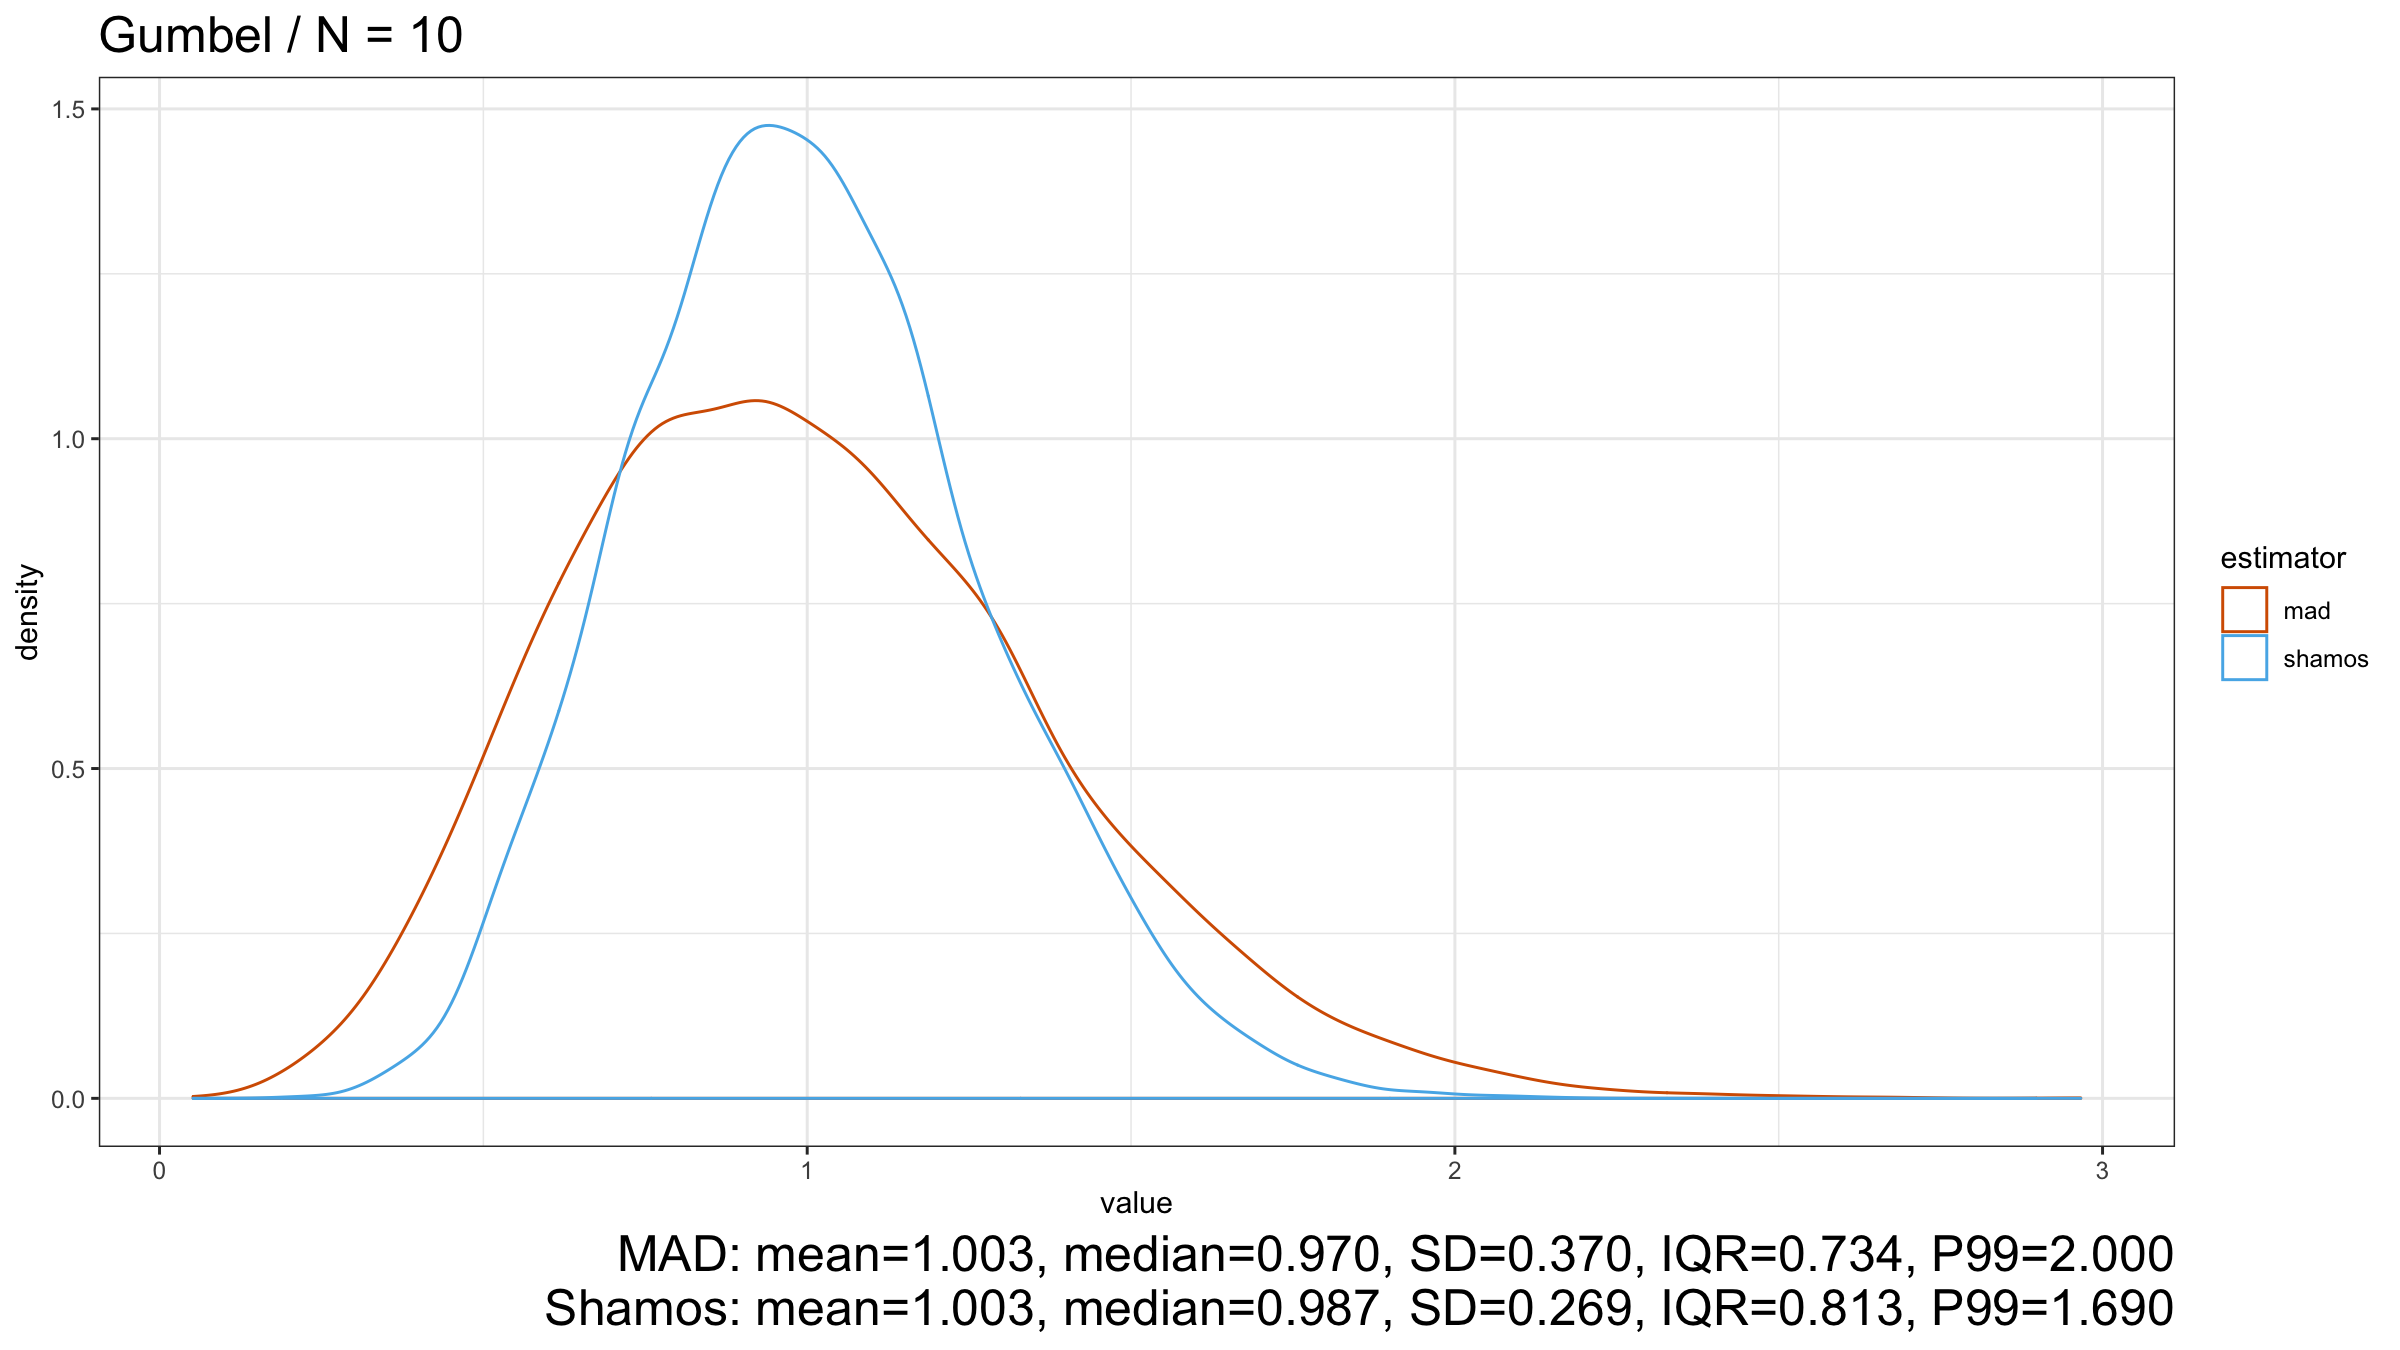
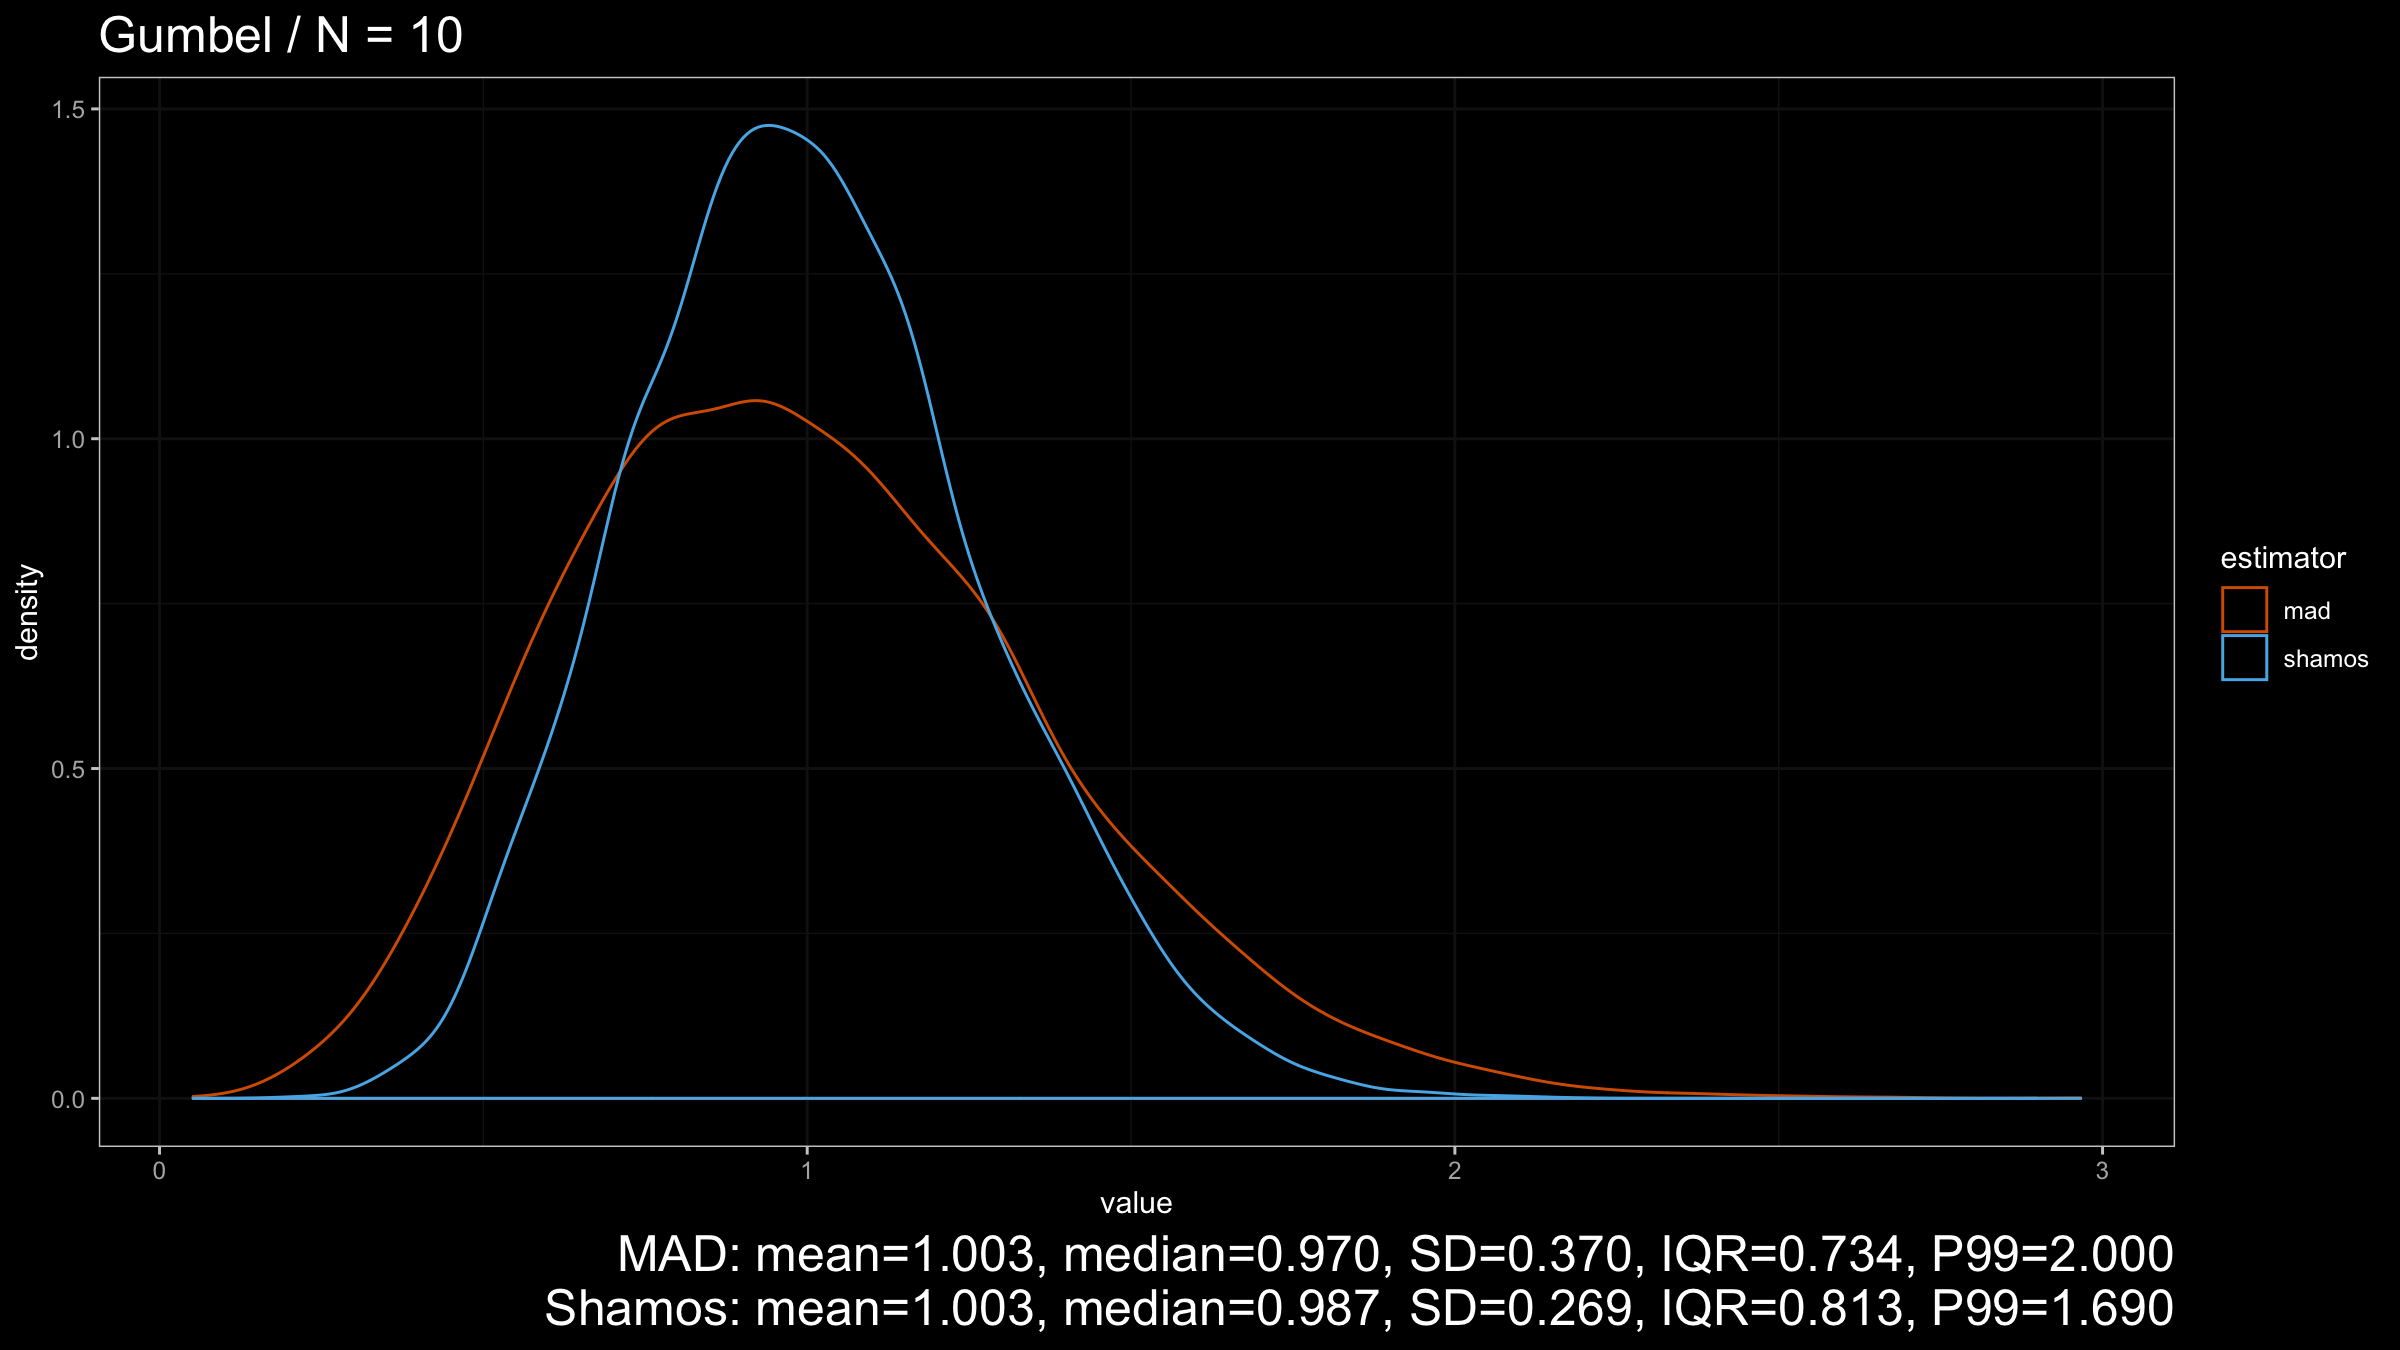
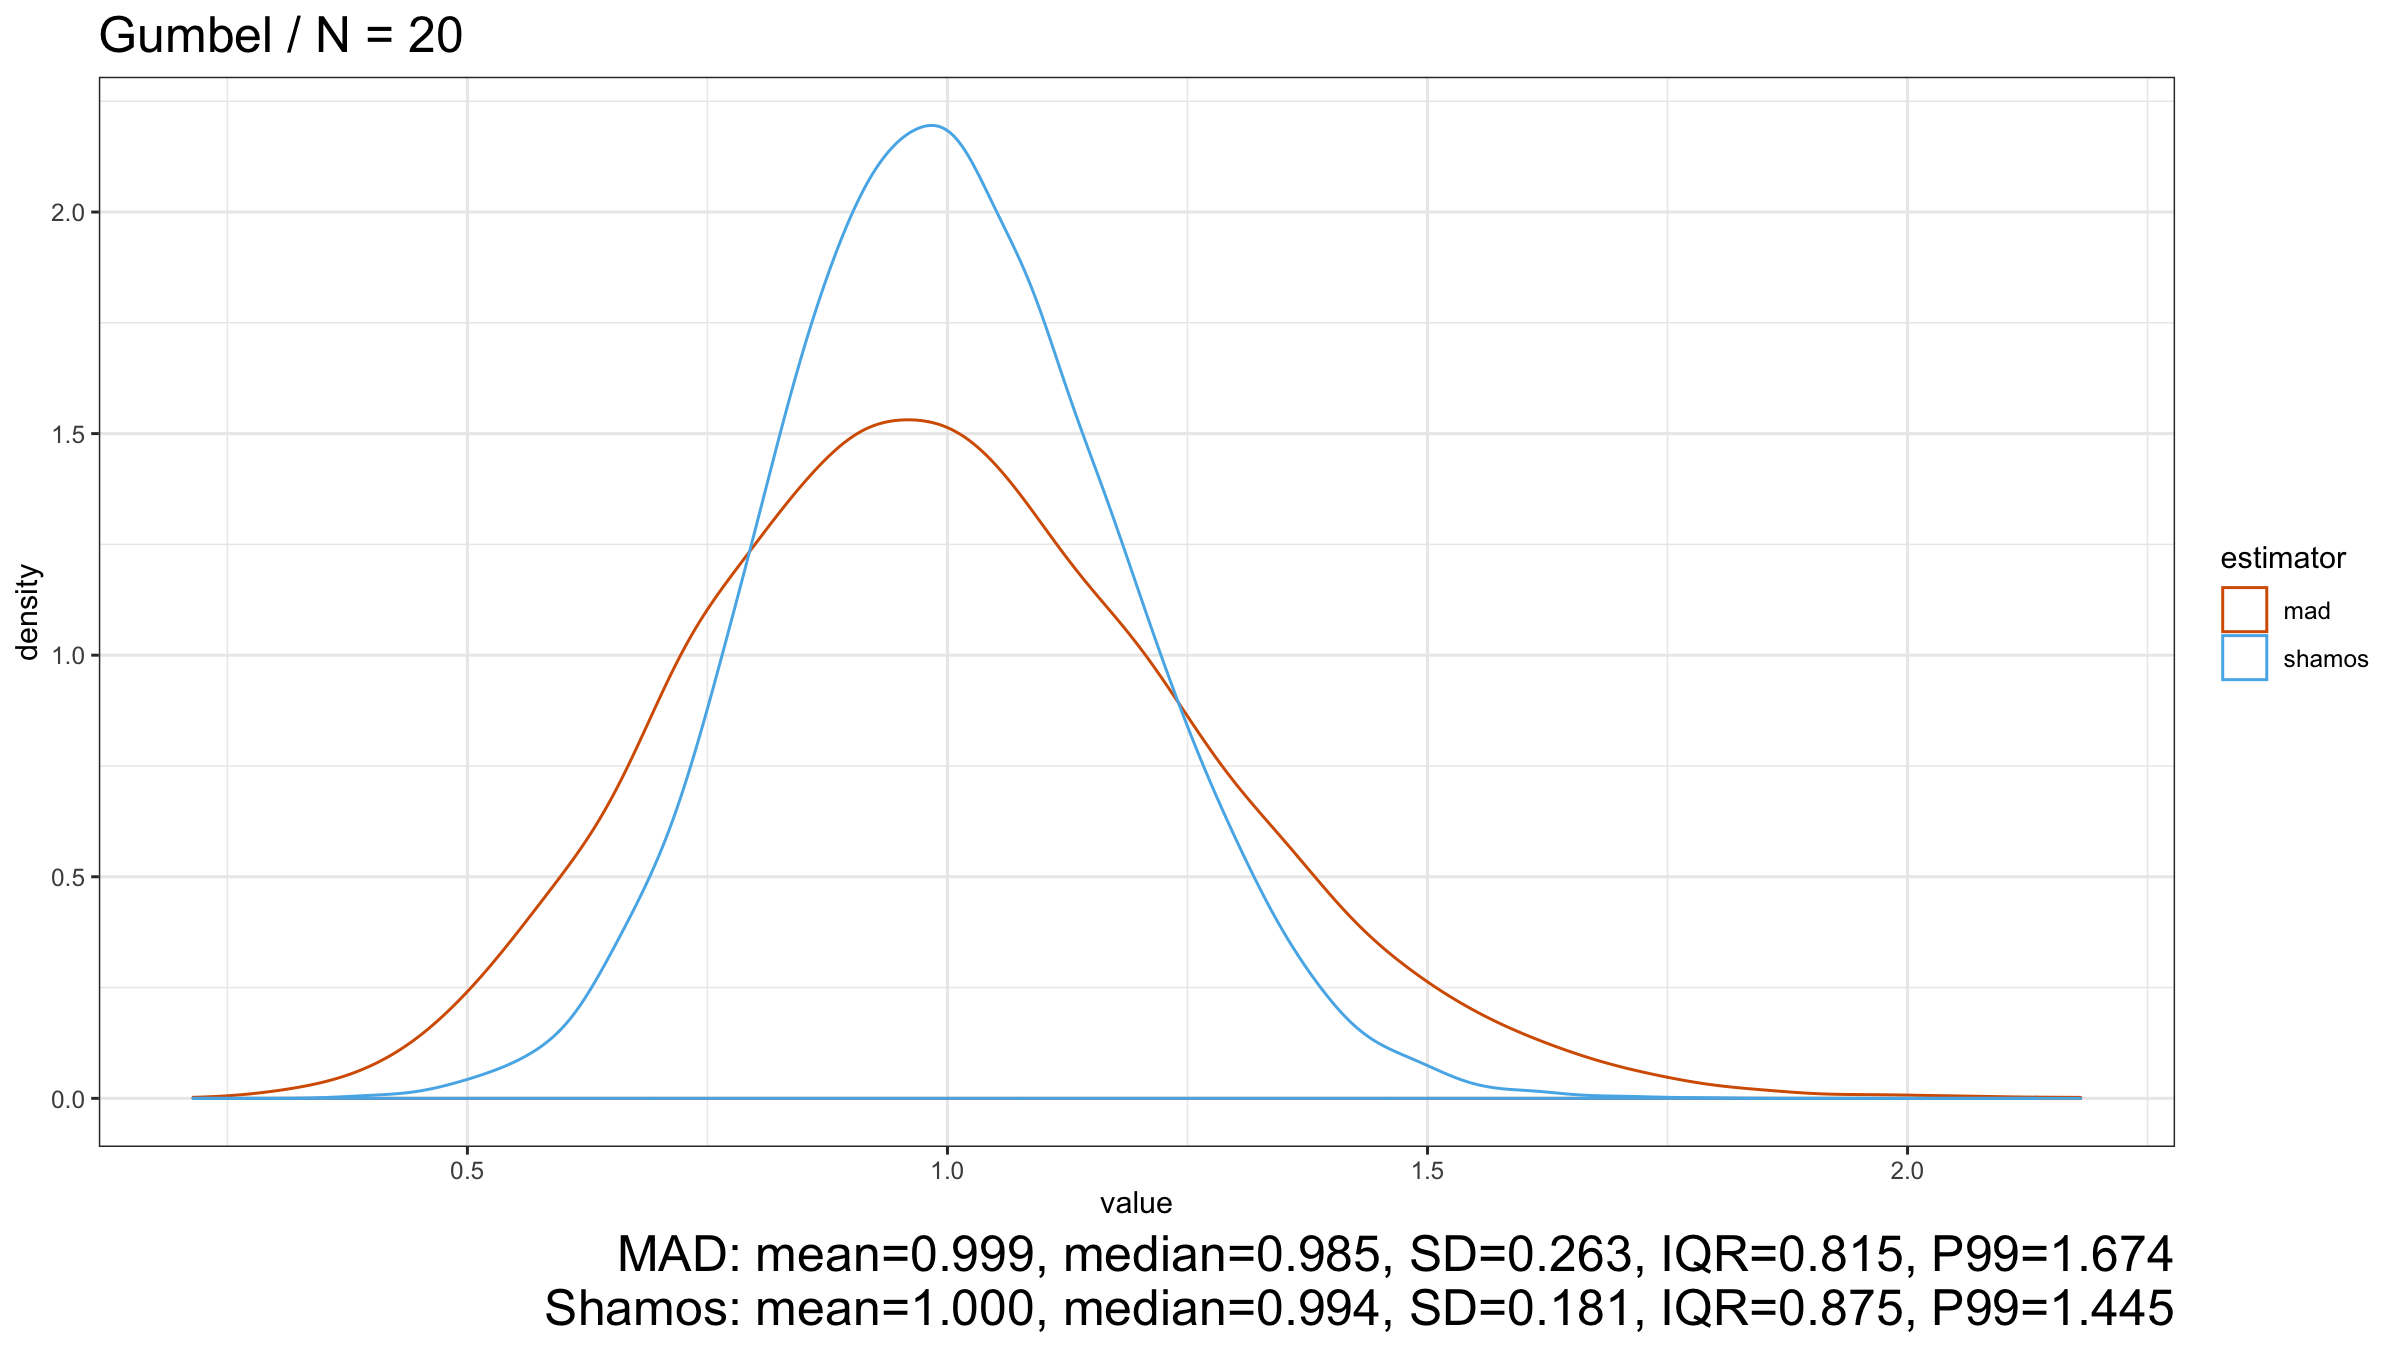
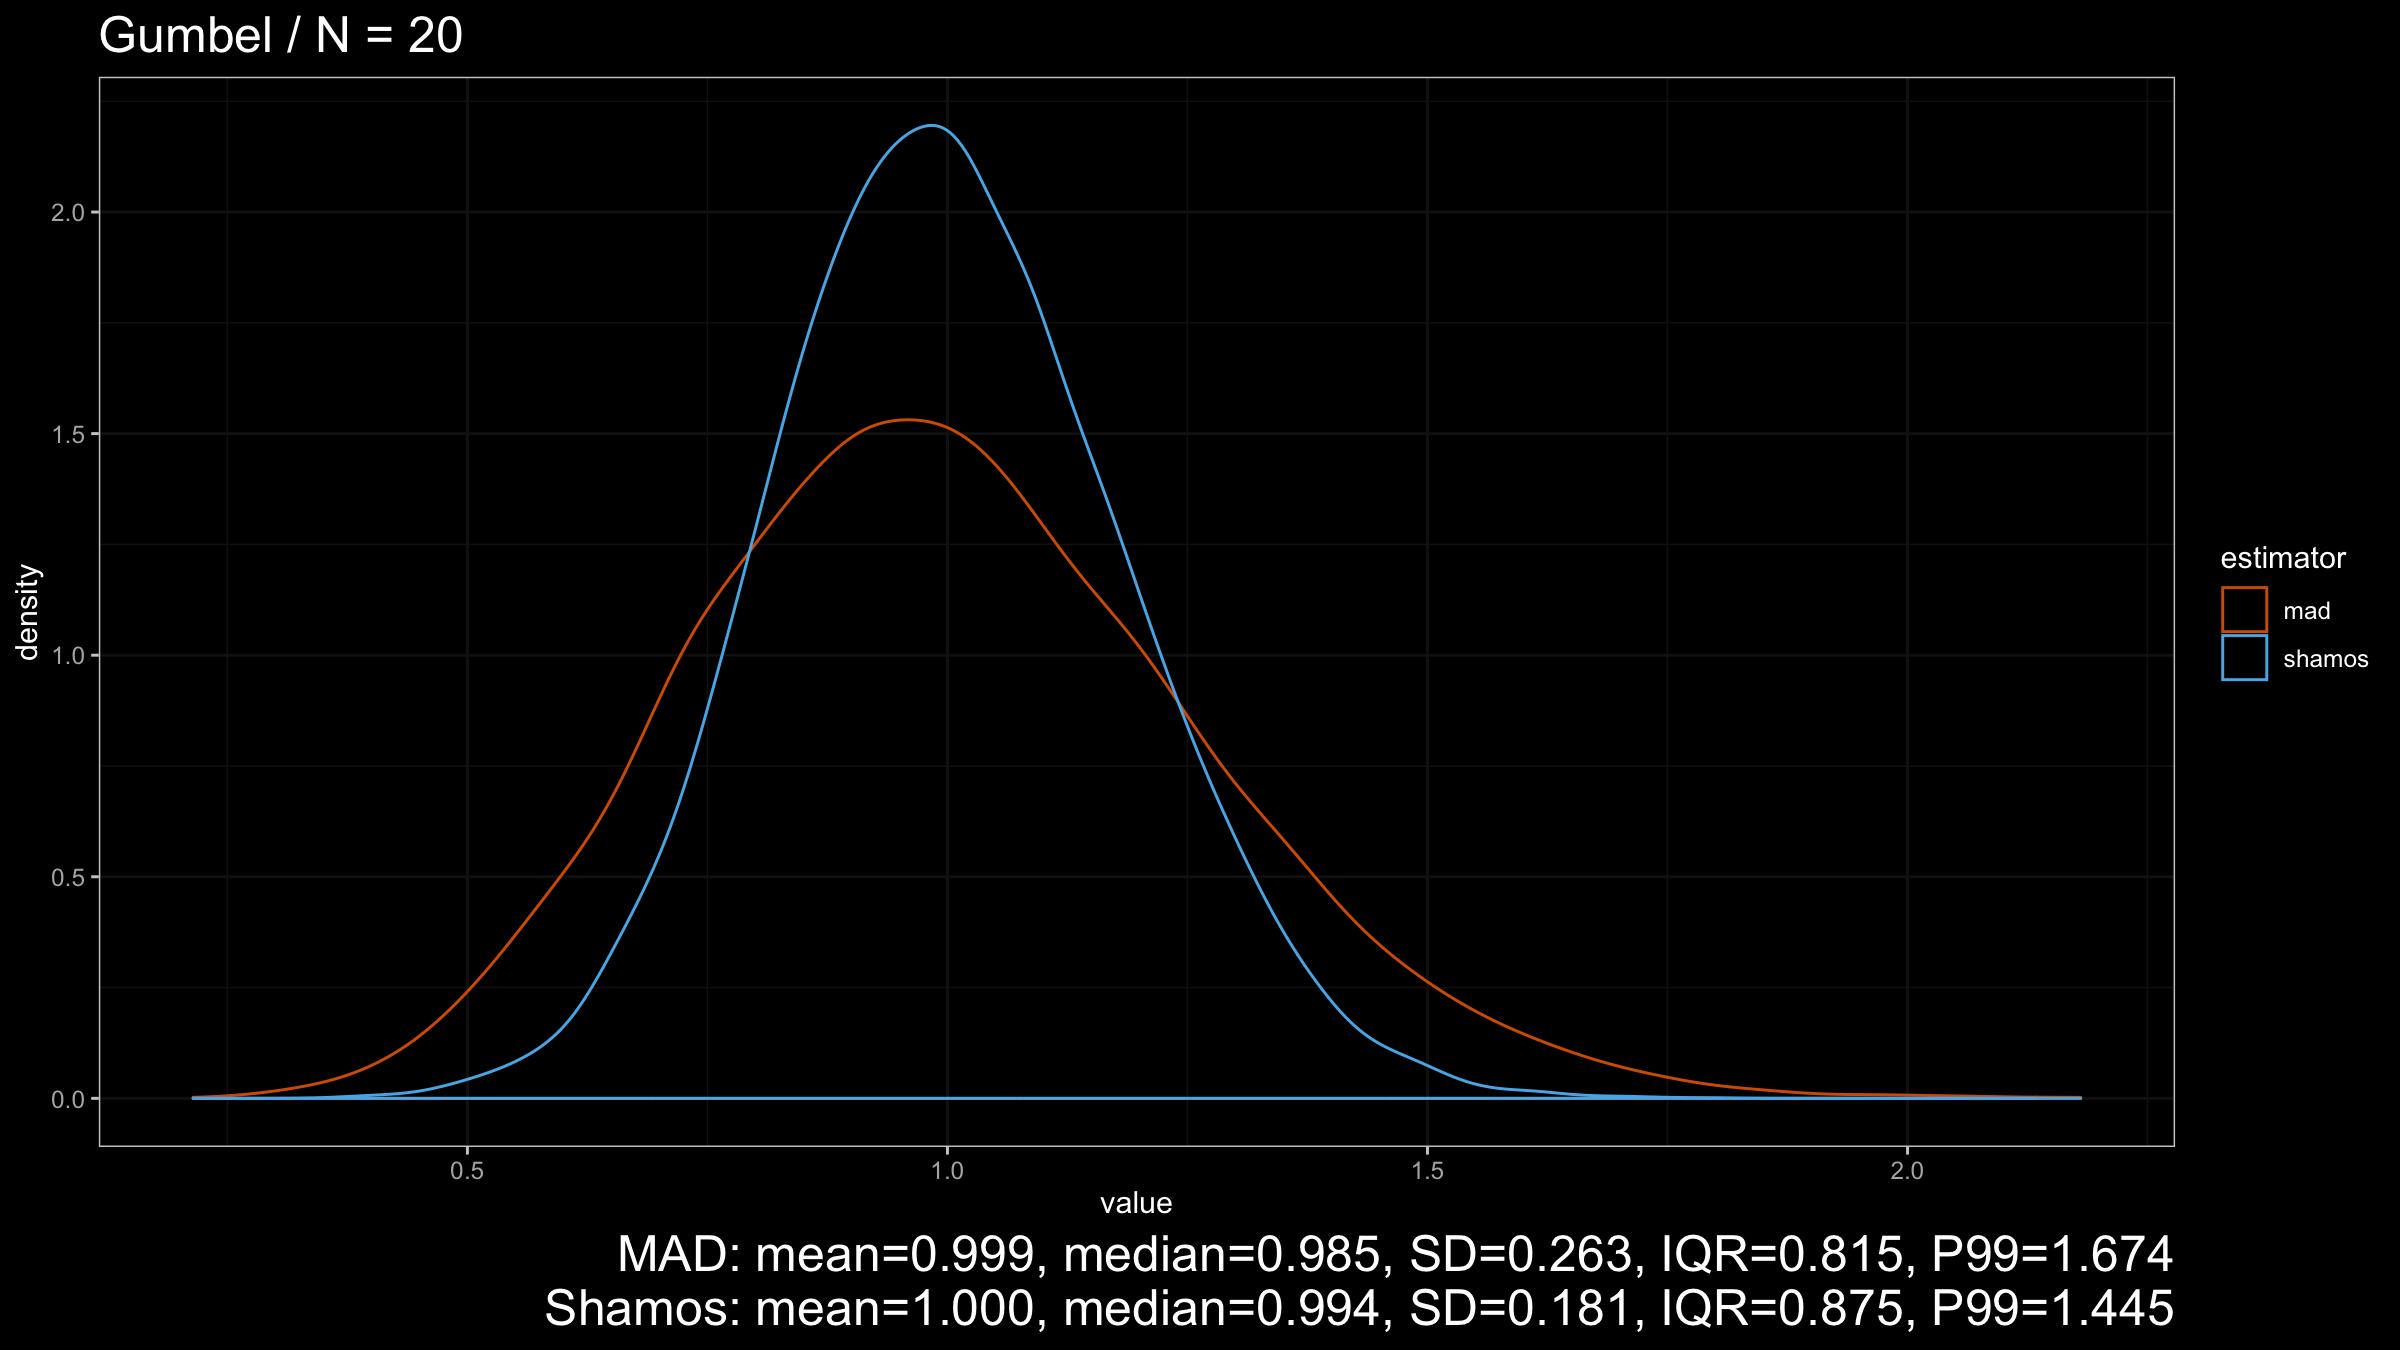
$\operatorname{Shamos}$ still looks better than $\operatorname{MAD}$ because its density plot is more narrow.
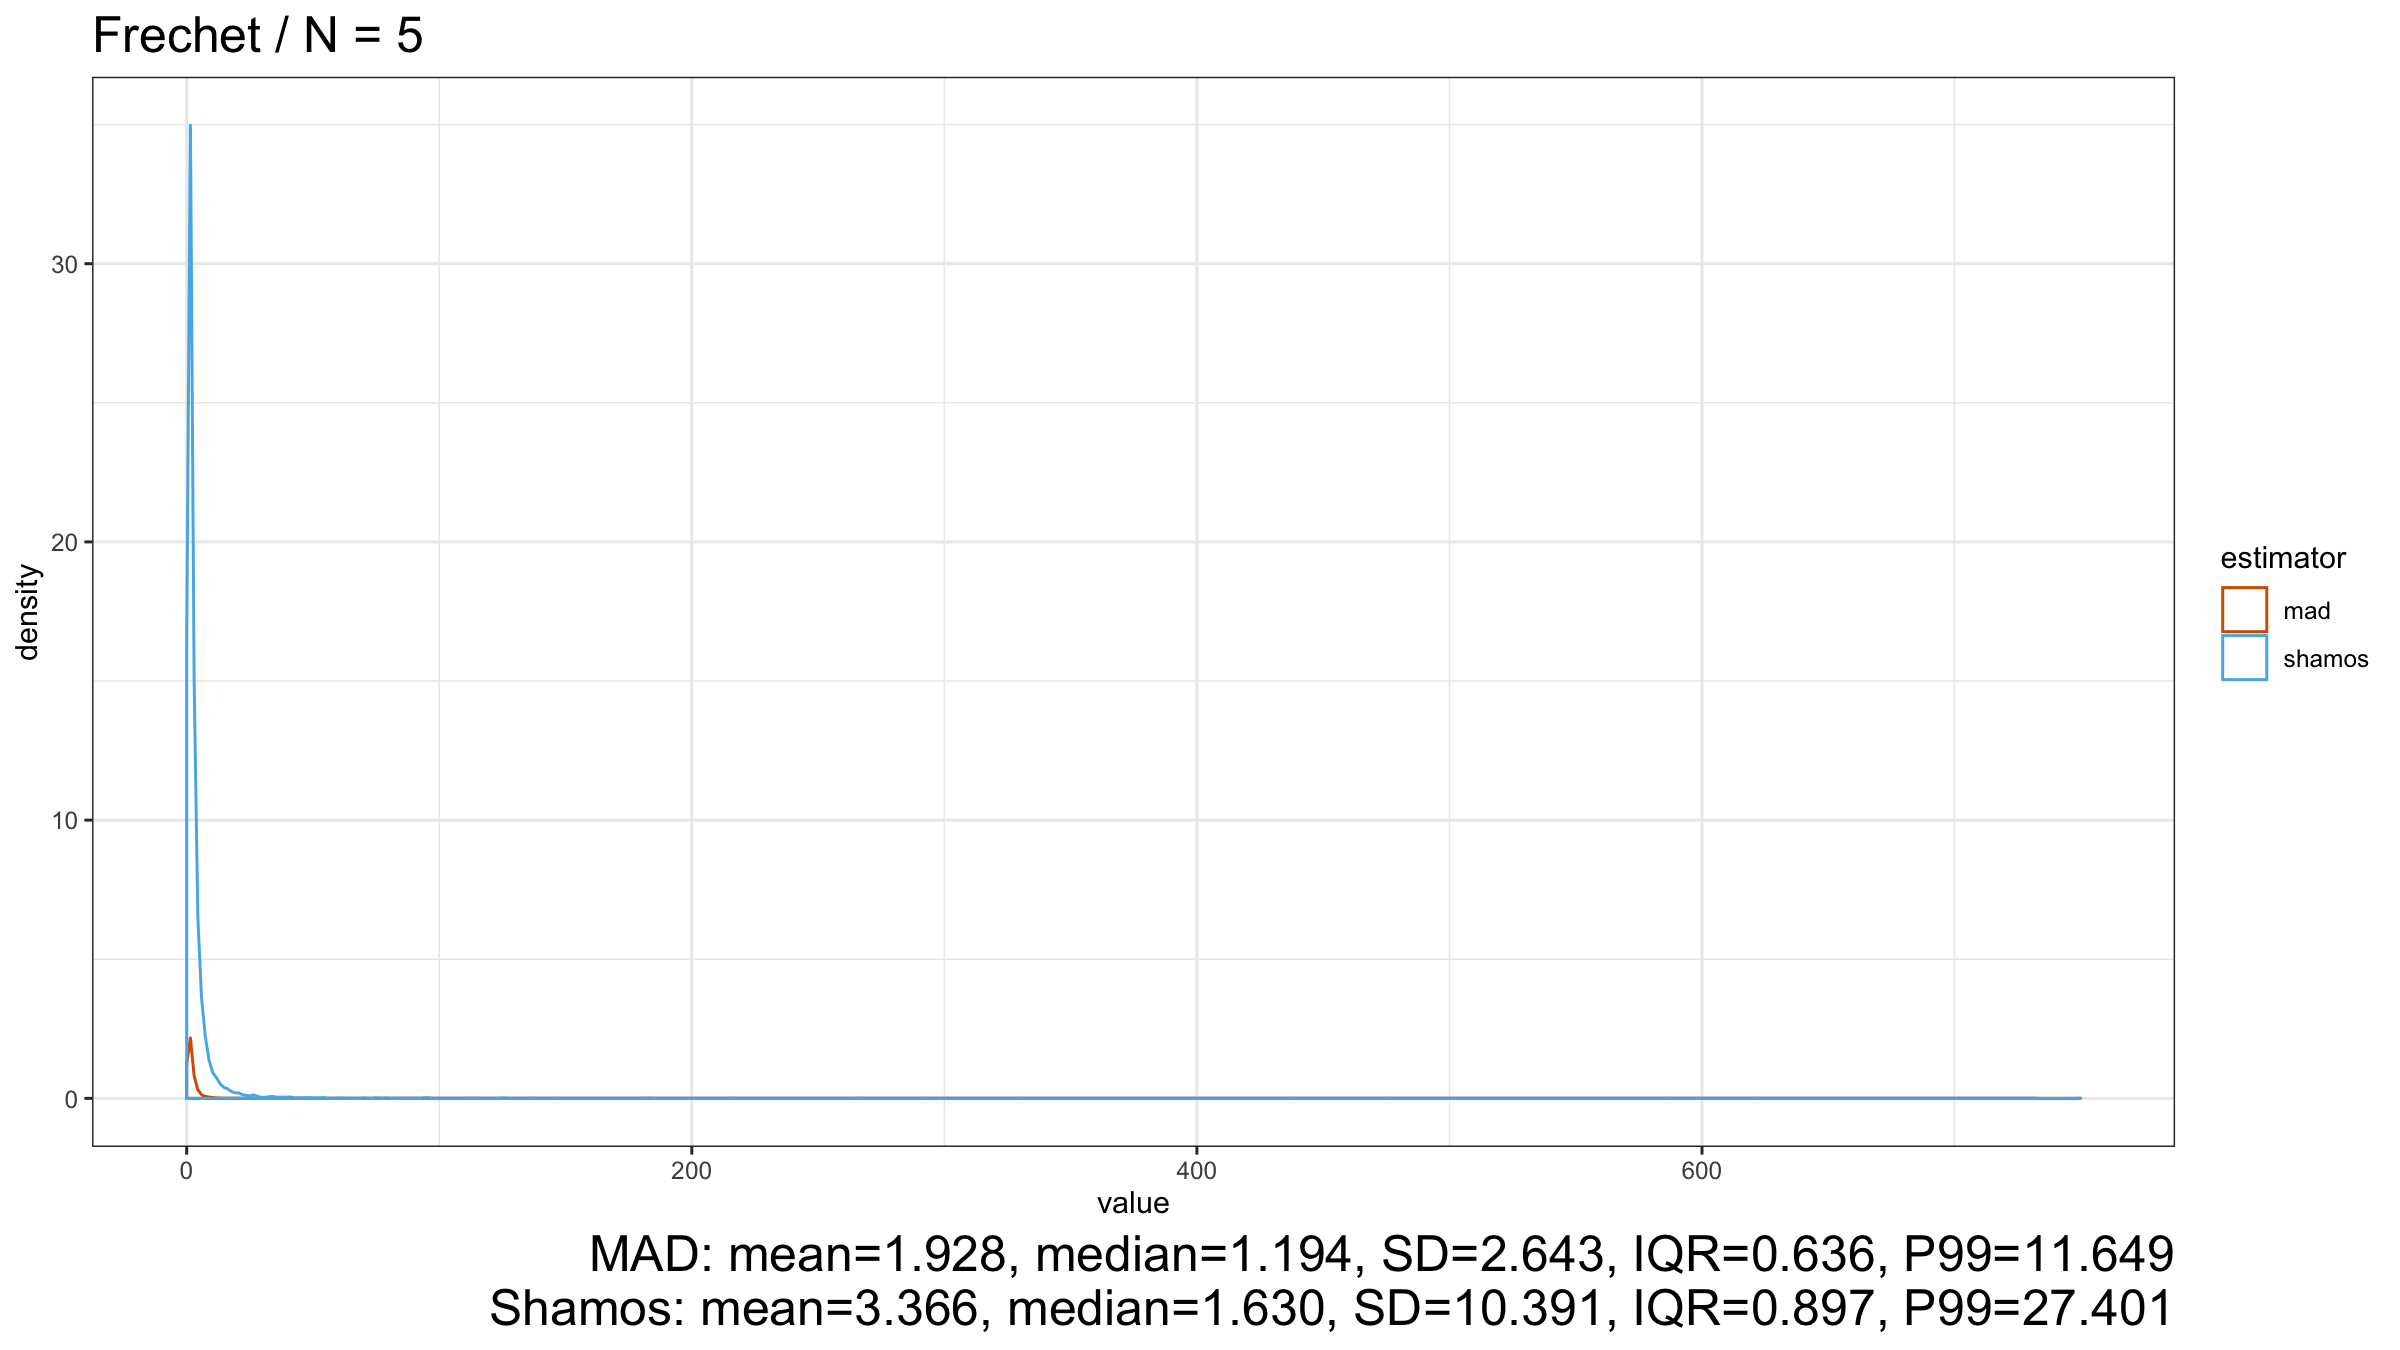
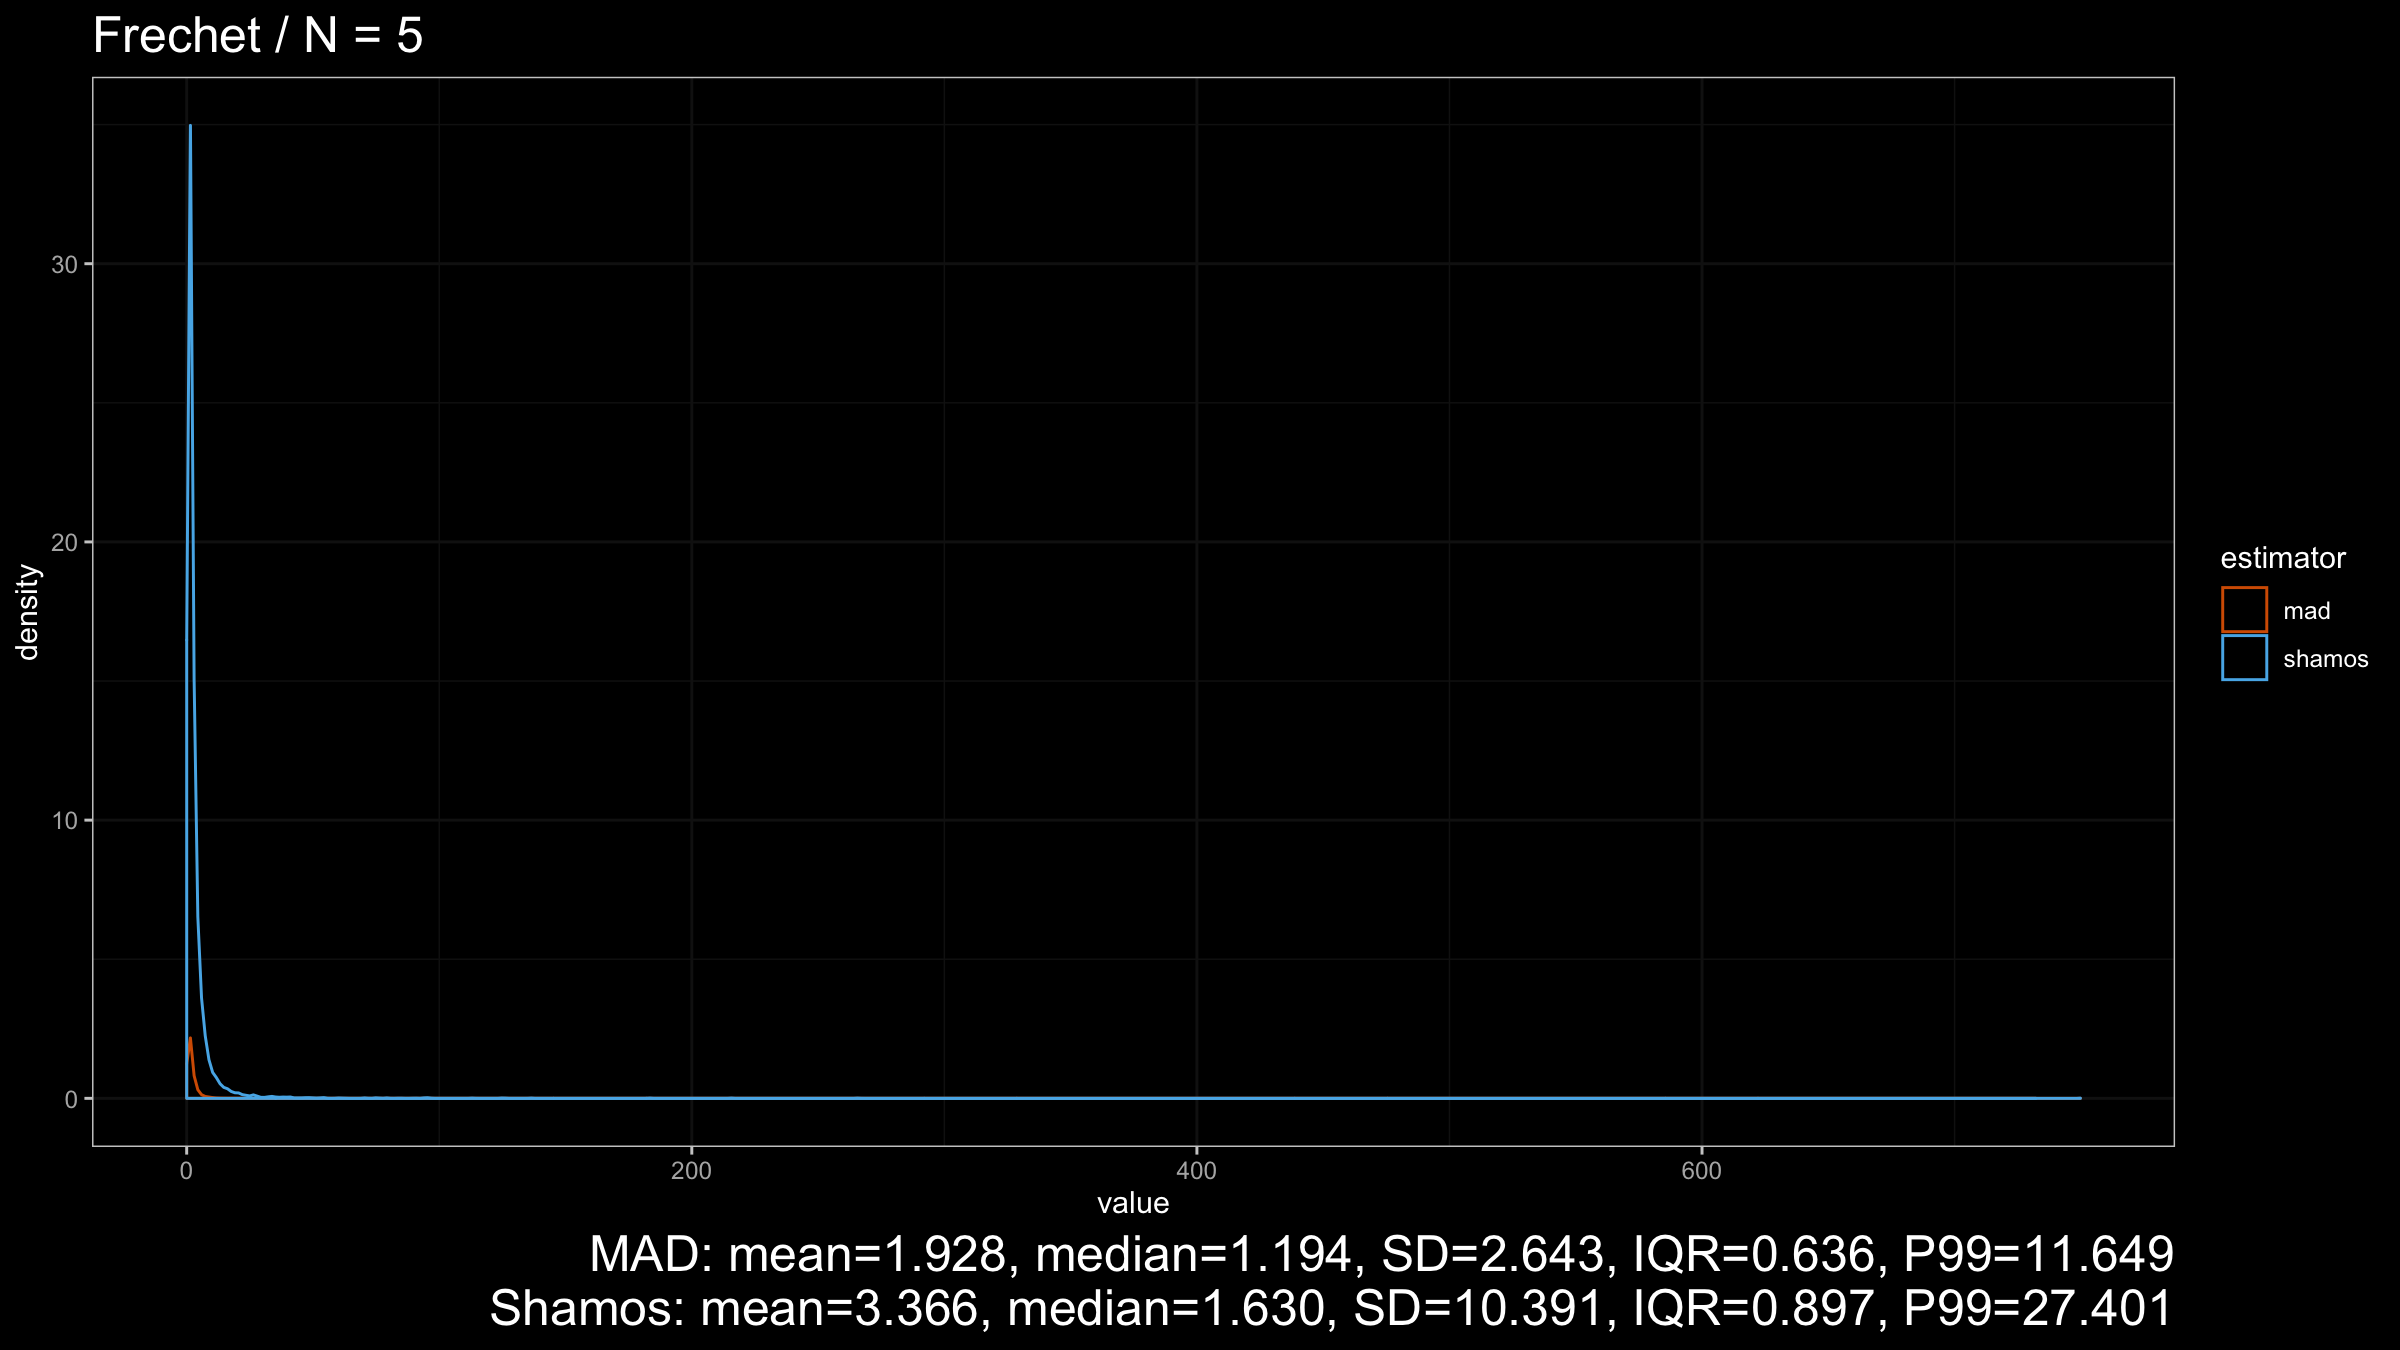
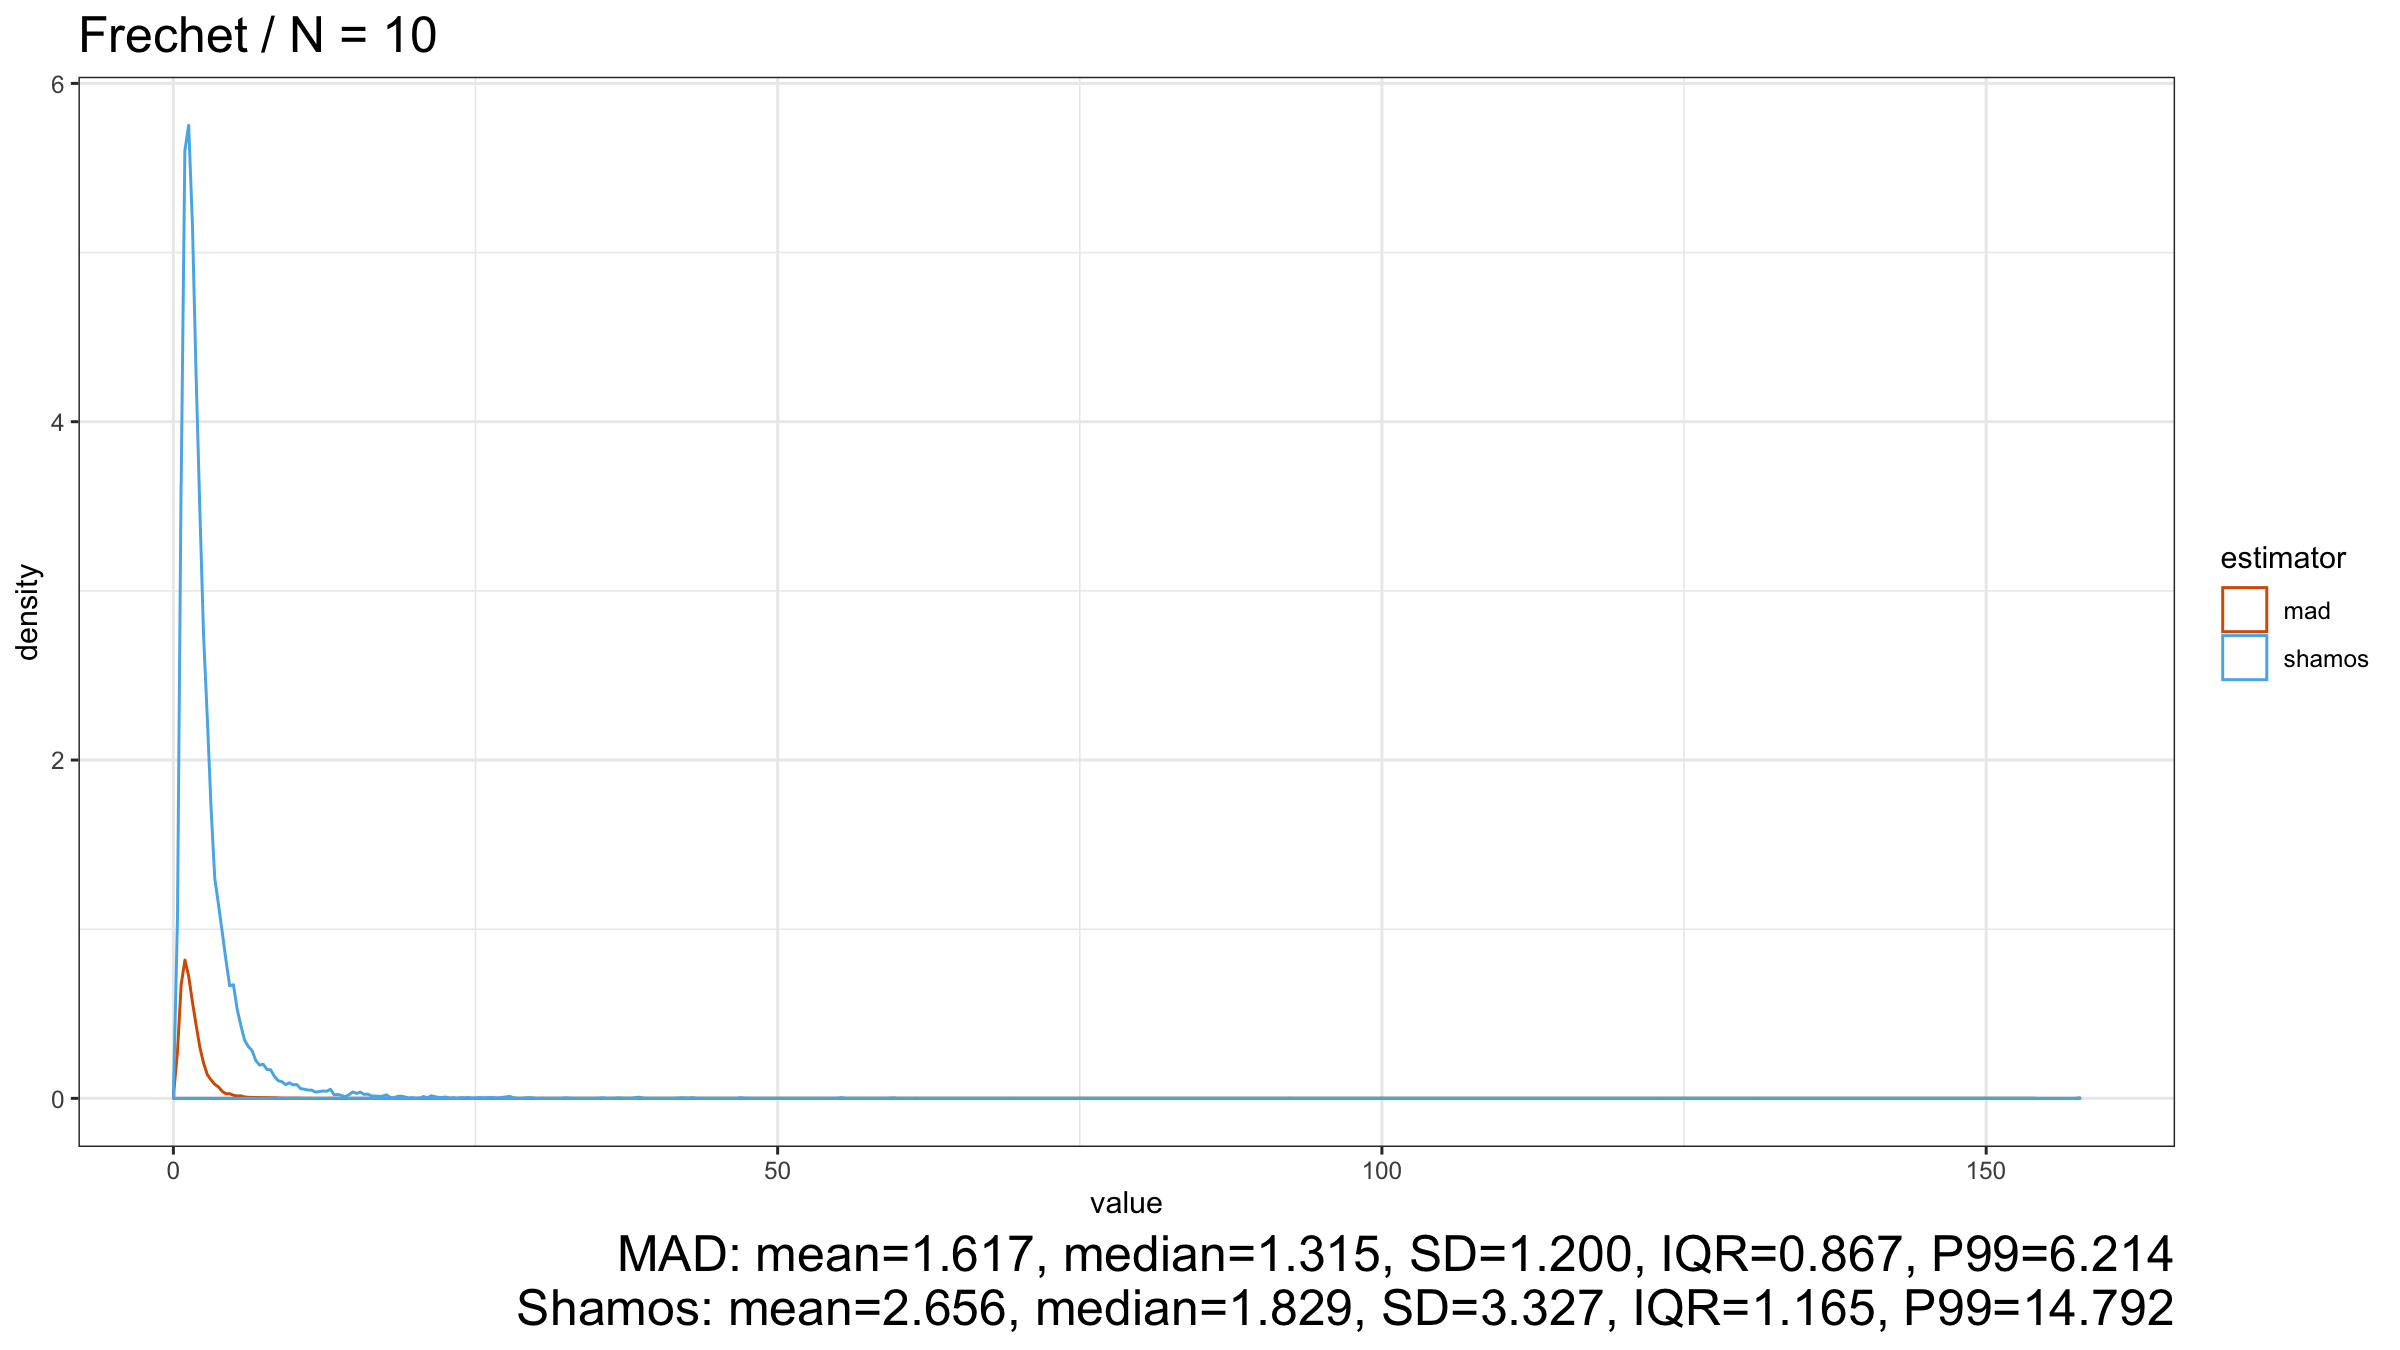
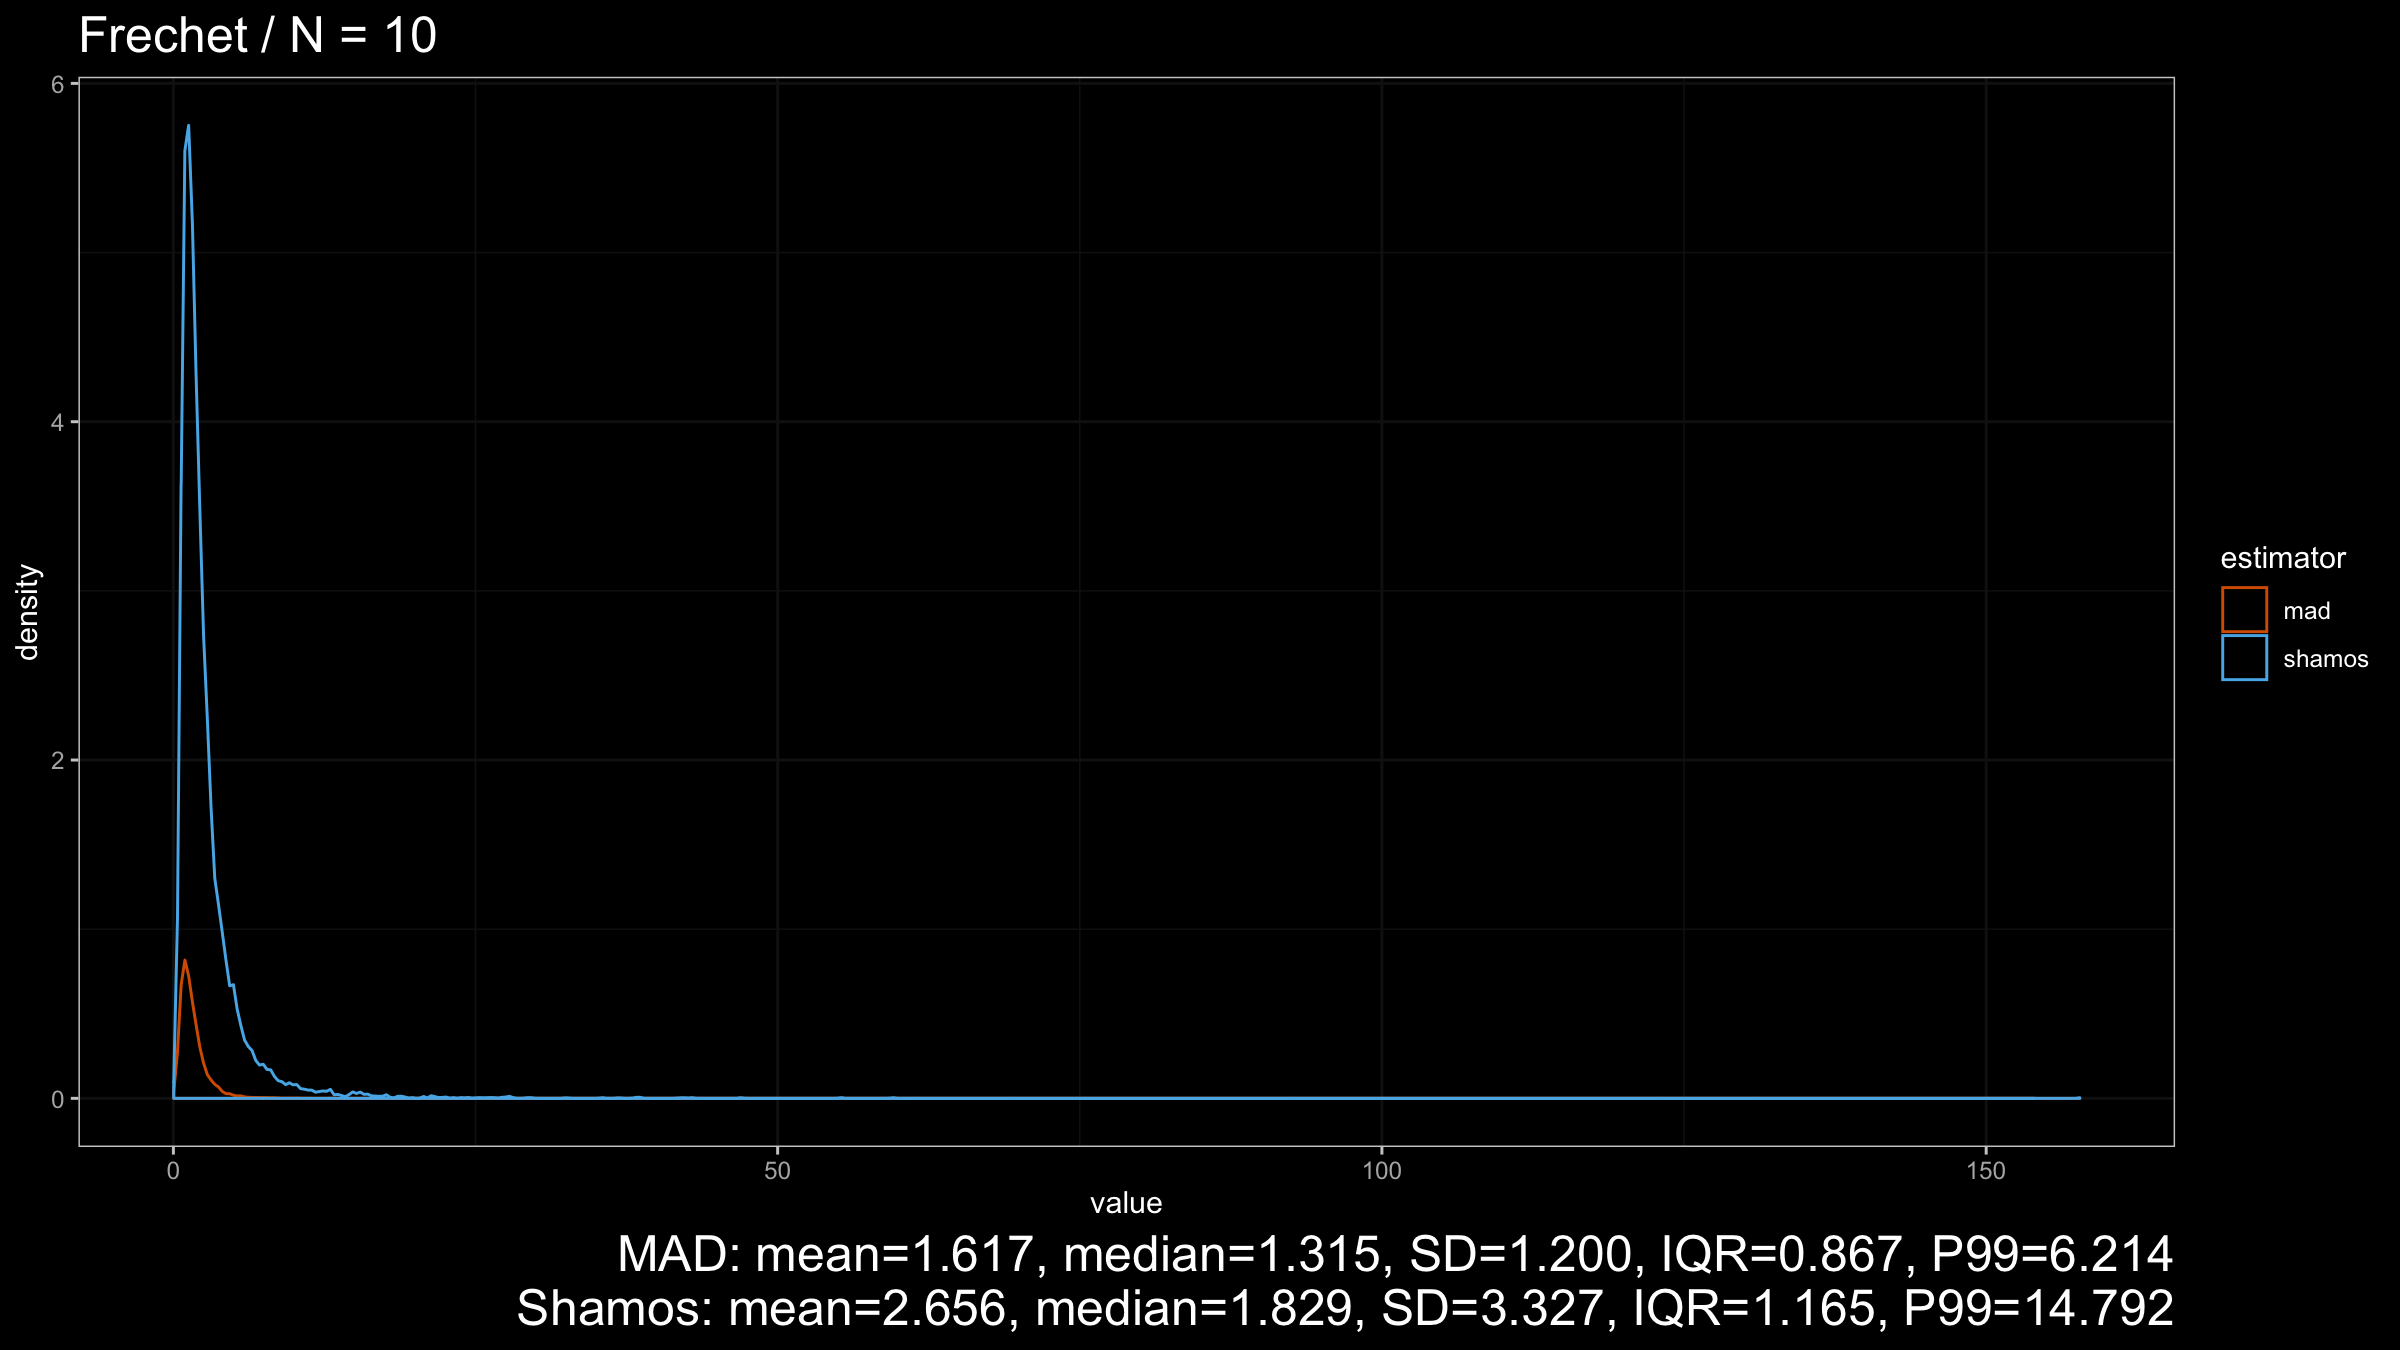
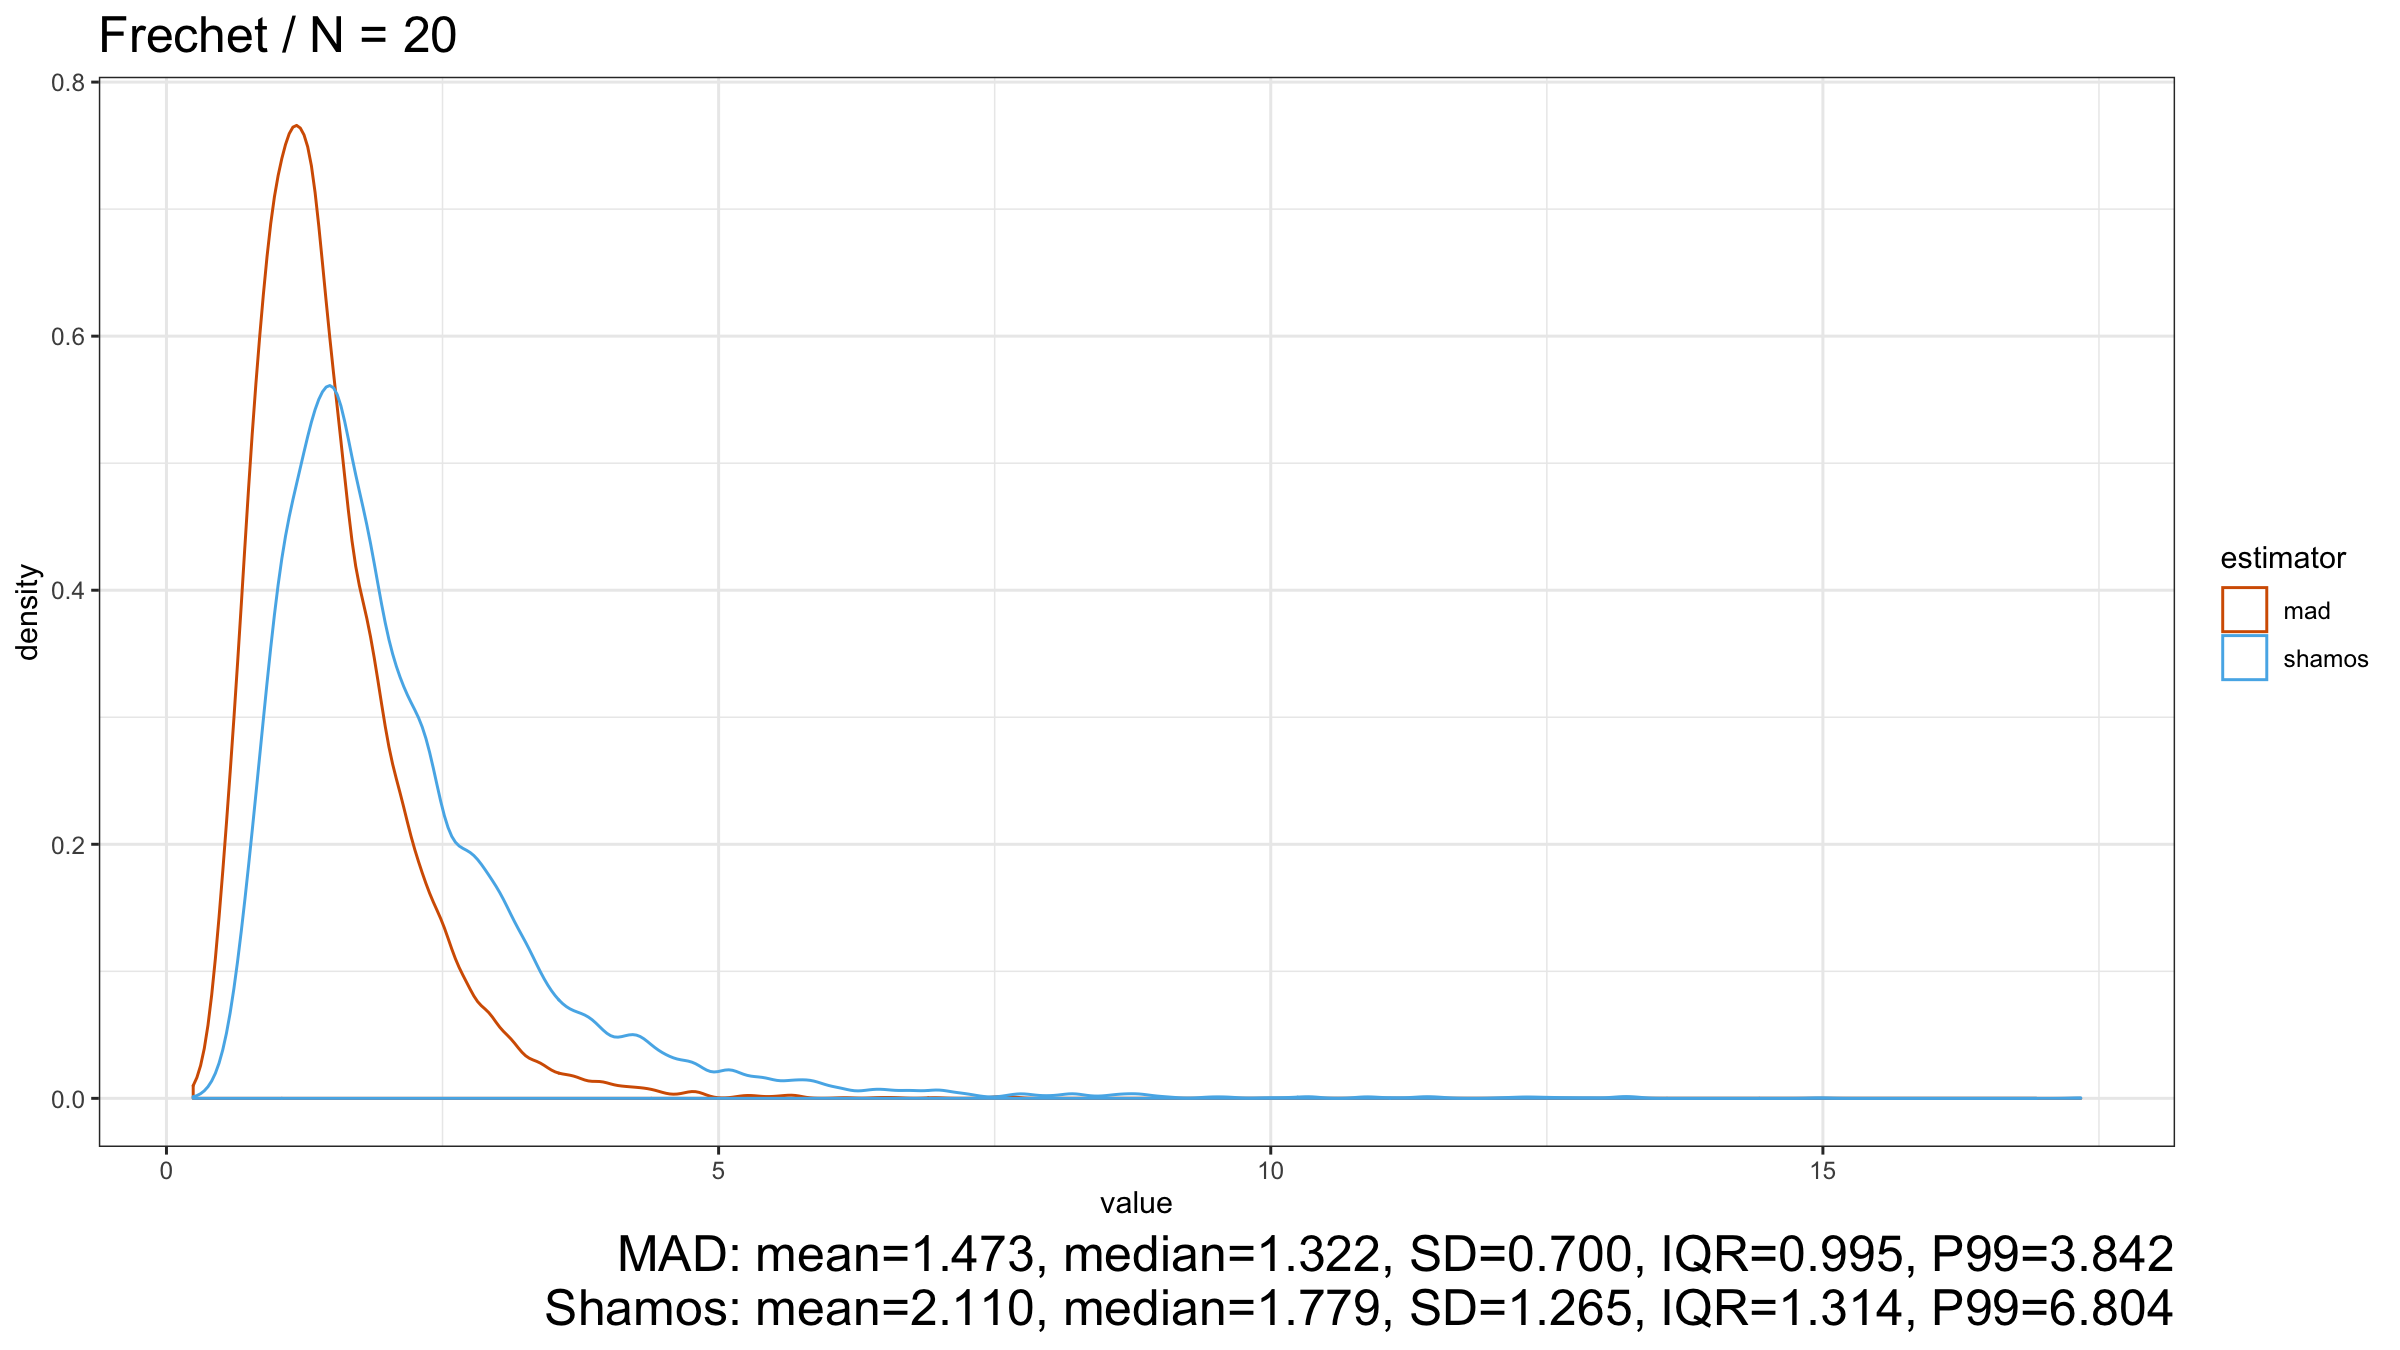
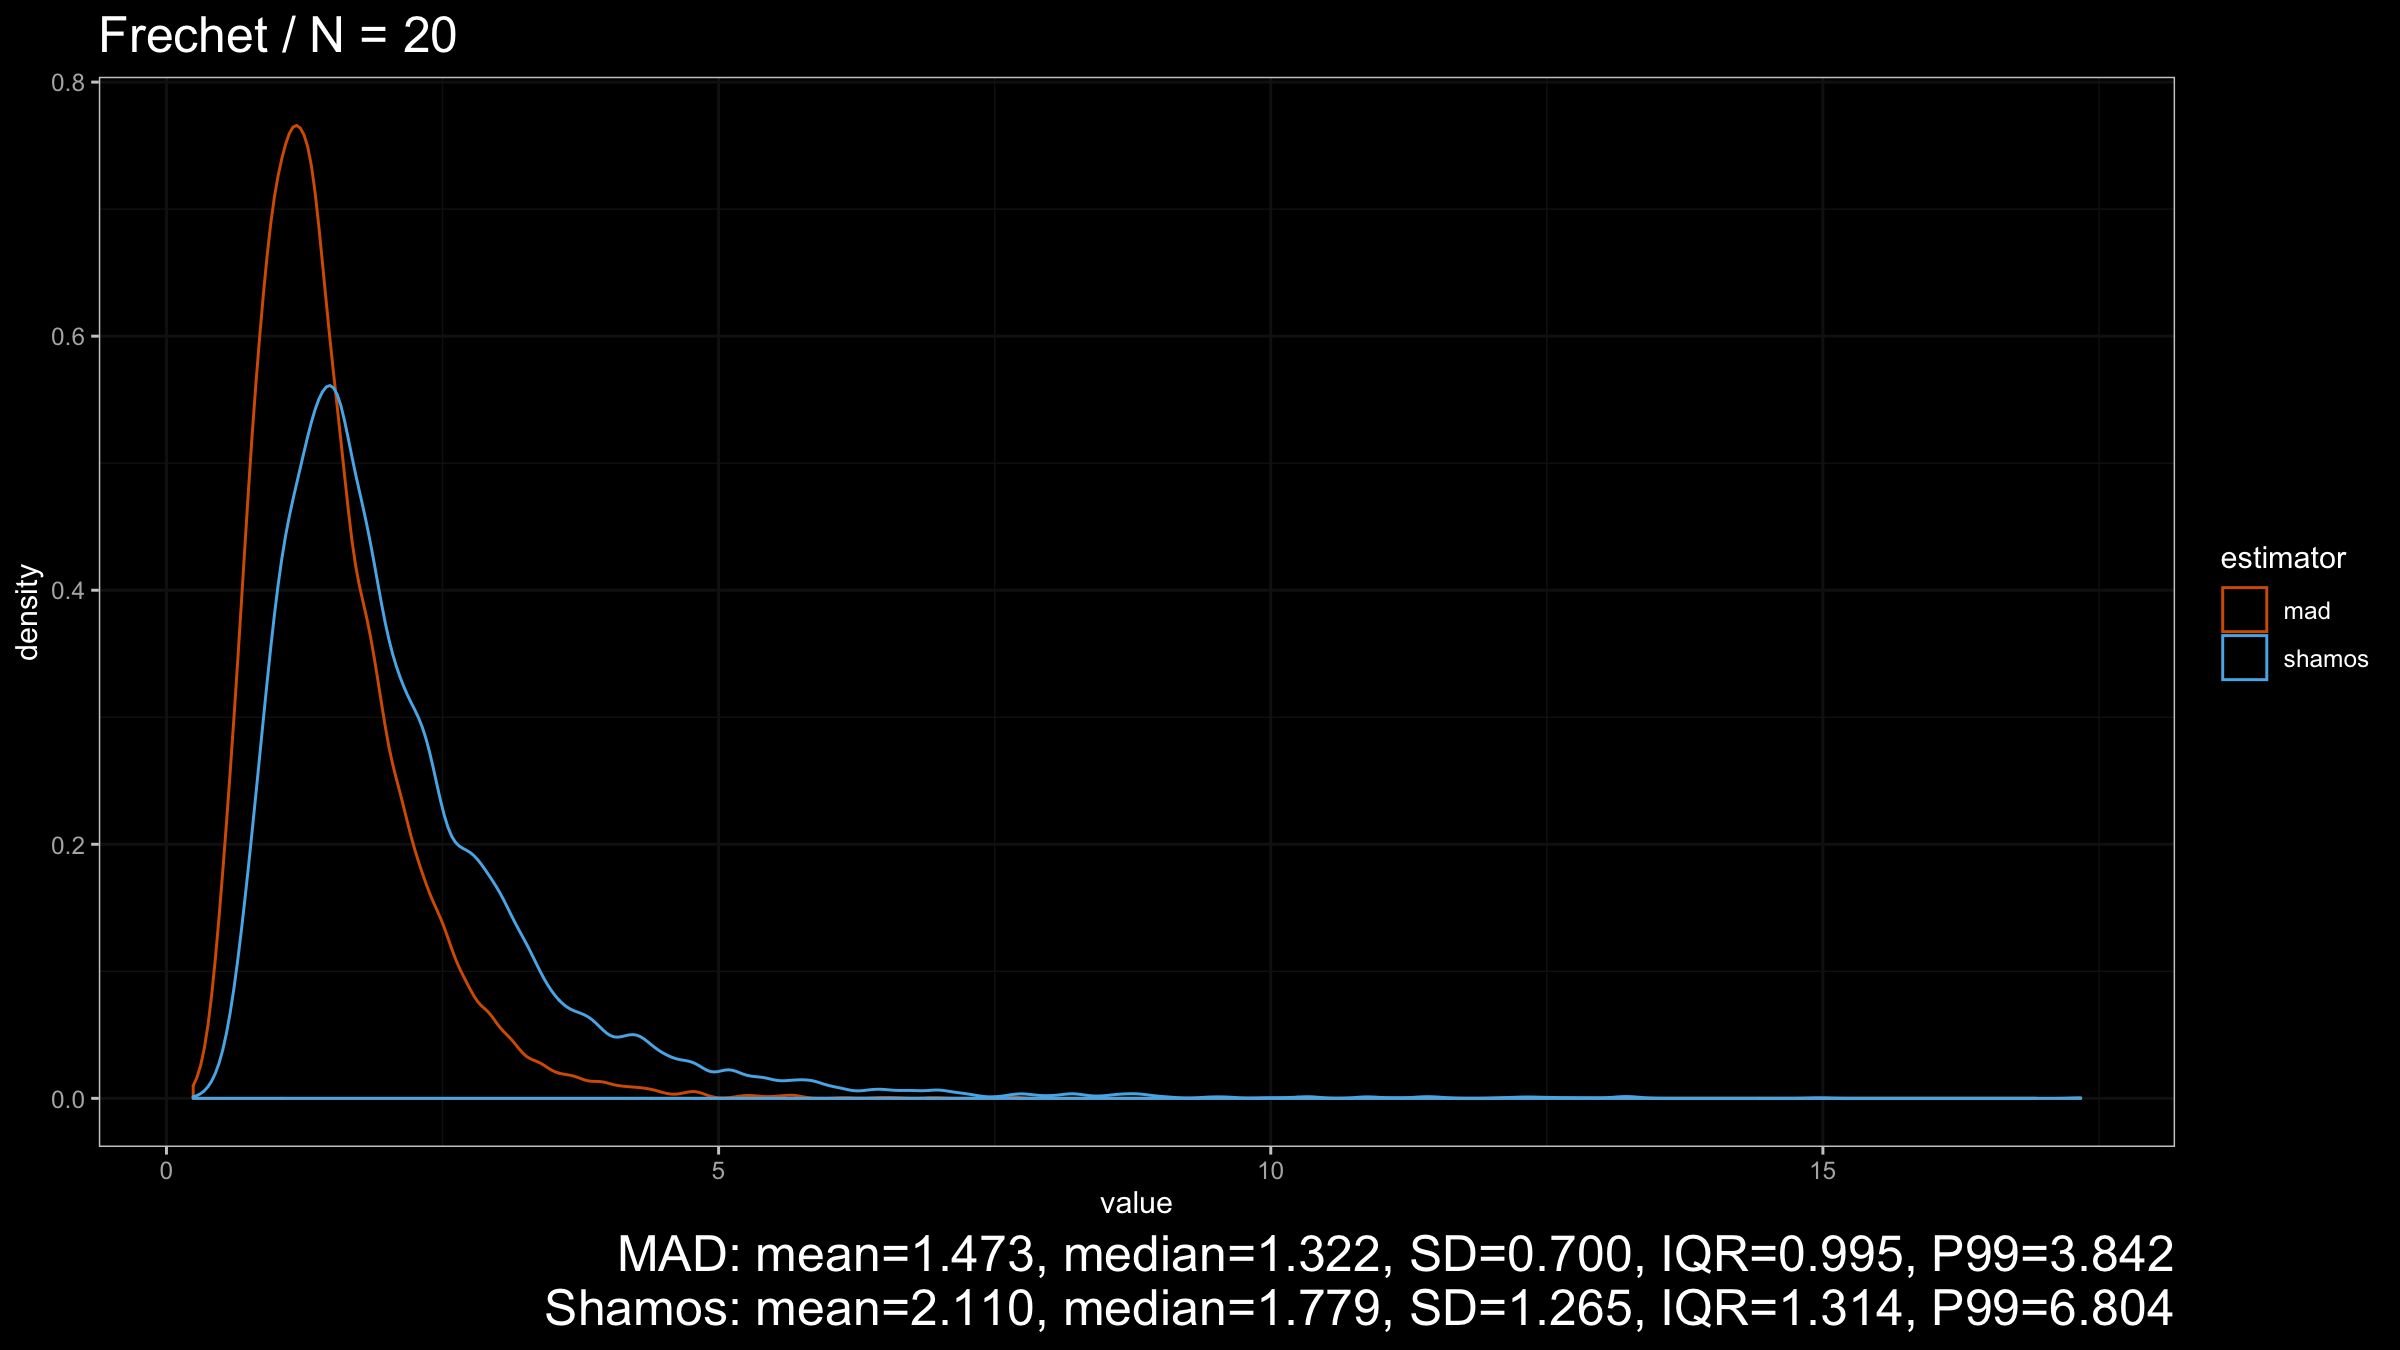
Next, let’s consider the heavy-tailed Cauchy distribution (which has infinity variance):
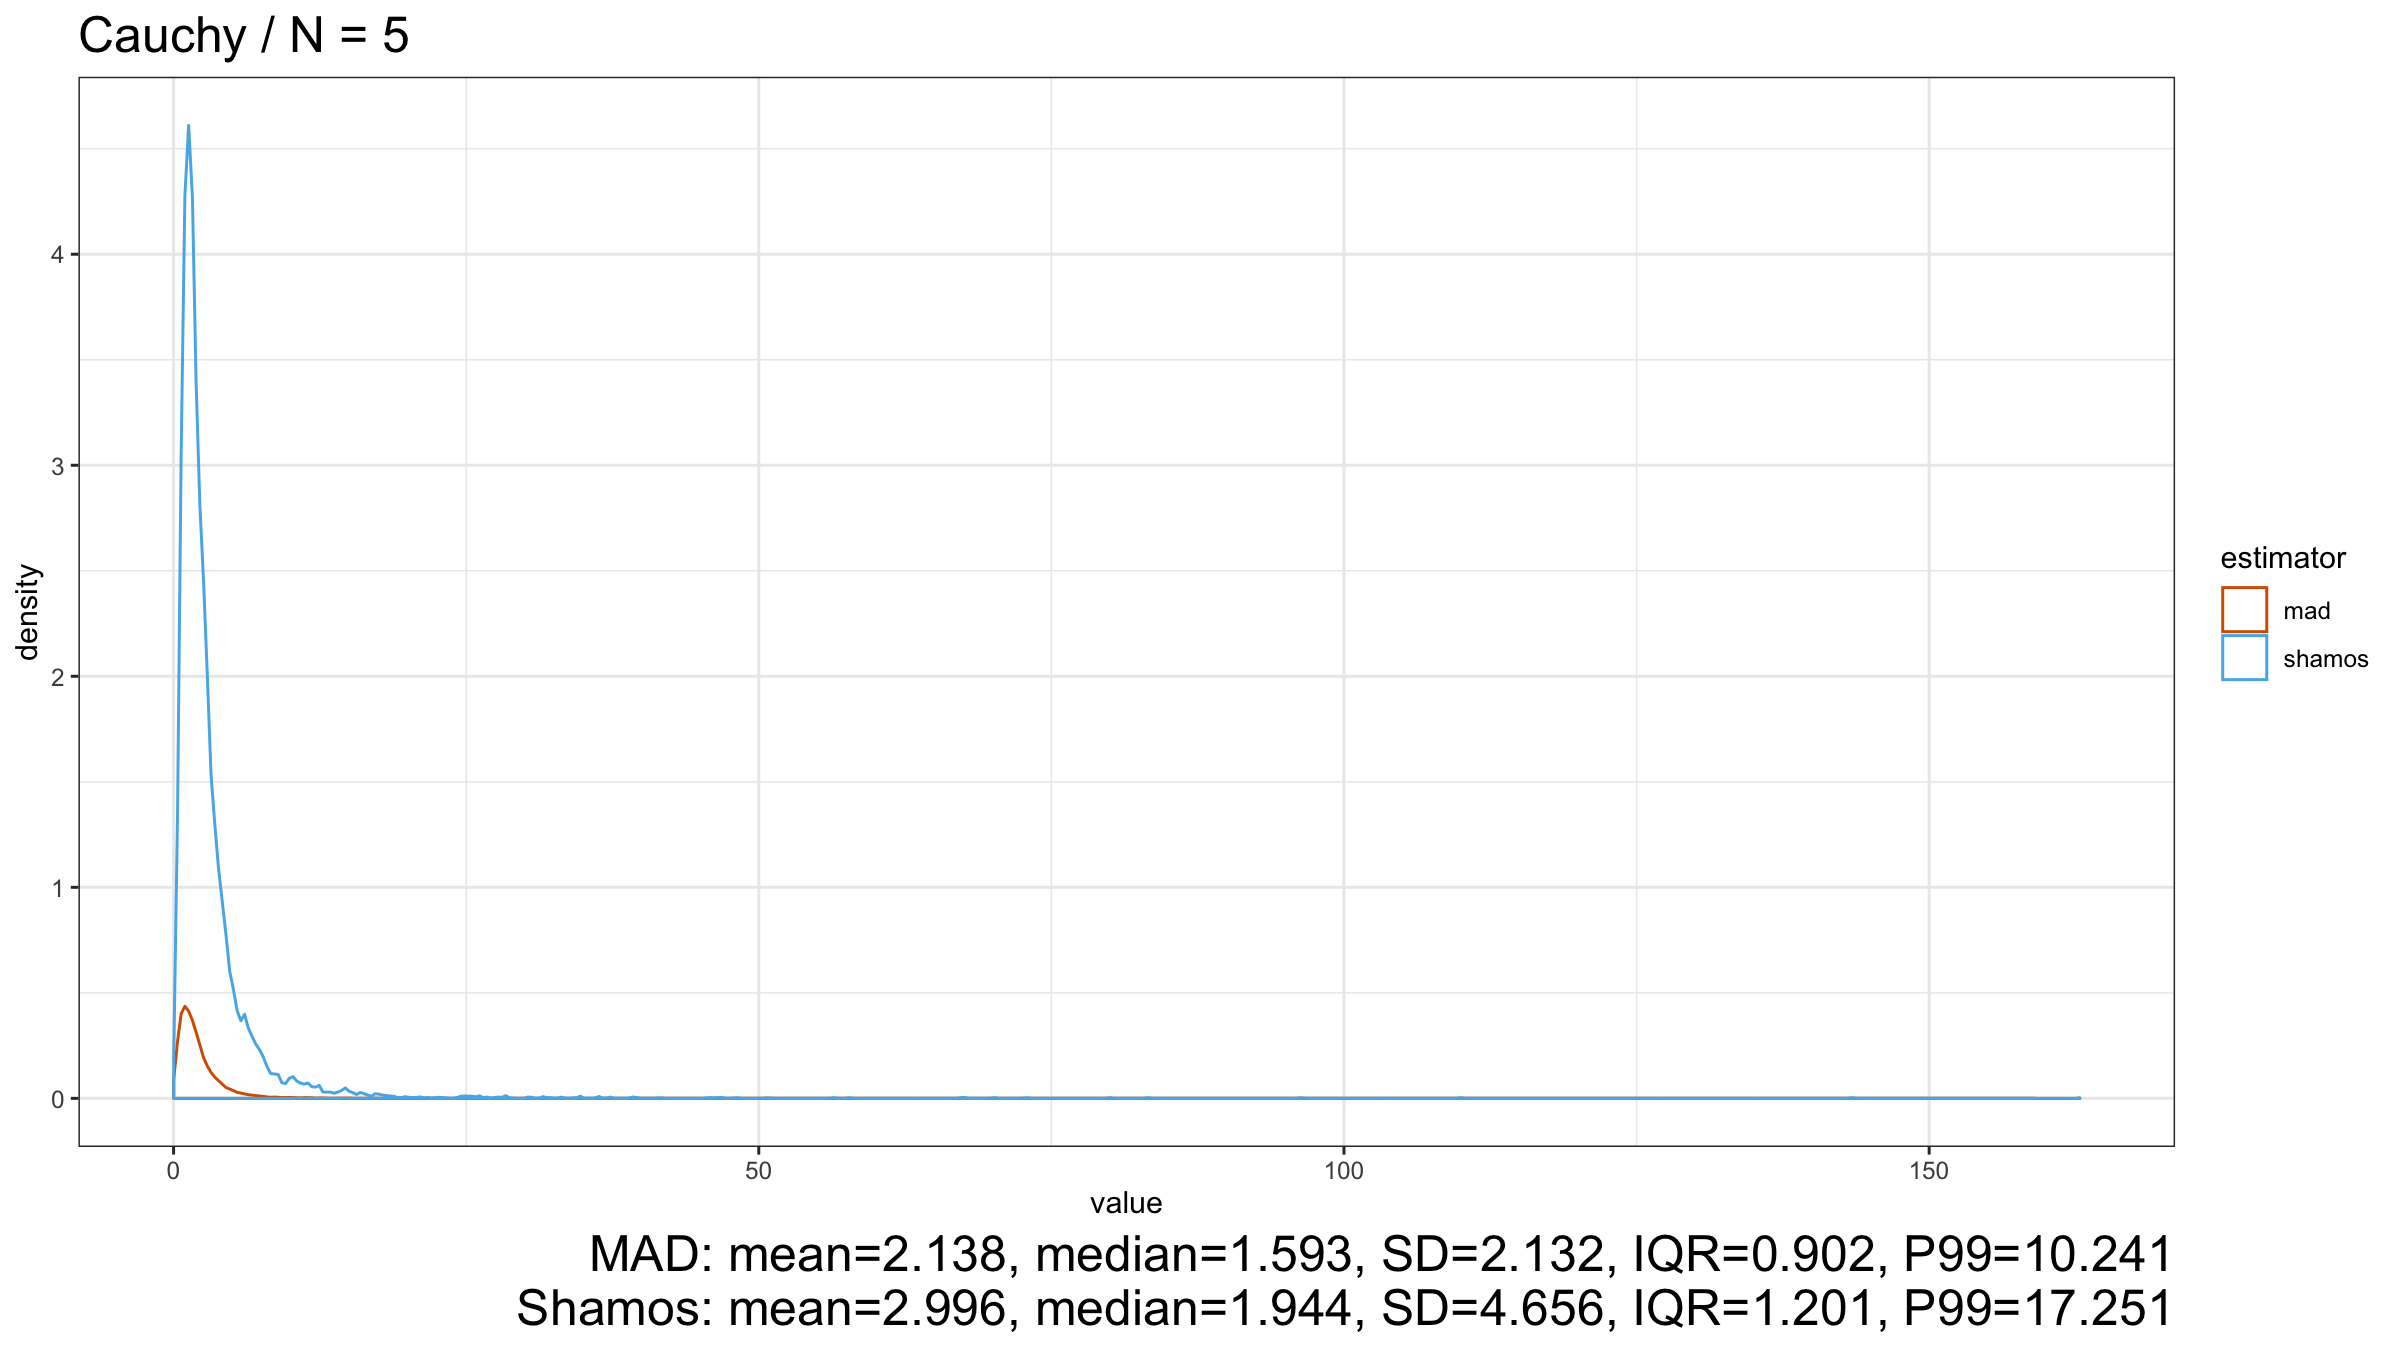
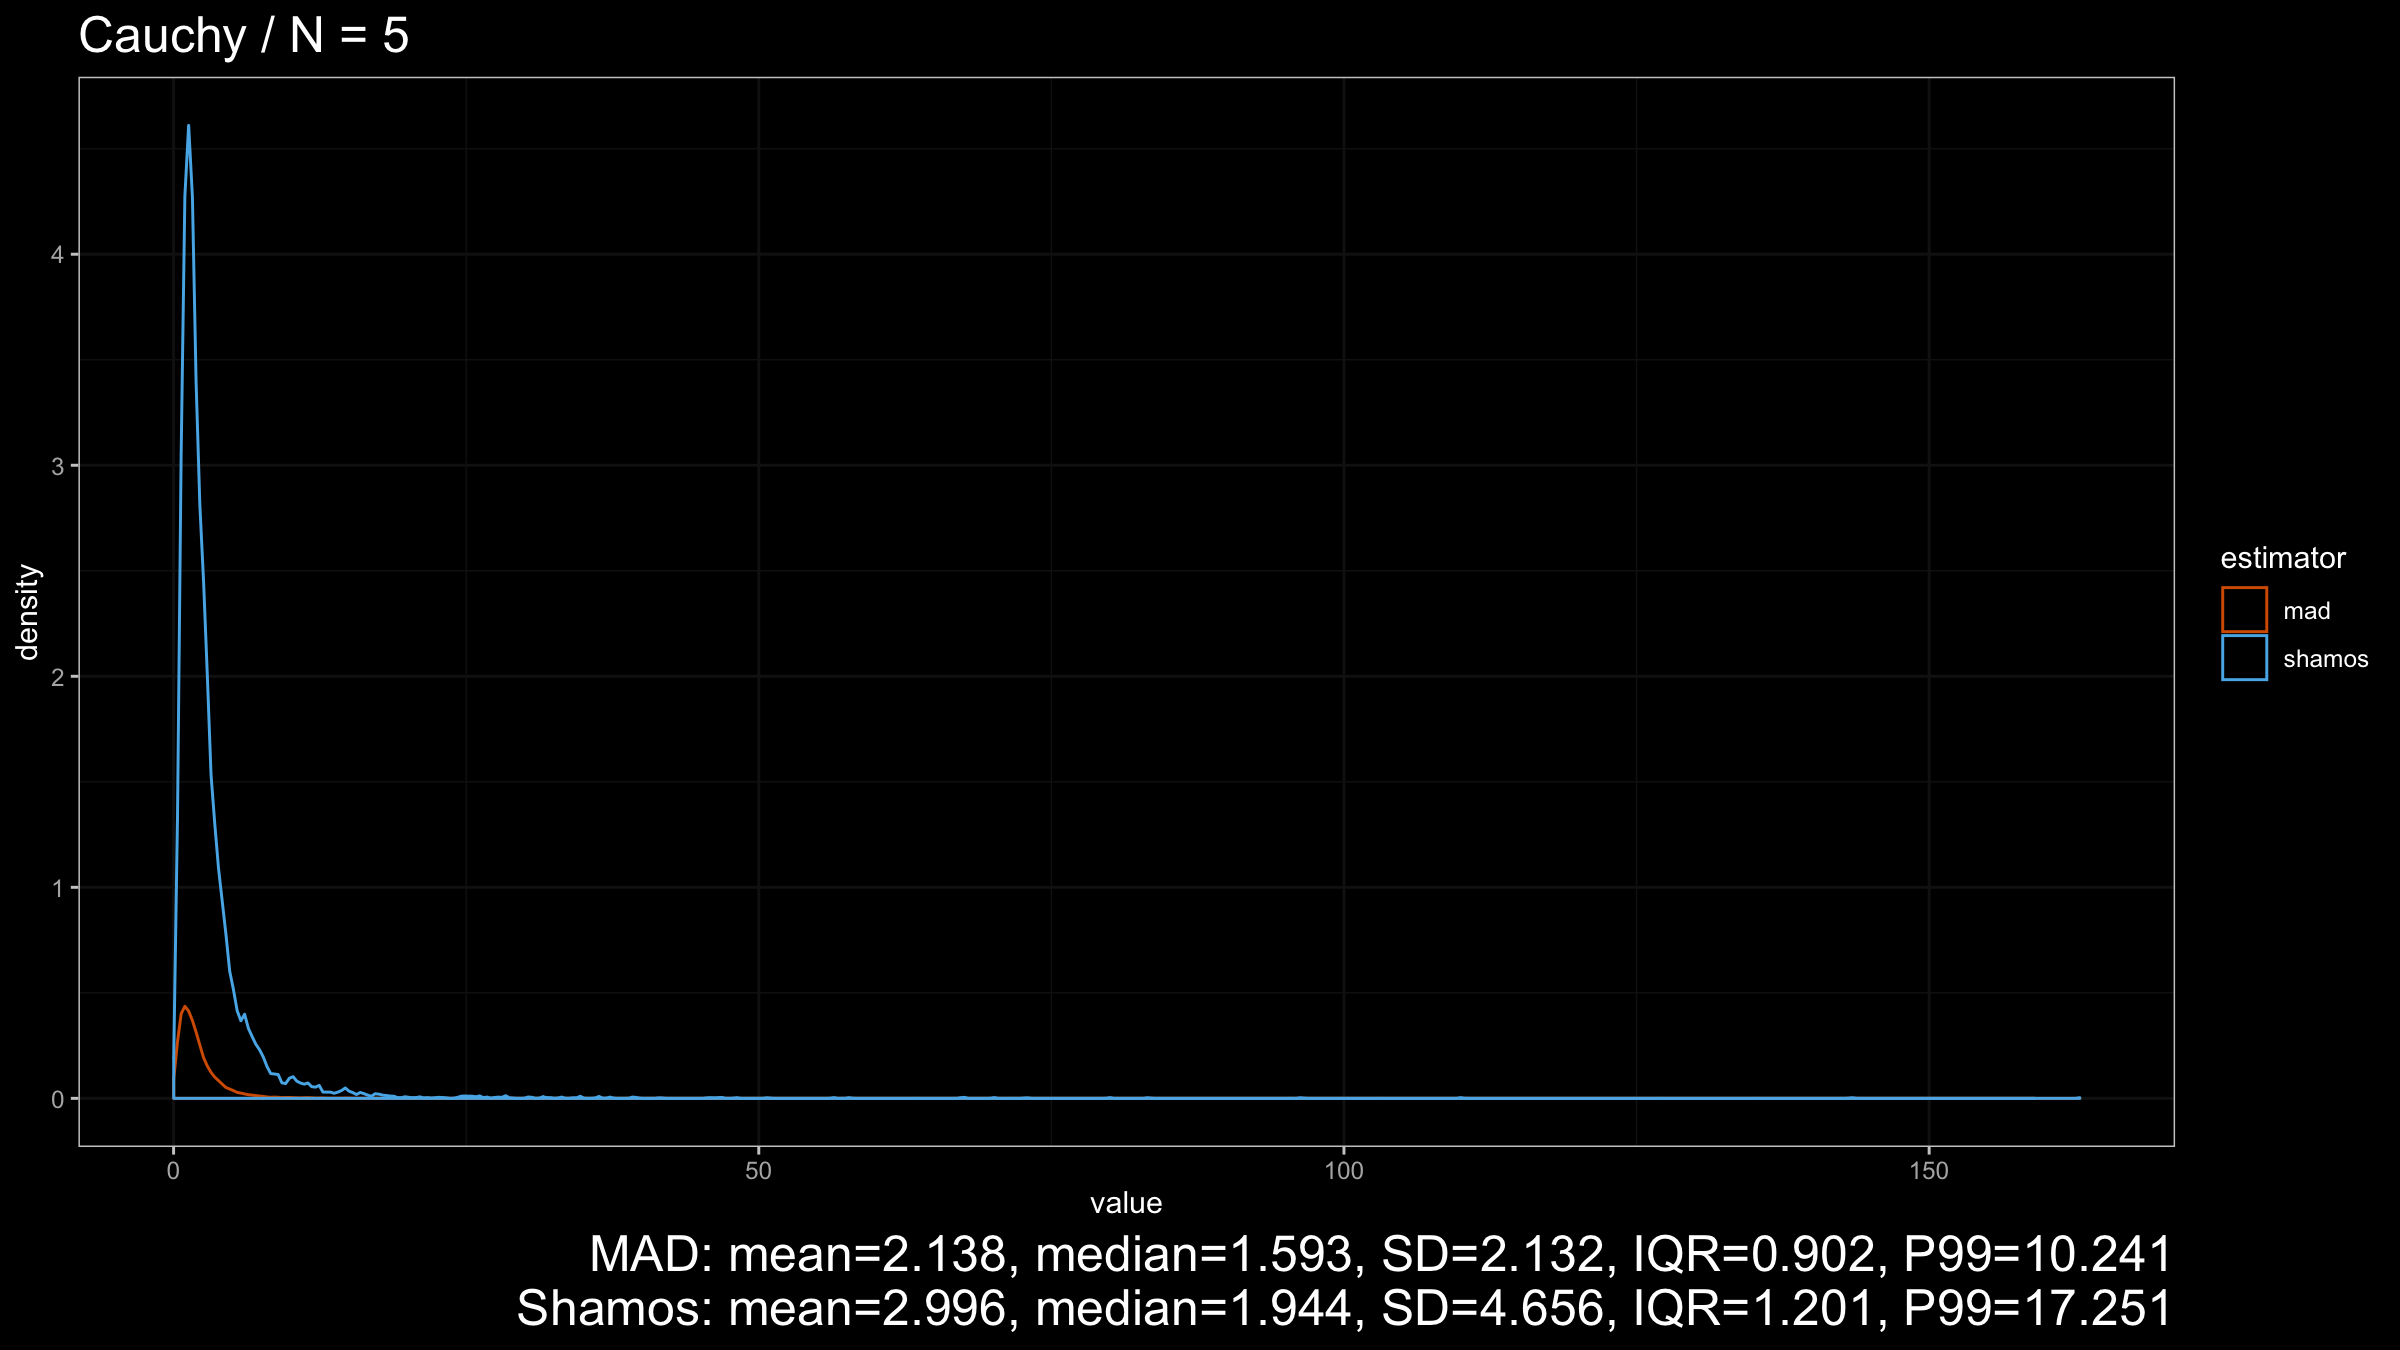

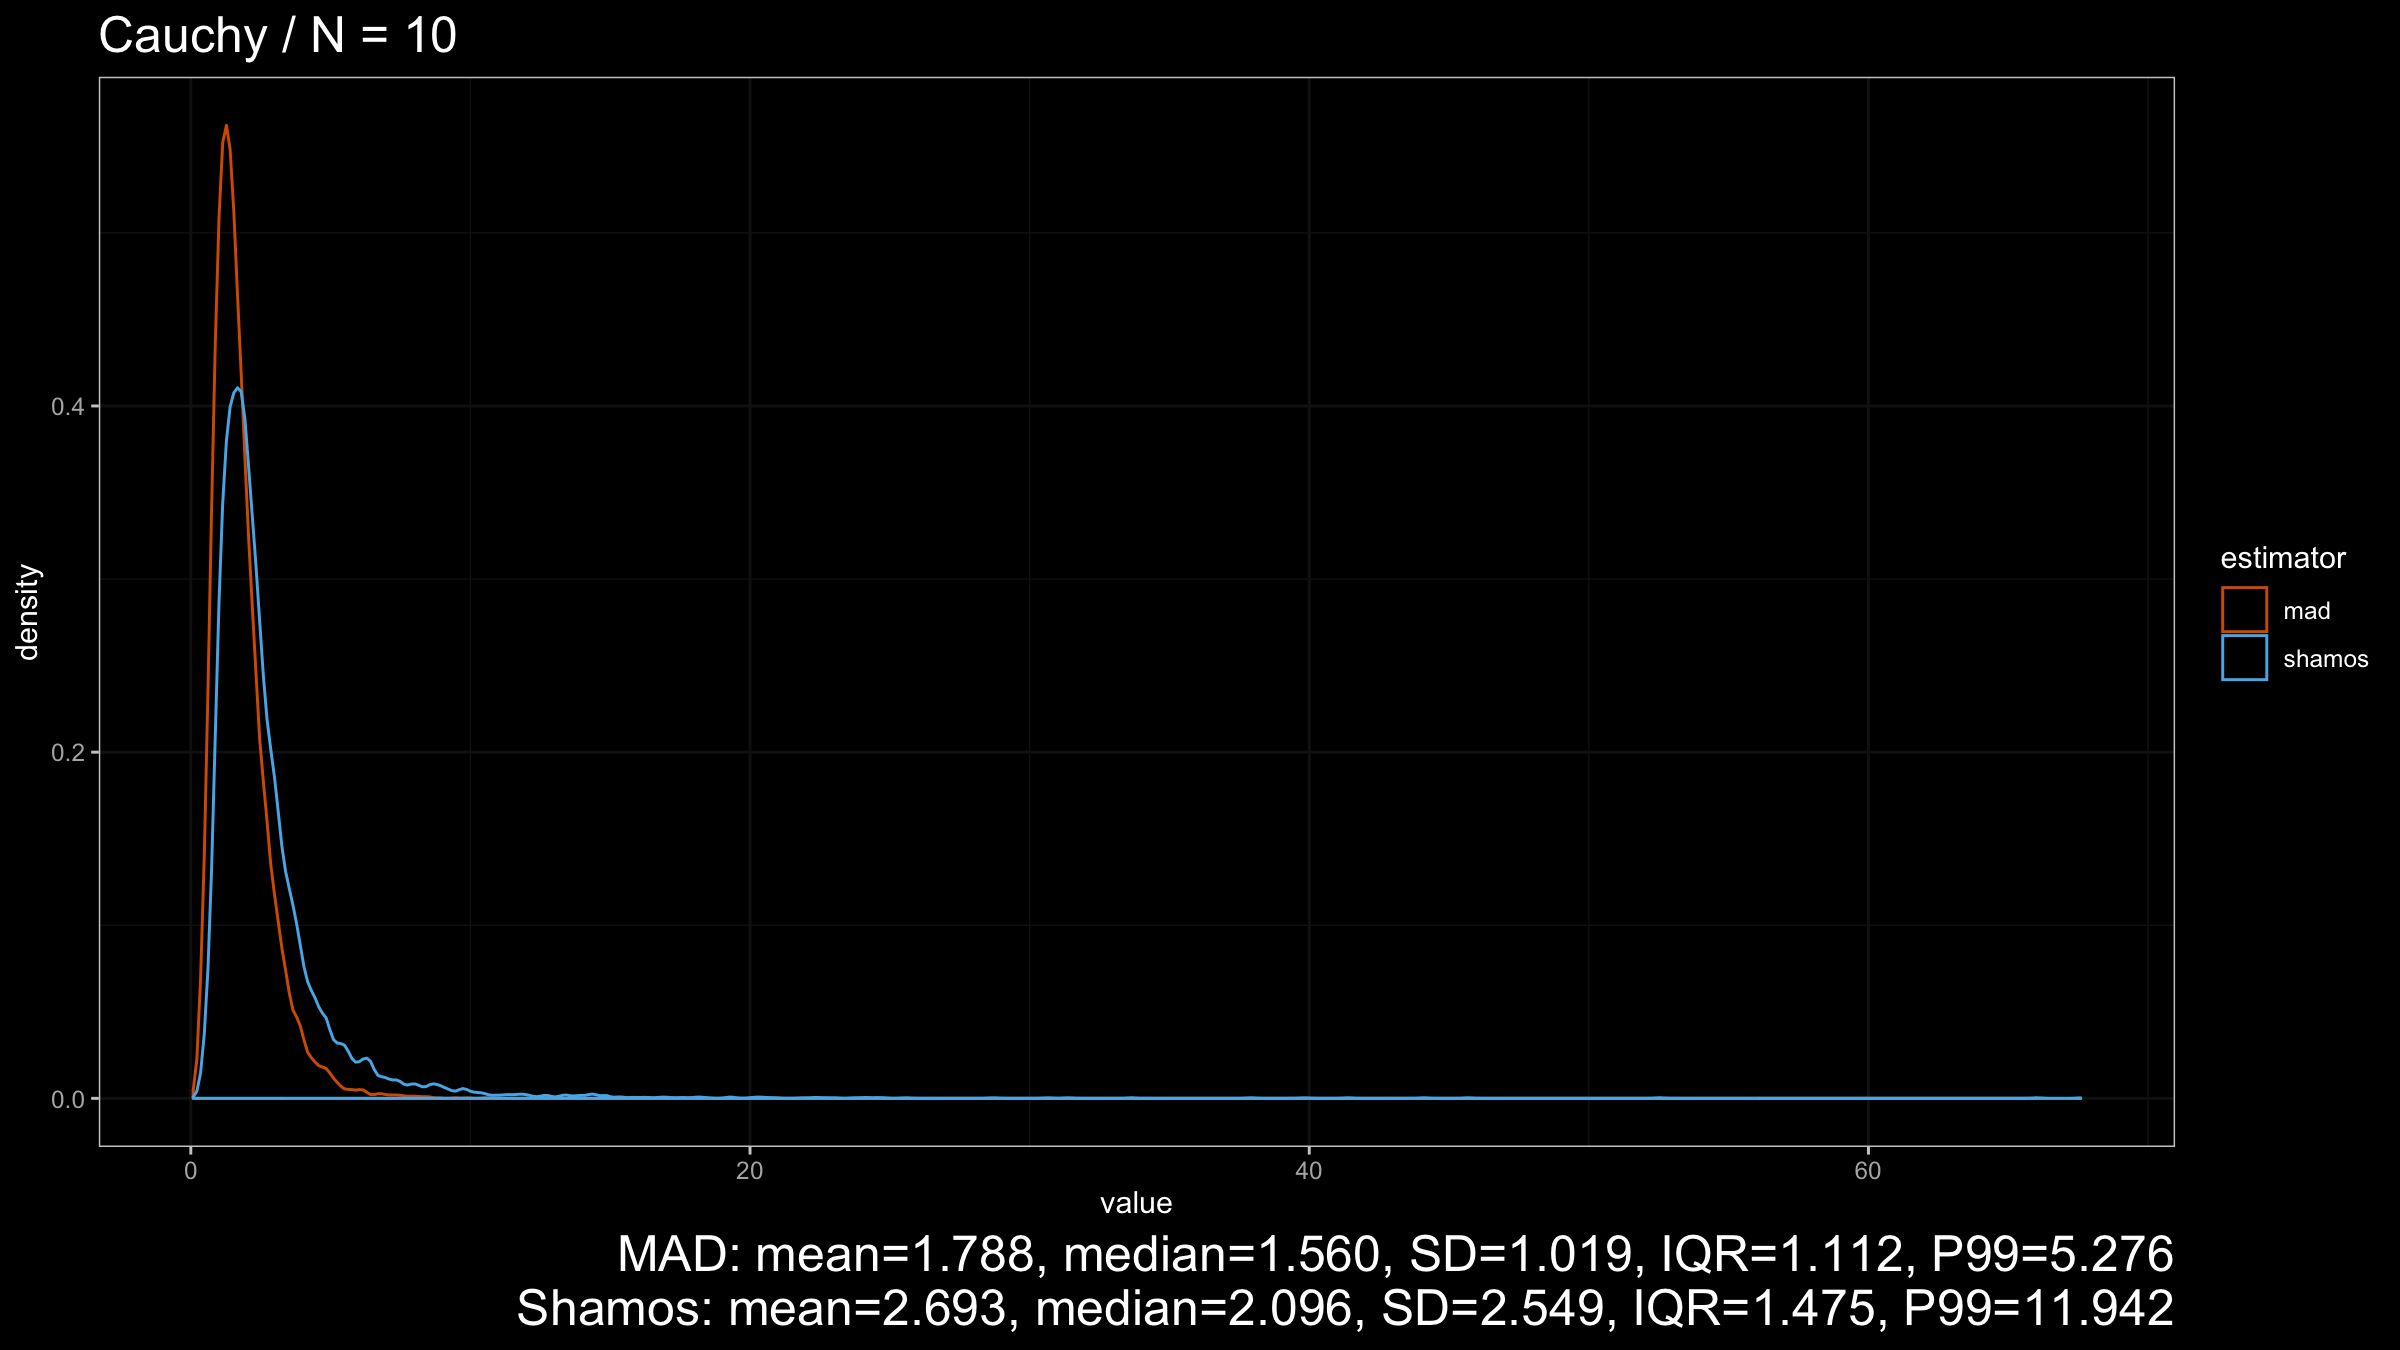
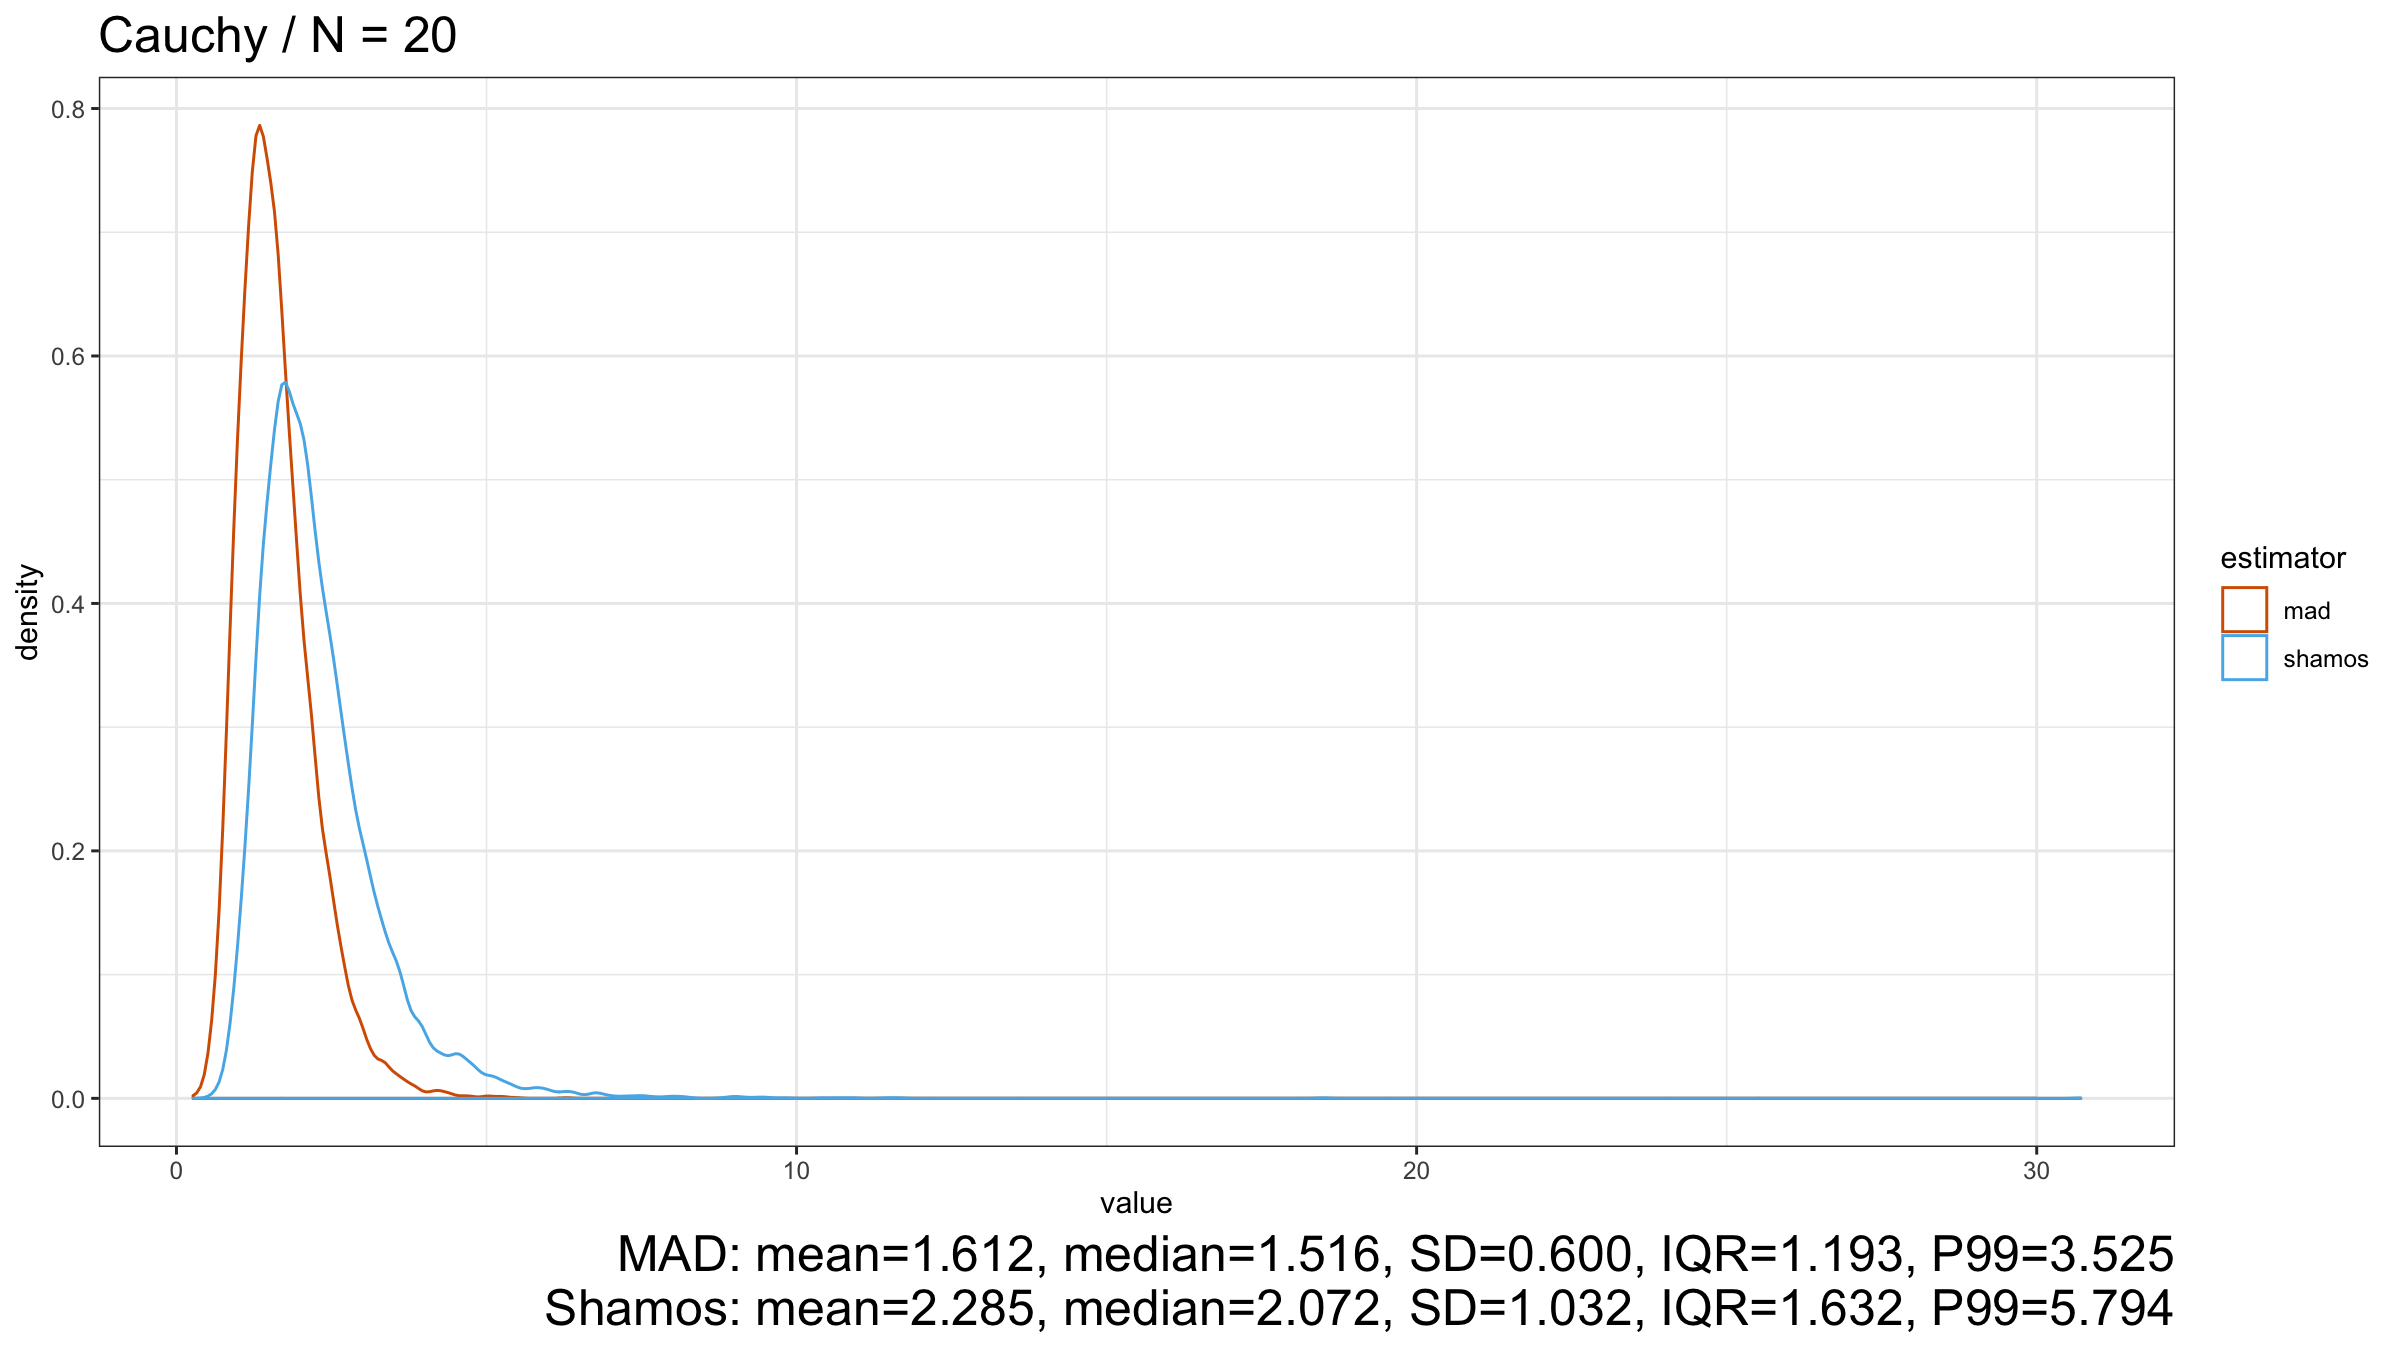
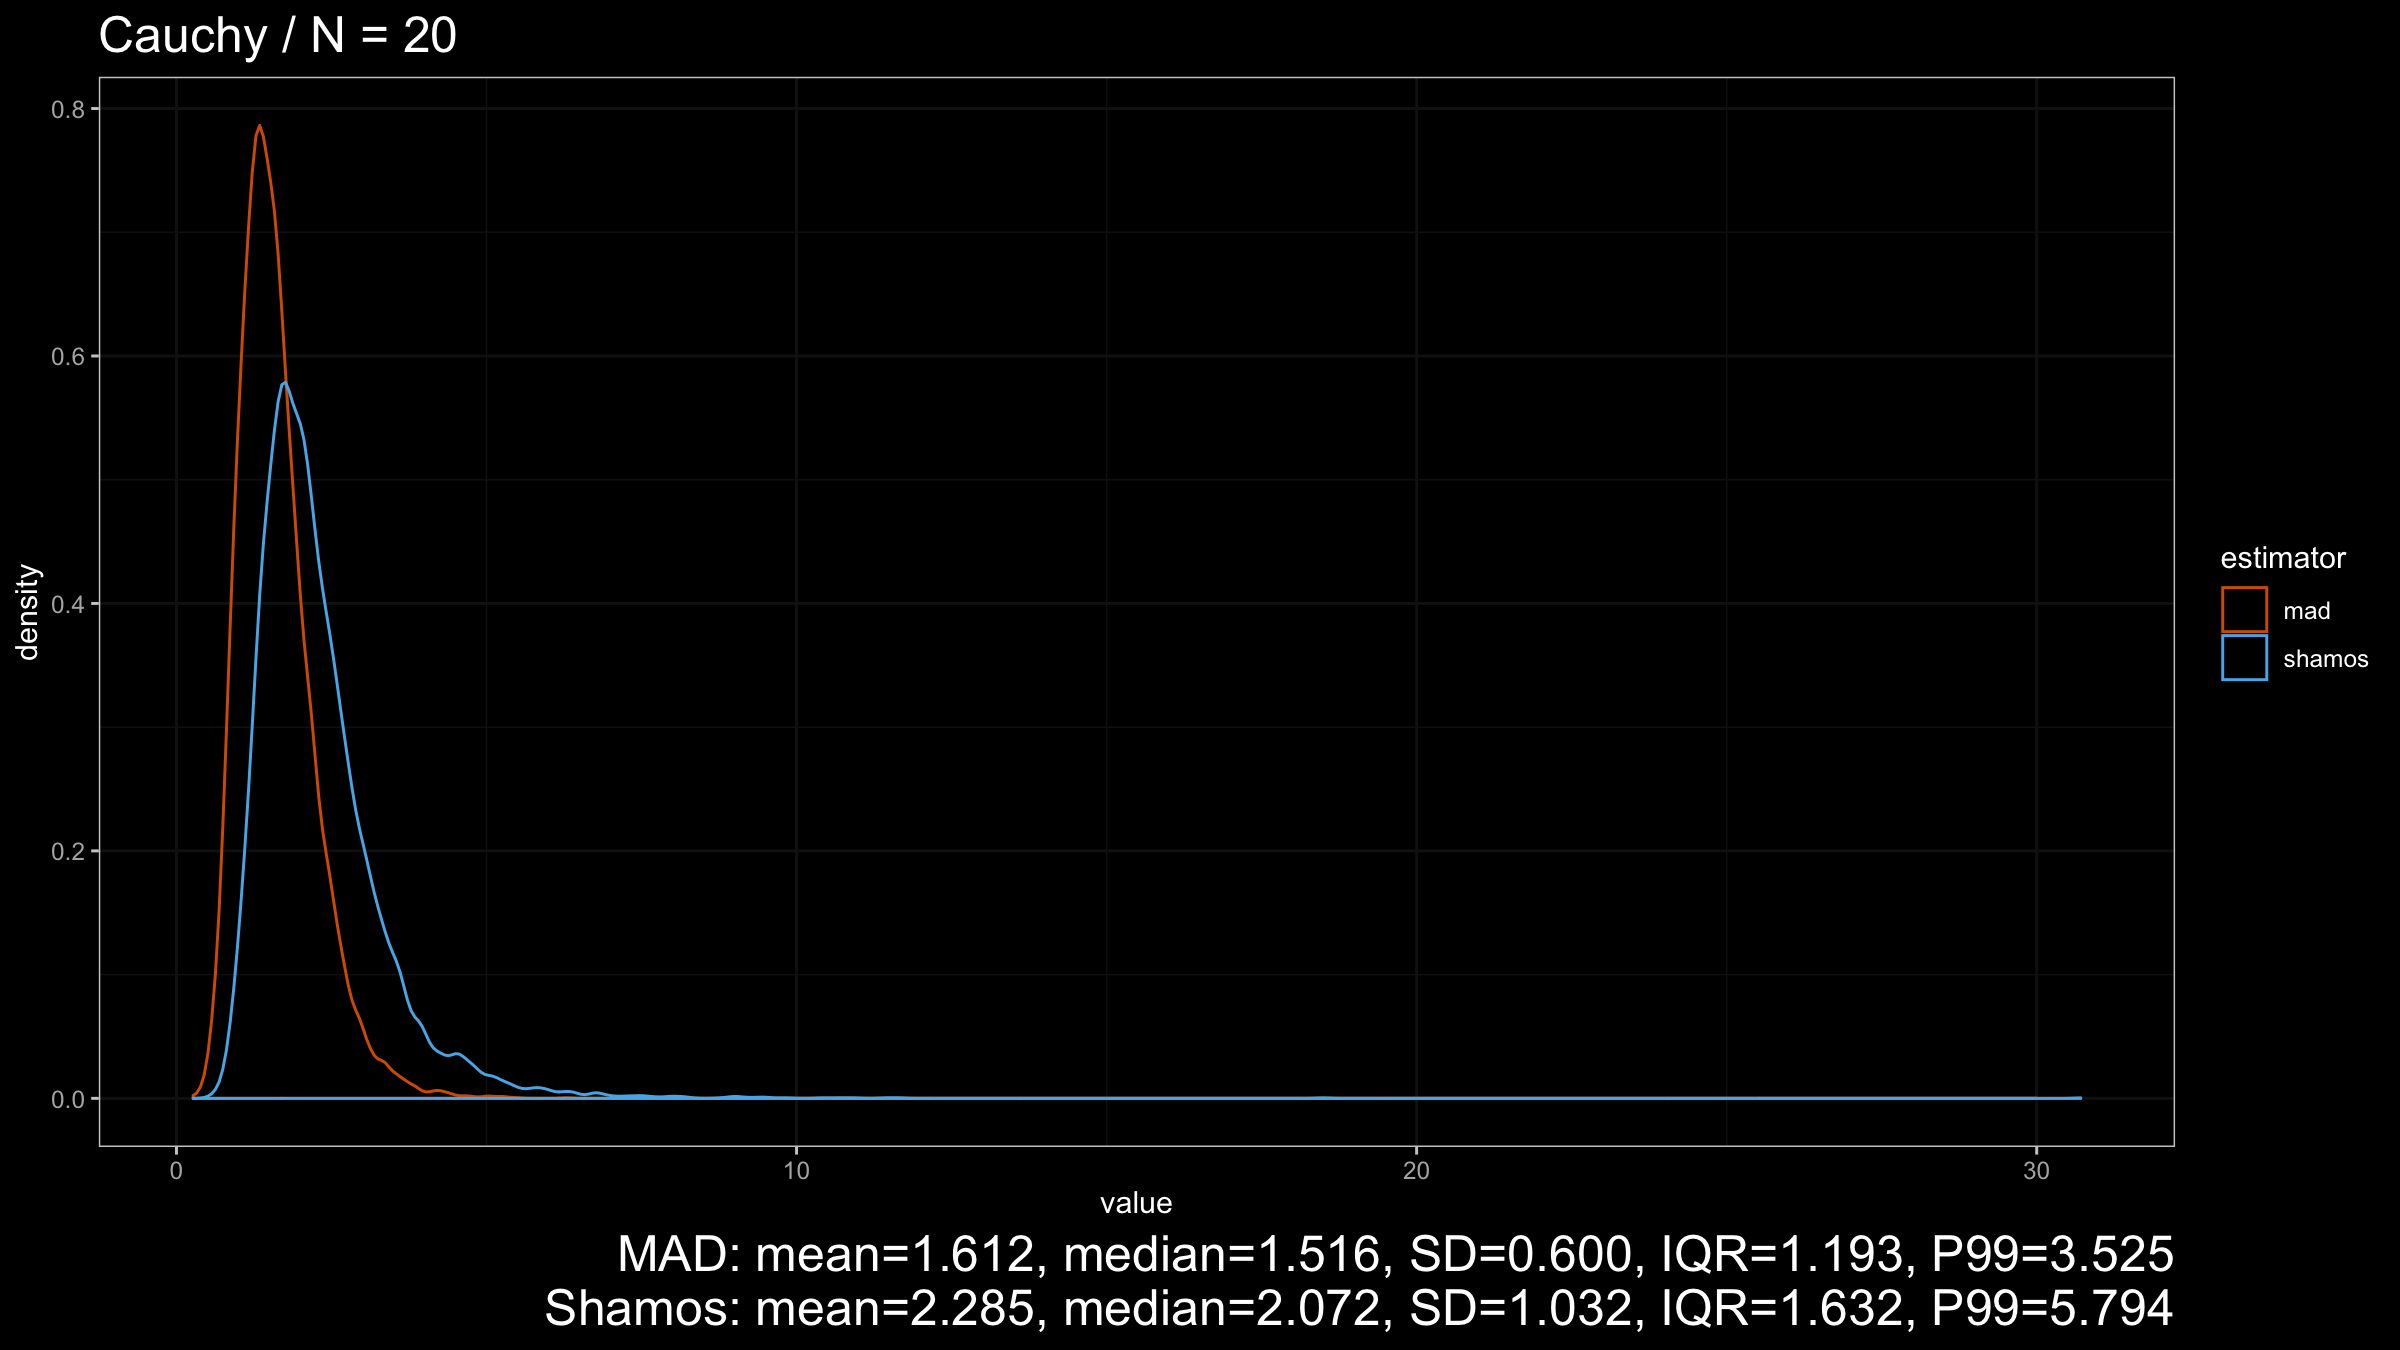
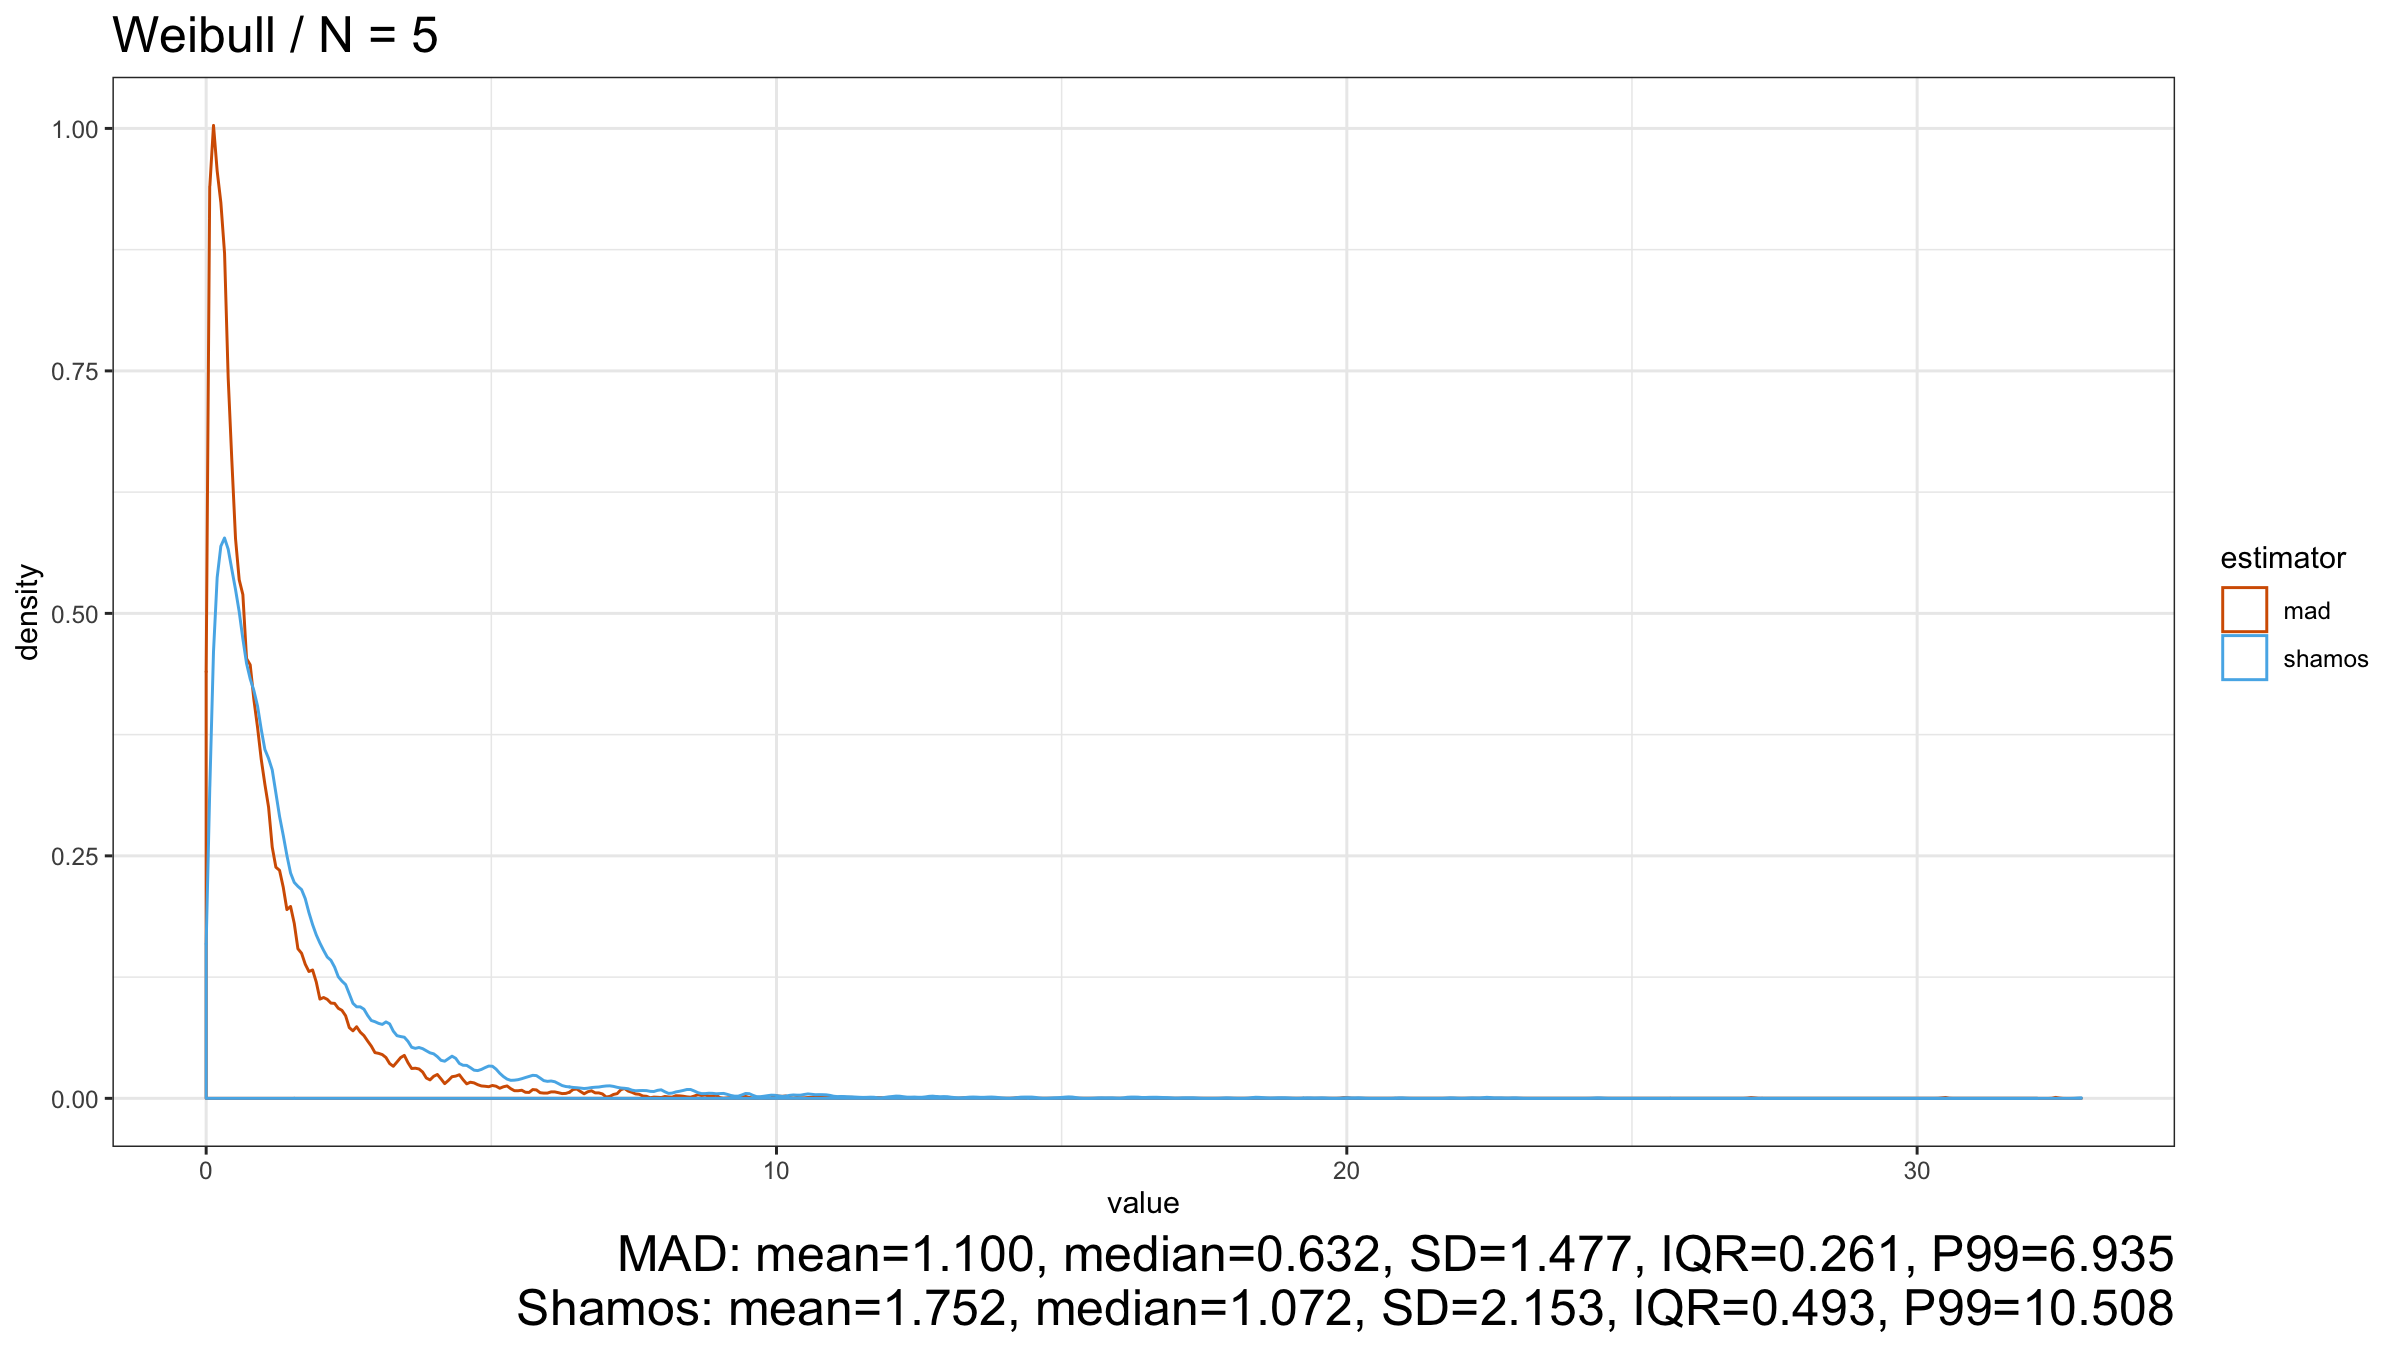
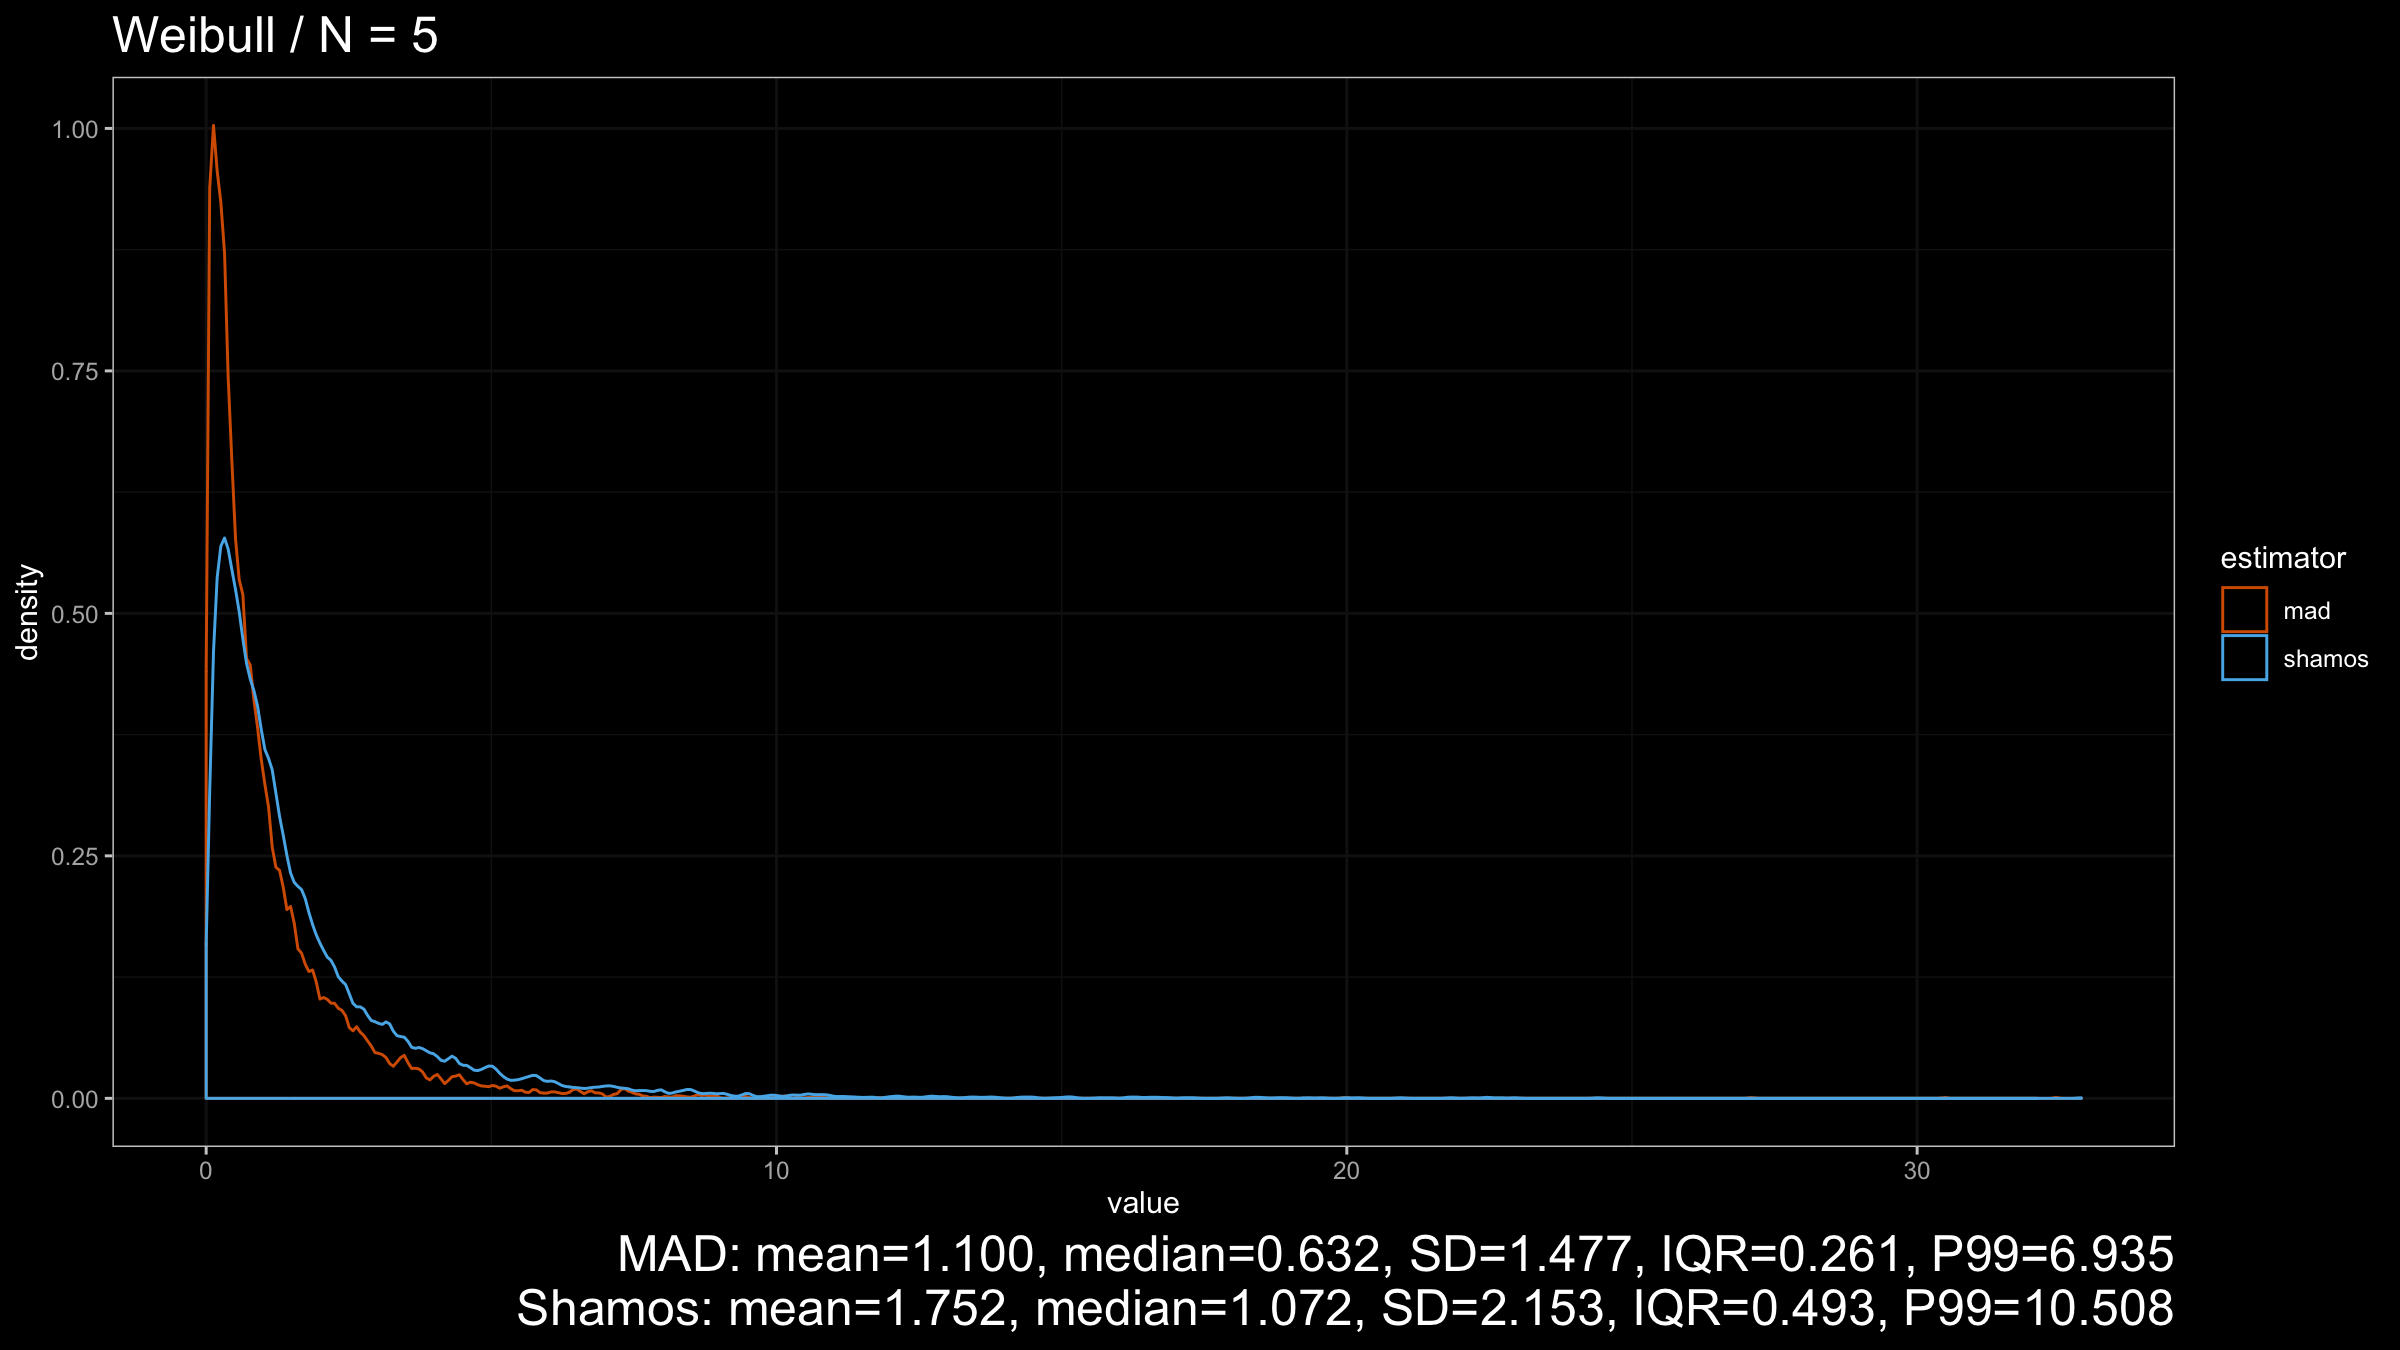
Here we can see that $\operatorname{MAD}$ shows better robustness than $\operatorname{Shamos}$ (because it has a higher breakdown point). Similar results could be observed for heavy-tailed Frechet and Weibull distributions:

Conclusion
Under normality, $\operatorname{Shamos}$ has better statistical efficiency than $\operatorname{MAD}$ if we consider these estimators as consistent estimators for the standard deviation. On other light-tailed distributions, $\operatorname{Shamos}$ also has a smaller dispersion than $\operatorname{MAD}$.
However, in the case of heavy-tailed distributions, $\operatorname{MAD}$ is the preferable option because it has a higher breakdown point and better resistance to outliers than $\operatorname{Shamos}$. Since we typically use robust measures of scales when we expect to have some extreme outliers, $\operatorname{MAD}$ looks like a more reasonable measure of dispersion than $\operatorname{Shamos}$.