Edgeworth expansion for the Mann-Whitney U test
In previous posts, I have shown a severe drawback of the classic Normal approximation for the Mann-Whitney U test: under certain conditions, can lead to quite substantial p-value errors, distorting the significance level of the test.
In this post, we will explore the potential of the Edgeworth expansion as a more accurate alternative for approximating the distribution of the Mann-Whitney U statistic.
Normal approximation
We consider the one-sided Mann-Whitney U test that compares two samples $\mathbf{x}$ and $\mathbf{y}$:
$$ \mathbf{x} = \{ x_1, x_2, \ldots, x_n \}, \quad \mathbf{y} = \{ y_1, y_2, \ldots, y_m \}. $$Firstly, let’s discuss the classical Normal approximation. The Mann-Whitney U test statistic, U, is defined as follows:
$$ U(x, y) = \sum_{i=1}^n \sum_{j=1}^m S(x_i, y_j),\quad S(a,b) = \begin{cases} 1, & \text{if } a > b, \\ 0.5, & \text{if } a = b, \\ 0, & \text{if } a < b. \end{cases} $$The normal approximation $\mathcal{N}(\mu_U, \sigma_U^2)$ is typically given by:
$$ \mu_U = \frac{nm}{2},\quad \sigma_U = \sqrt{\frac{nm(n+m+1)}{12}}. $$Note, that in the case of tied elements, the equations need some adjustments. However, we assume that this case can be neglected. Once the approximation is defined, $z$ is given by:
$$ z = \frac{U - \mu_U \pm 0.5}{\sigma_U}, $$where $\pm 0.5$ is the correction for continuity.
The final p-value is calculated as follows:
$$ p_\mathcal{N}(z) = \Phi(z), $$where $\Phi$ is the CDF of the standard normal distribution $\mathcal{N}(0, 1)$. Depending on the direction of the test, $p_\mathcal{N}(z) = 1 - \Phi(z)$ may be also considered.
The problem with this approximation is that it does not hold well for all cases. It tends to overestimate the p-values, especially for extreme U values, leading to potentially false non-rejections of the null hypothesis.
Edgeworth approximation
A more accurate approximation can be obtained using the Edgeworth expansion.
The idea is to refine the Normal approximation by adding corrective terms
that depend on the higher moments of the distribution.
In this post, we use the Edgeworth expansion from The normal, Edgeworth, saddlepoint and uniform approximations to the Wilcoxon–Mann–Whitney null-distribution: a numerical comparison
By Raphaël Bean, Sorana Froda, Constance Van Eeden
·
2004bean2004.
It is given by:
where $\phi$ is the PDF of $\mathcal{N}(0, 1)$
The second term in the above $p_E(z)$ equation captures the skewness of the U distribution and corrects for the bias in the Normal approximation. The Edgeworth expansion can be extended to include more terms, capturing even higher moments of the distribution, but the first two terms usually suffice for practical purposes. This approach generally provides much better approximations of the true p-values compared to the classical Normal approximation, thereby ensuring more accurate hypothesis testing results.
Numerical simulations
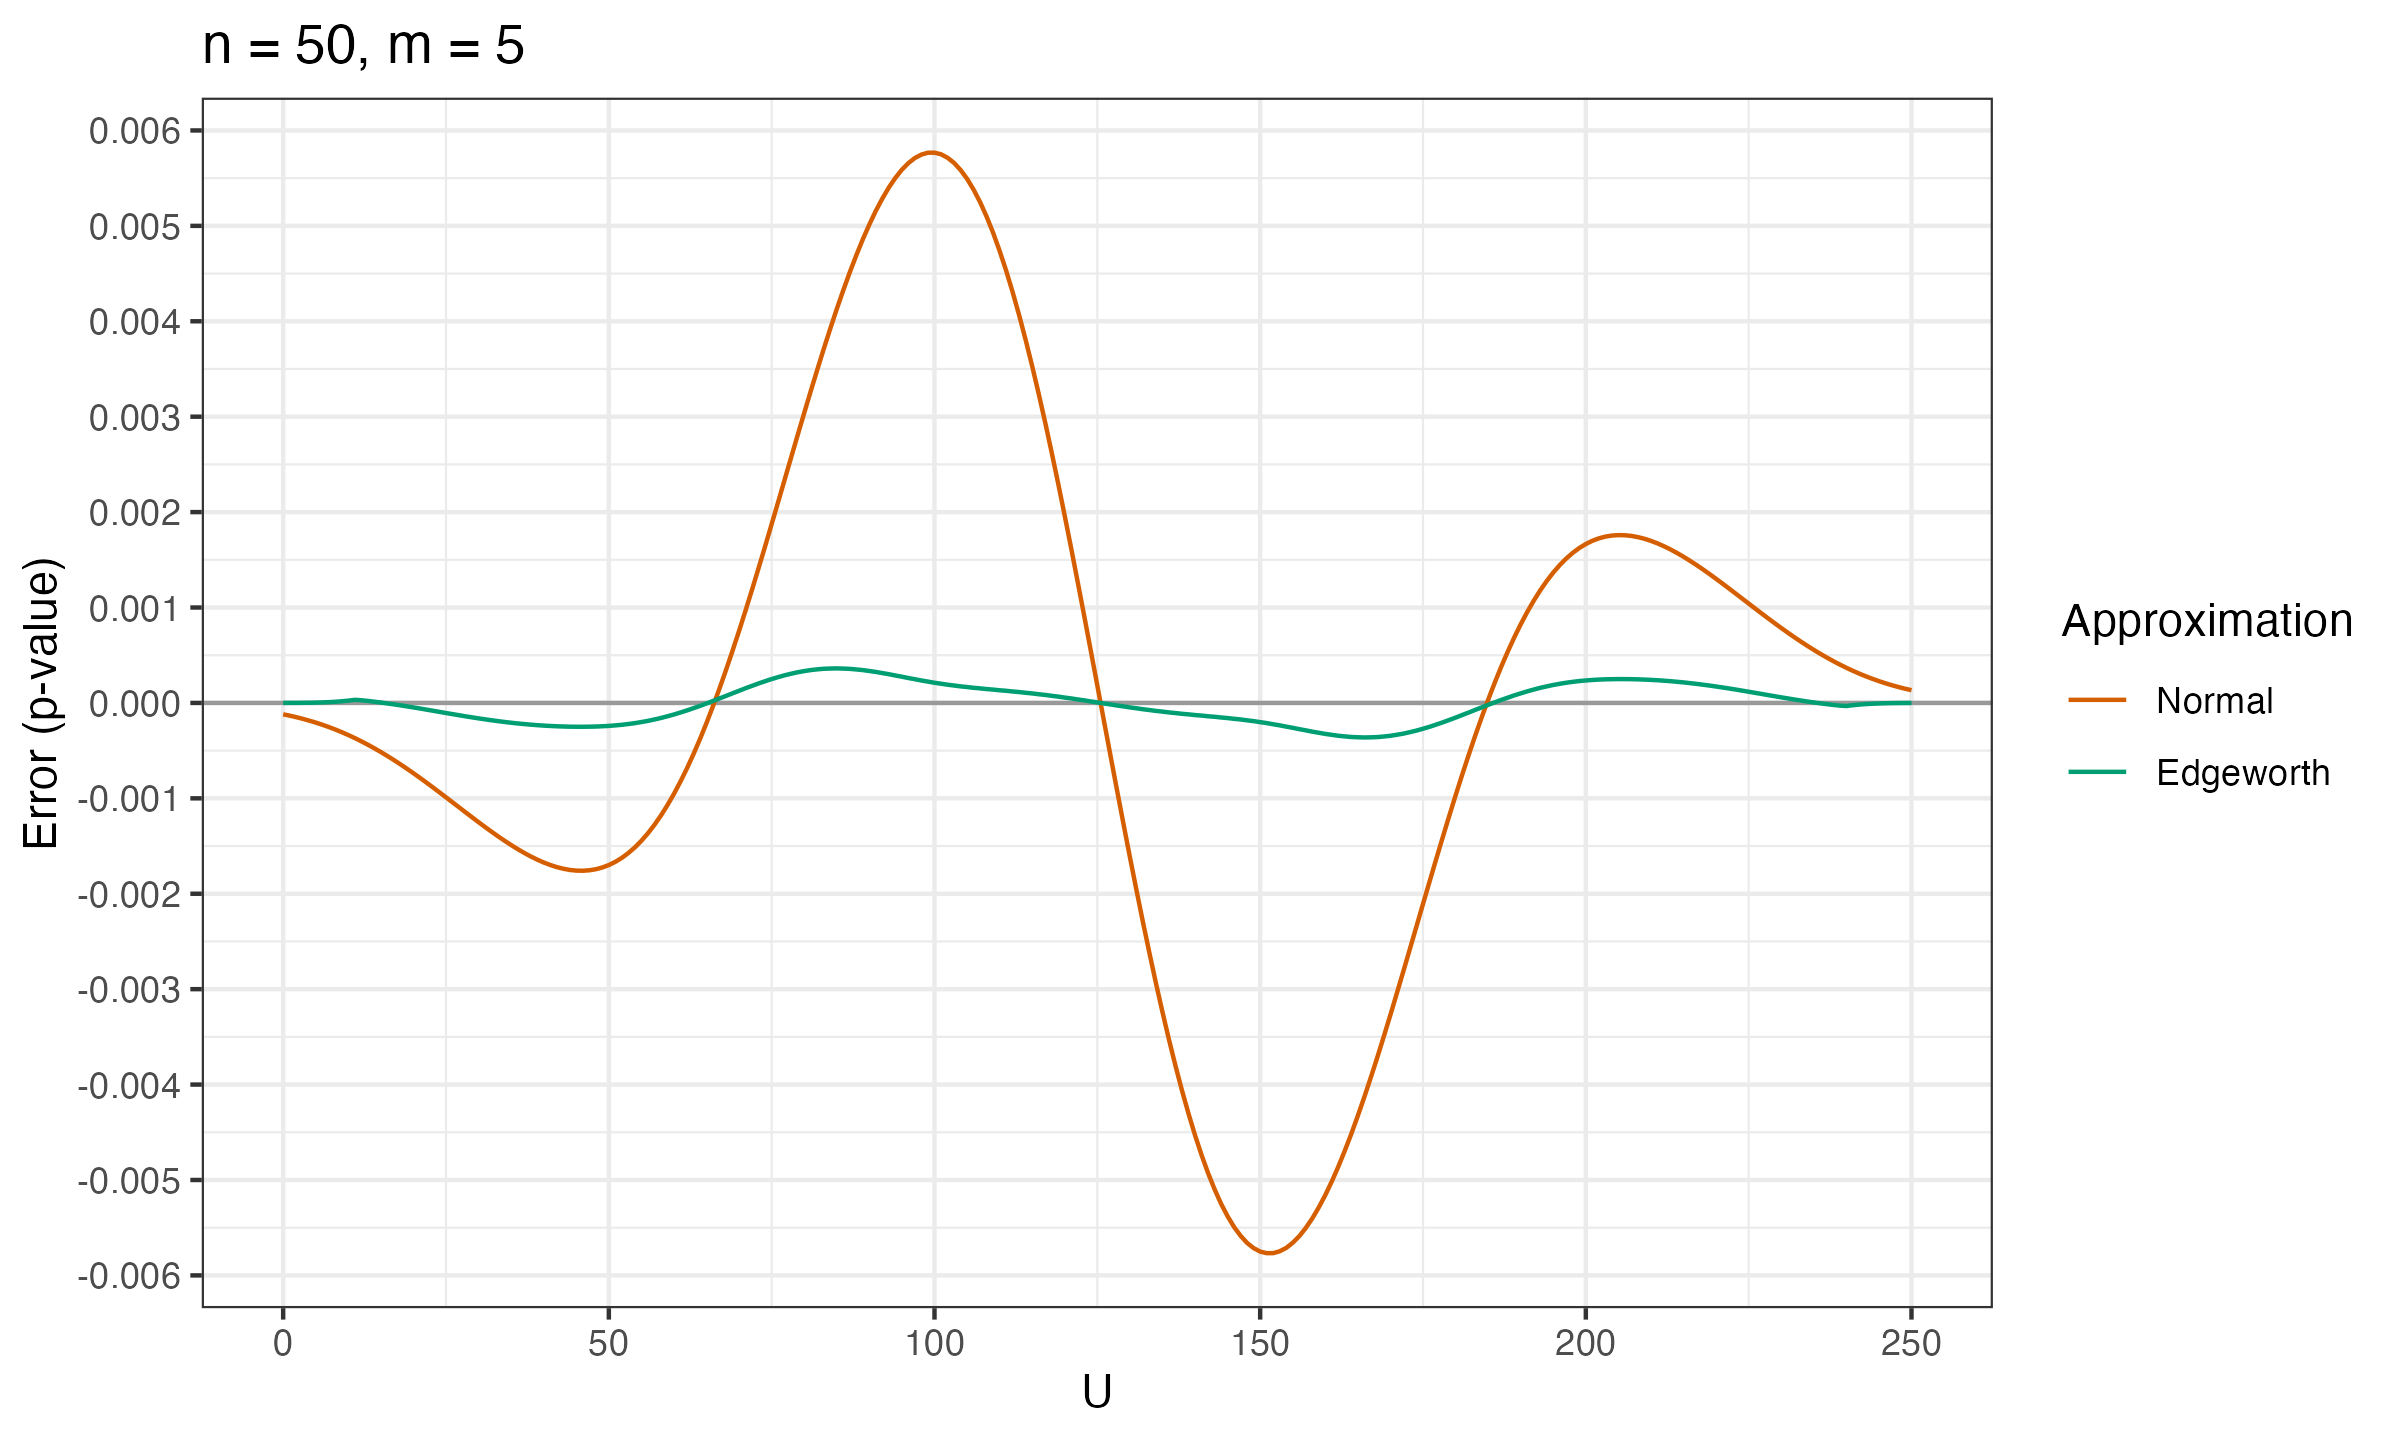
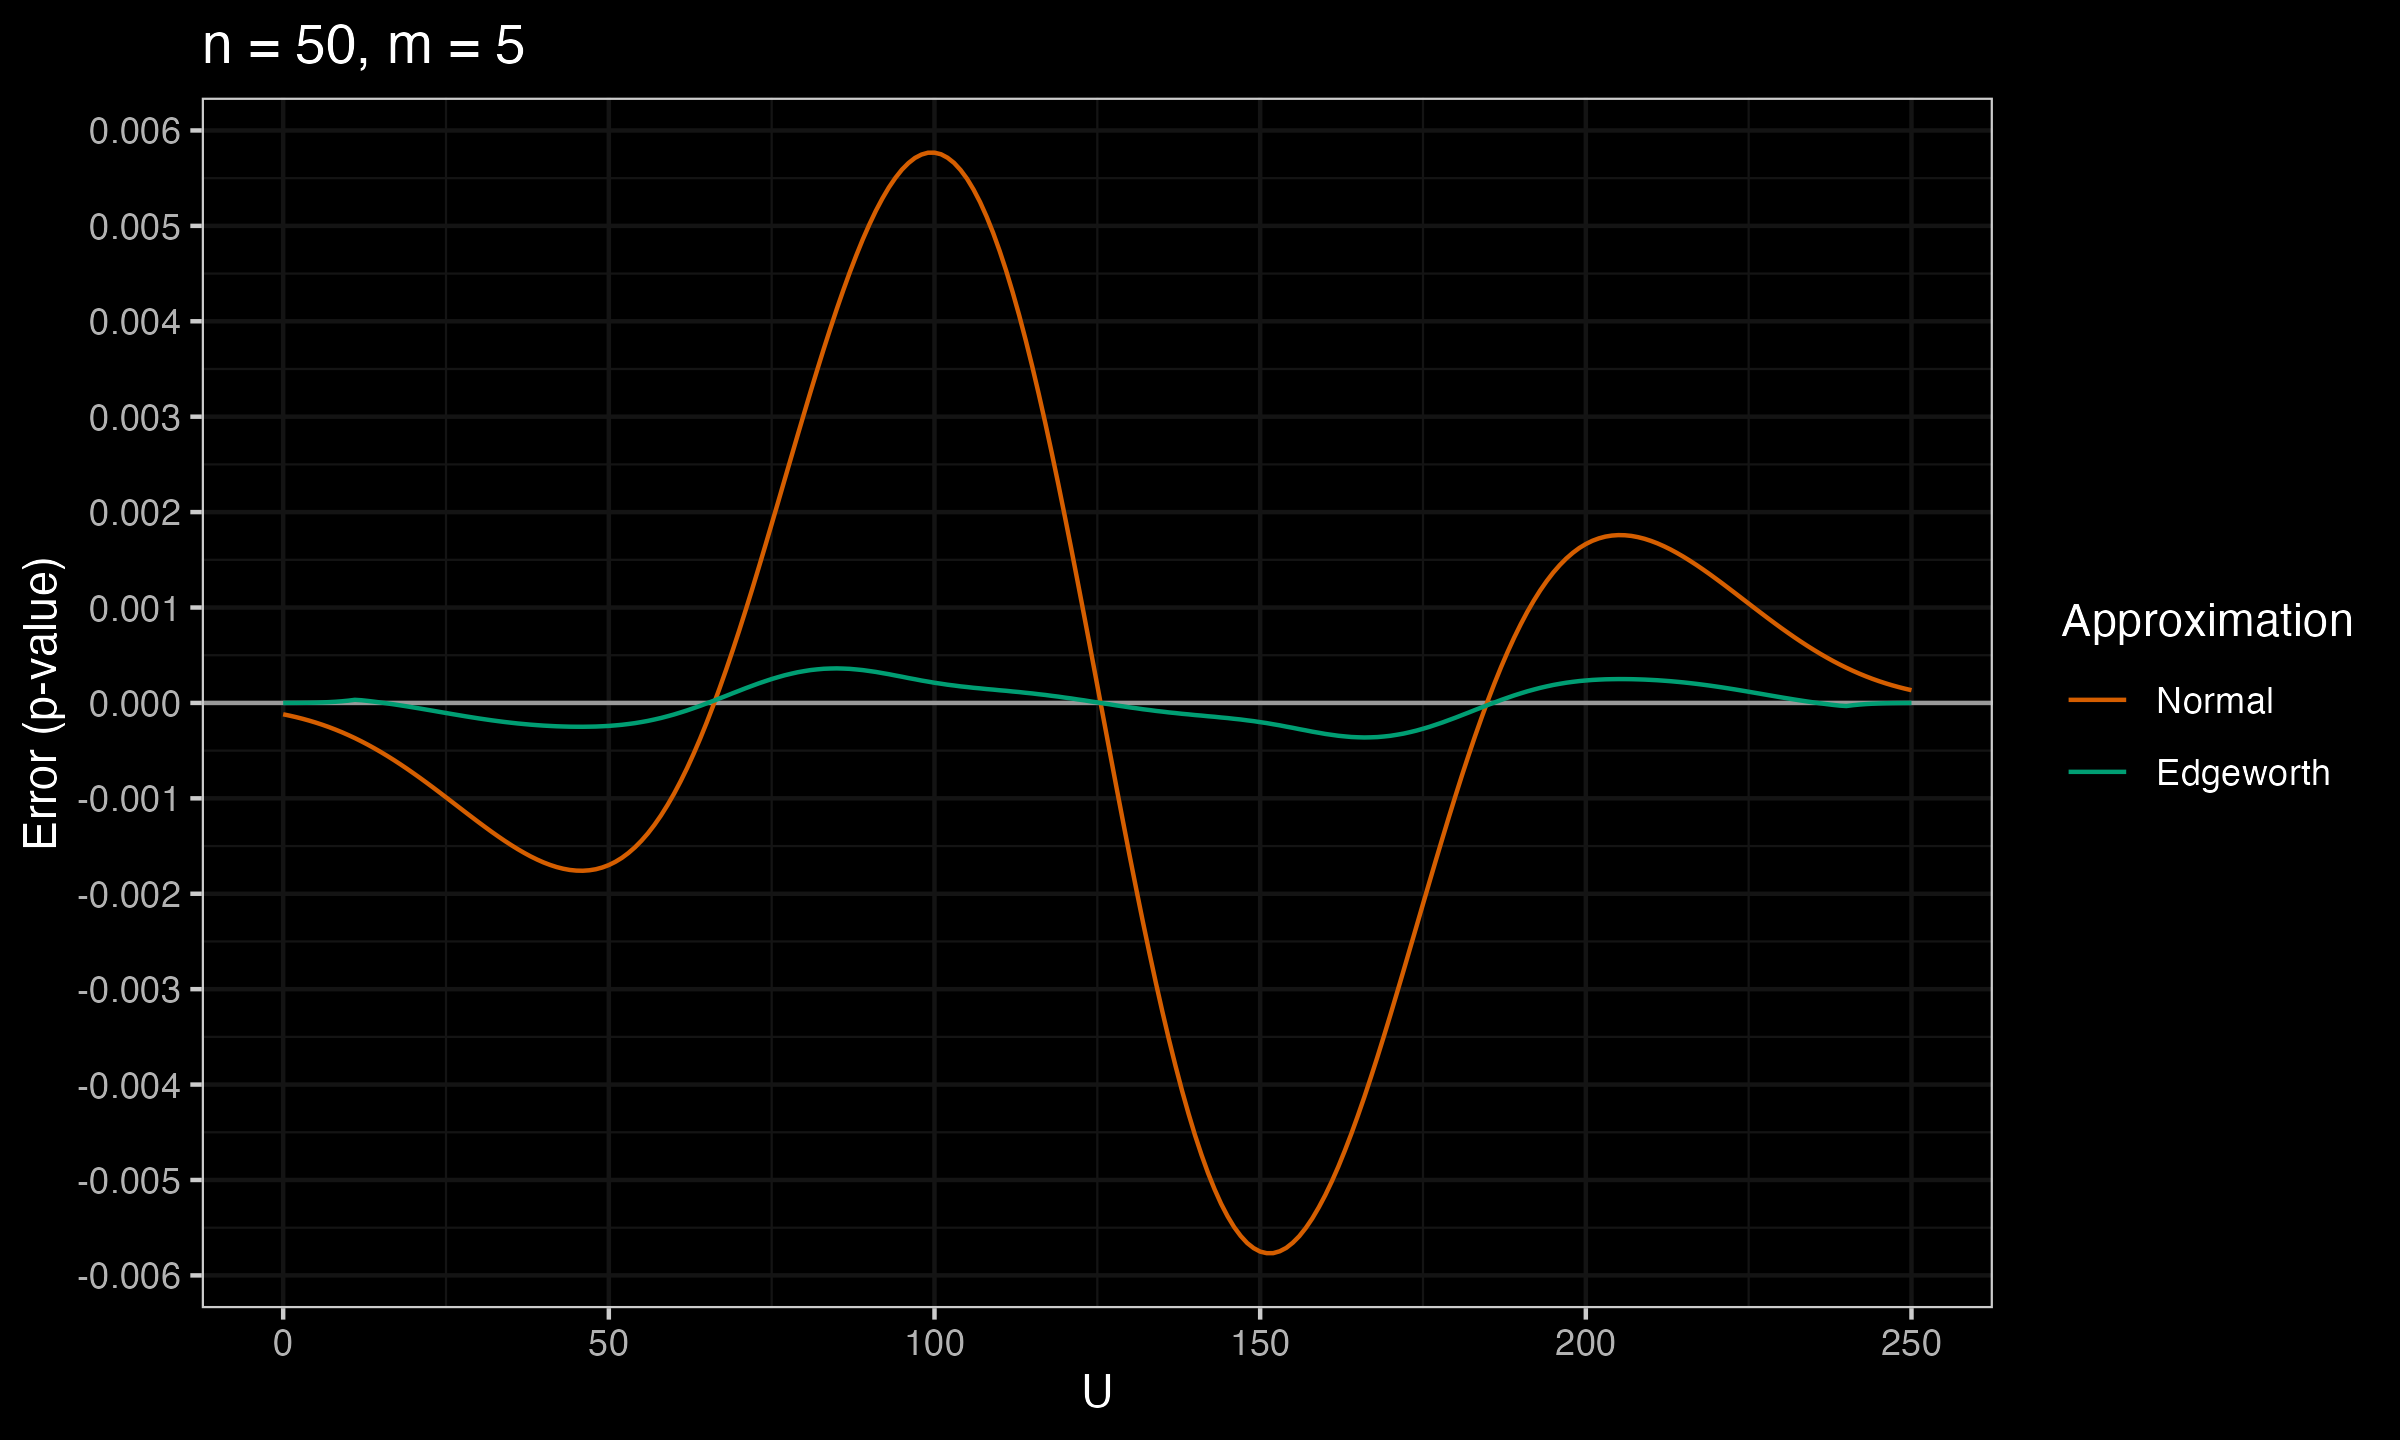
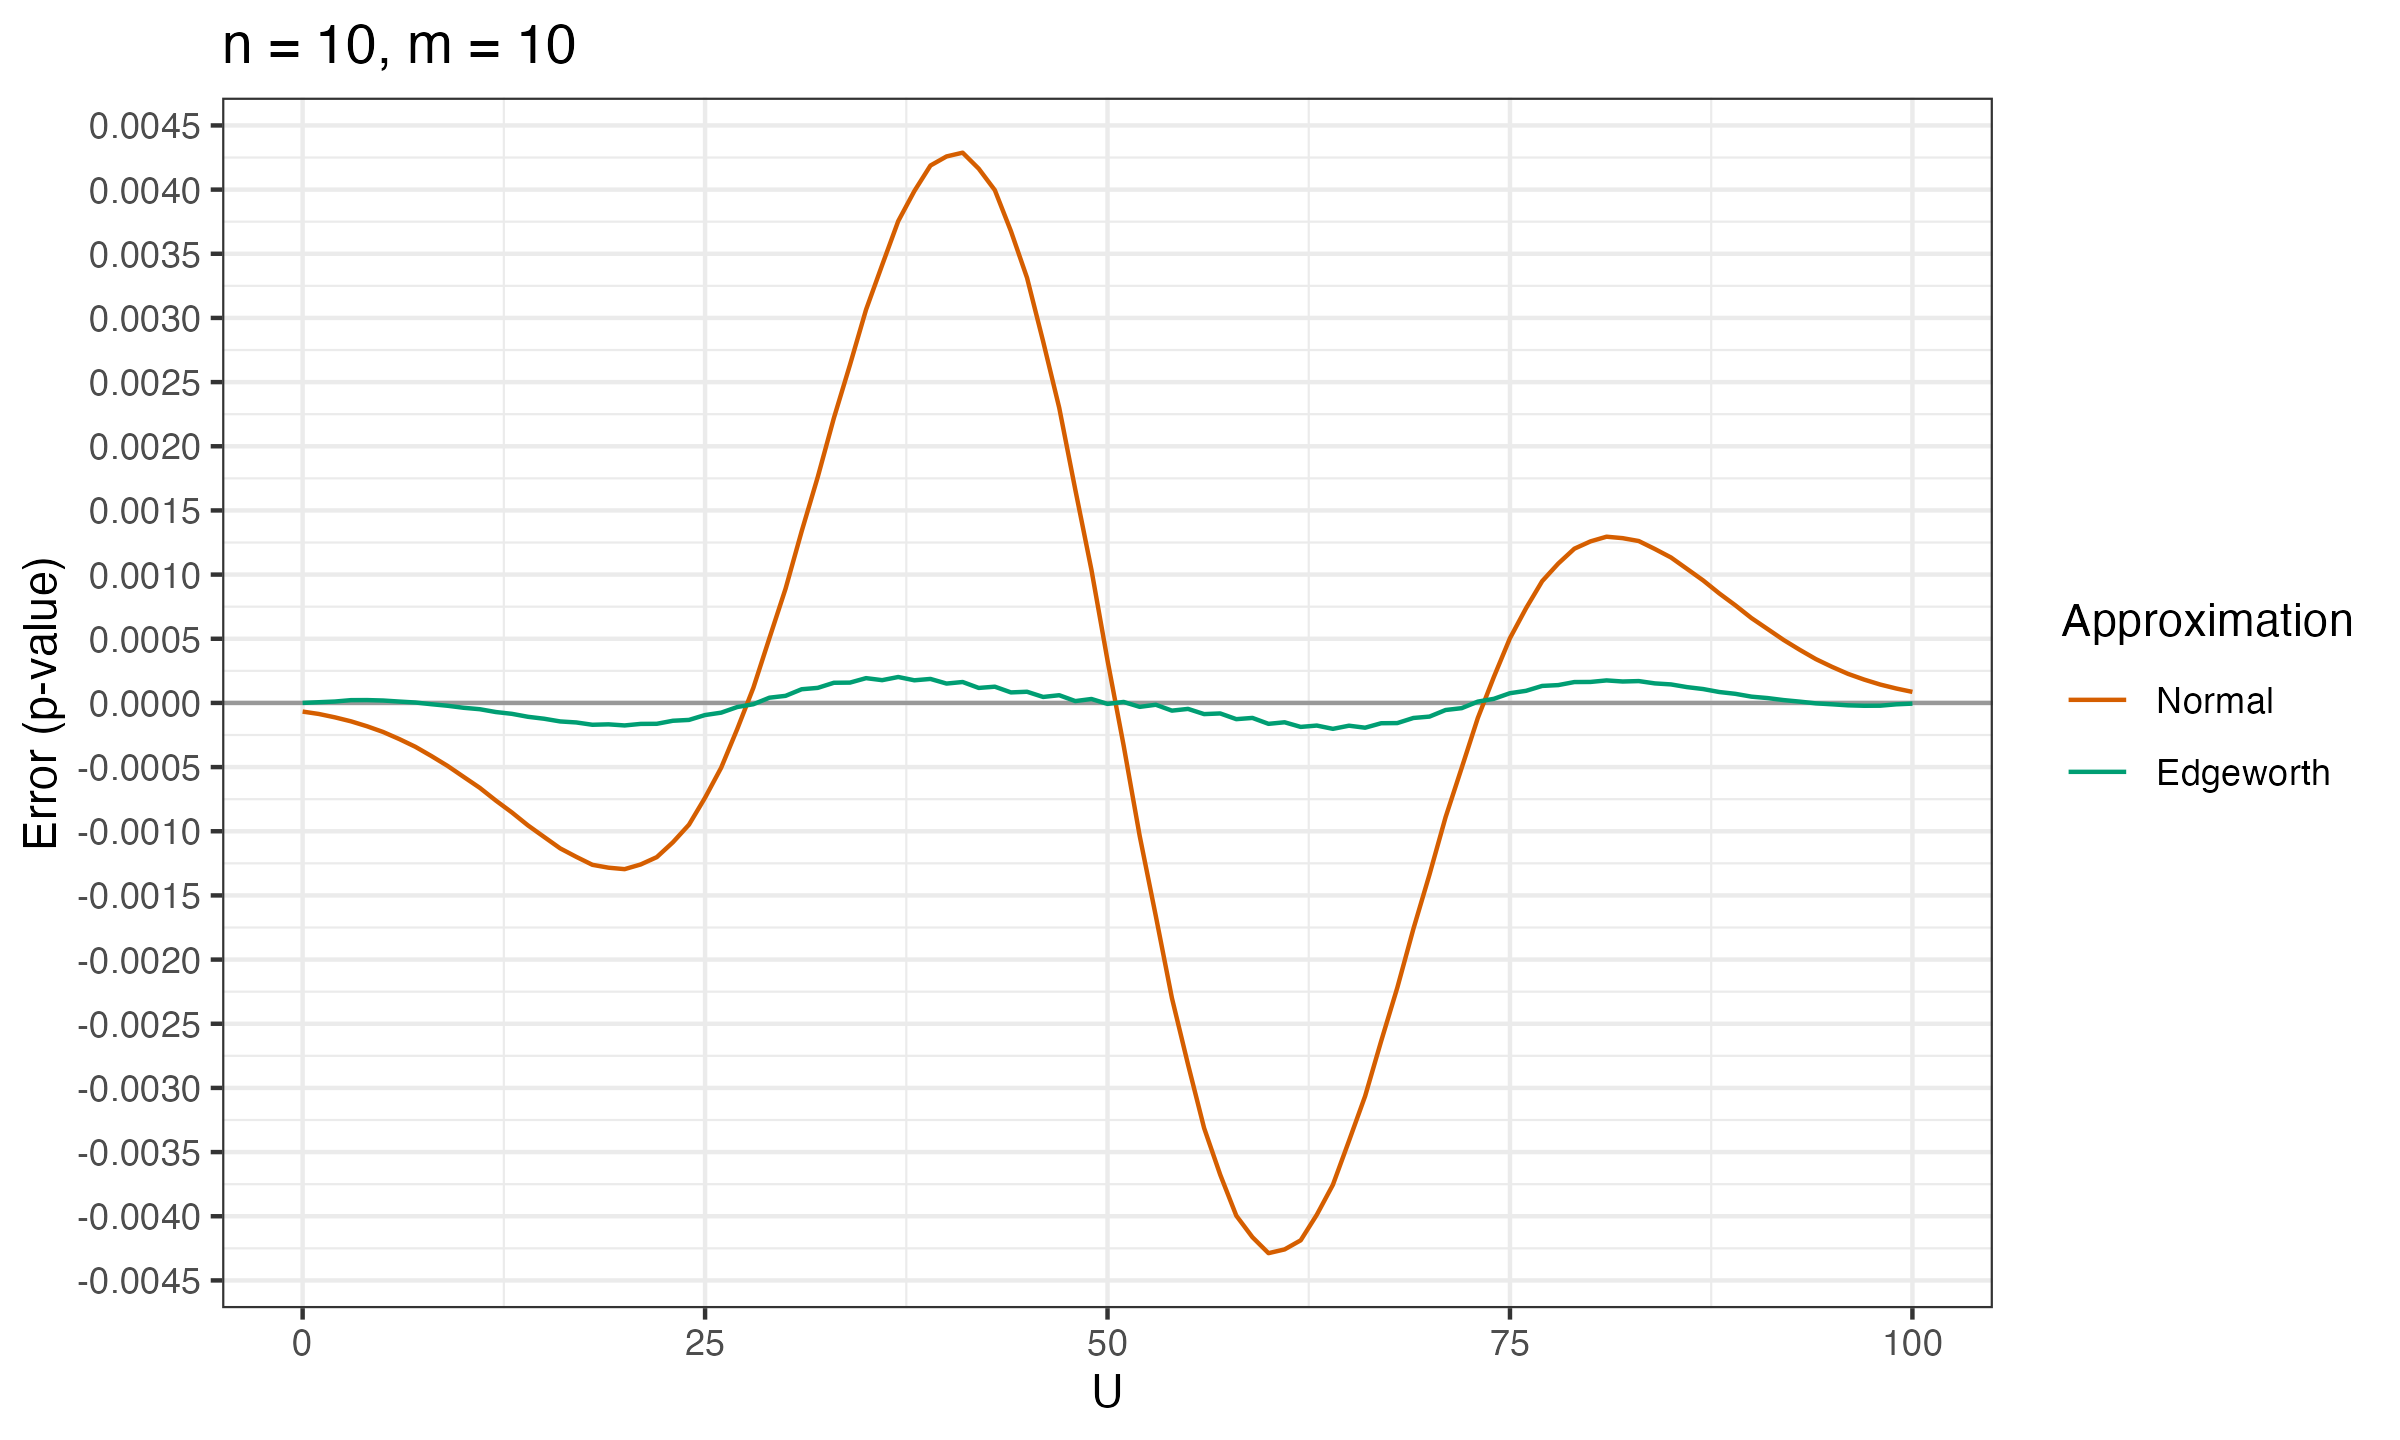
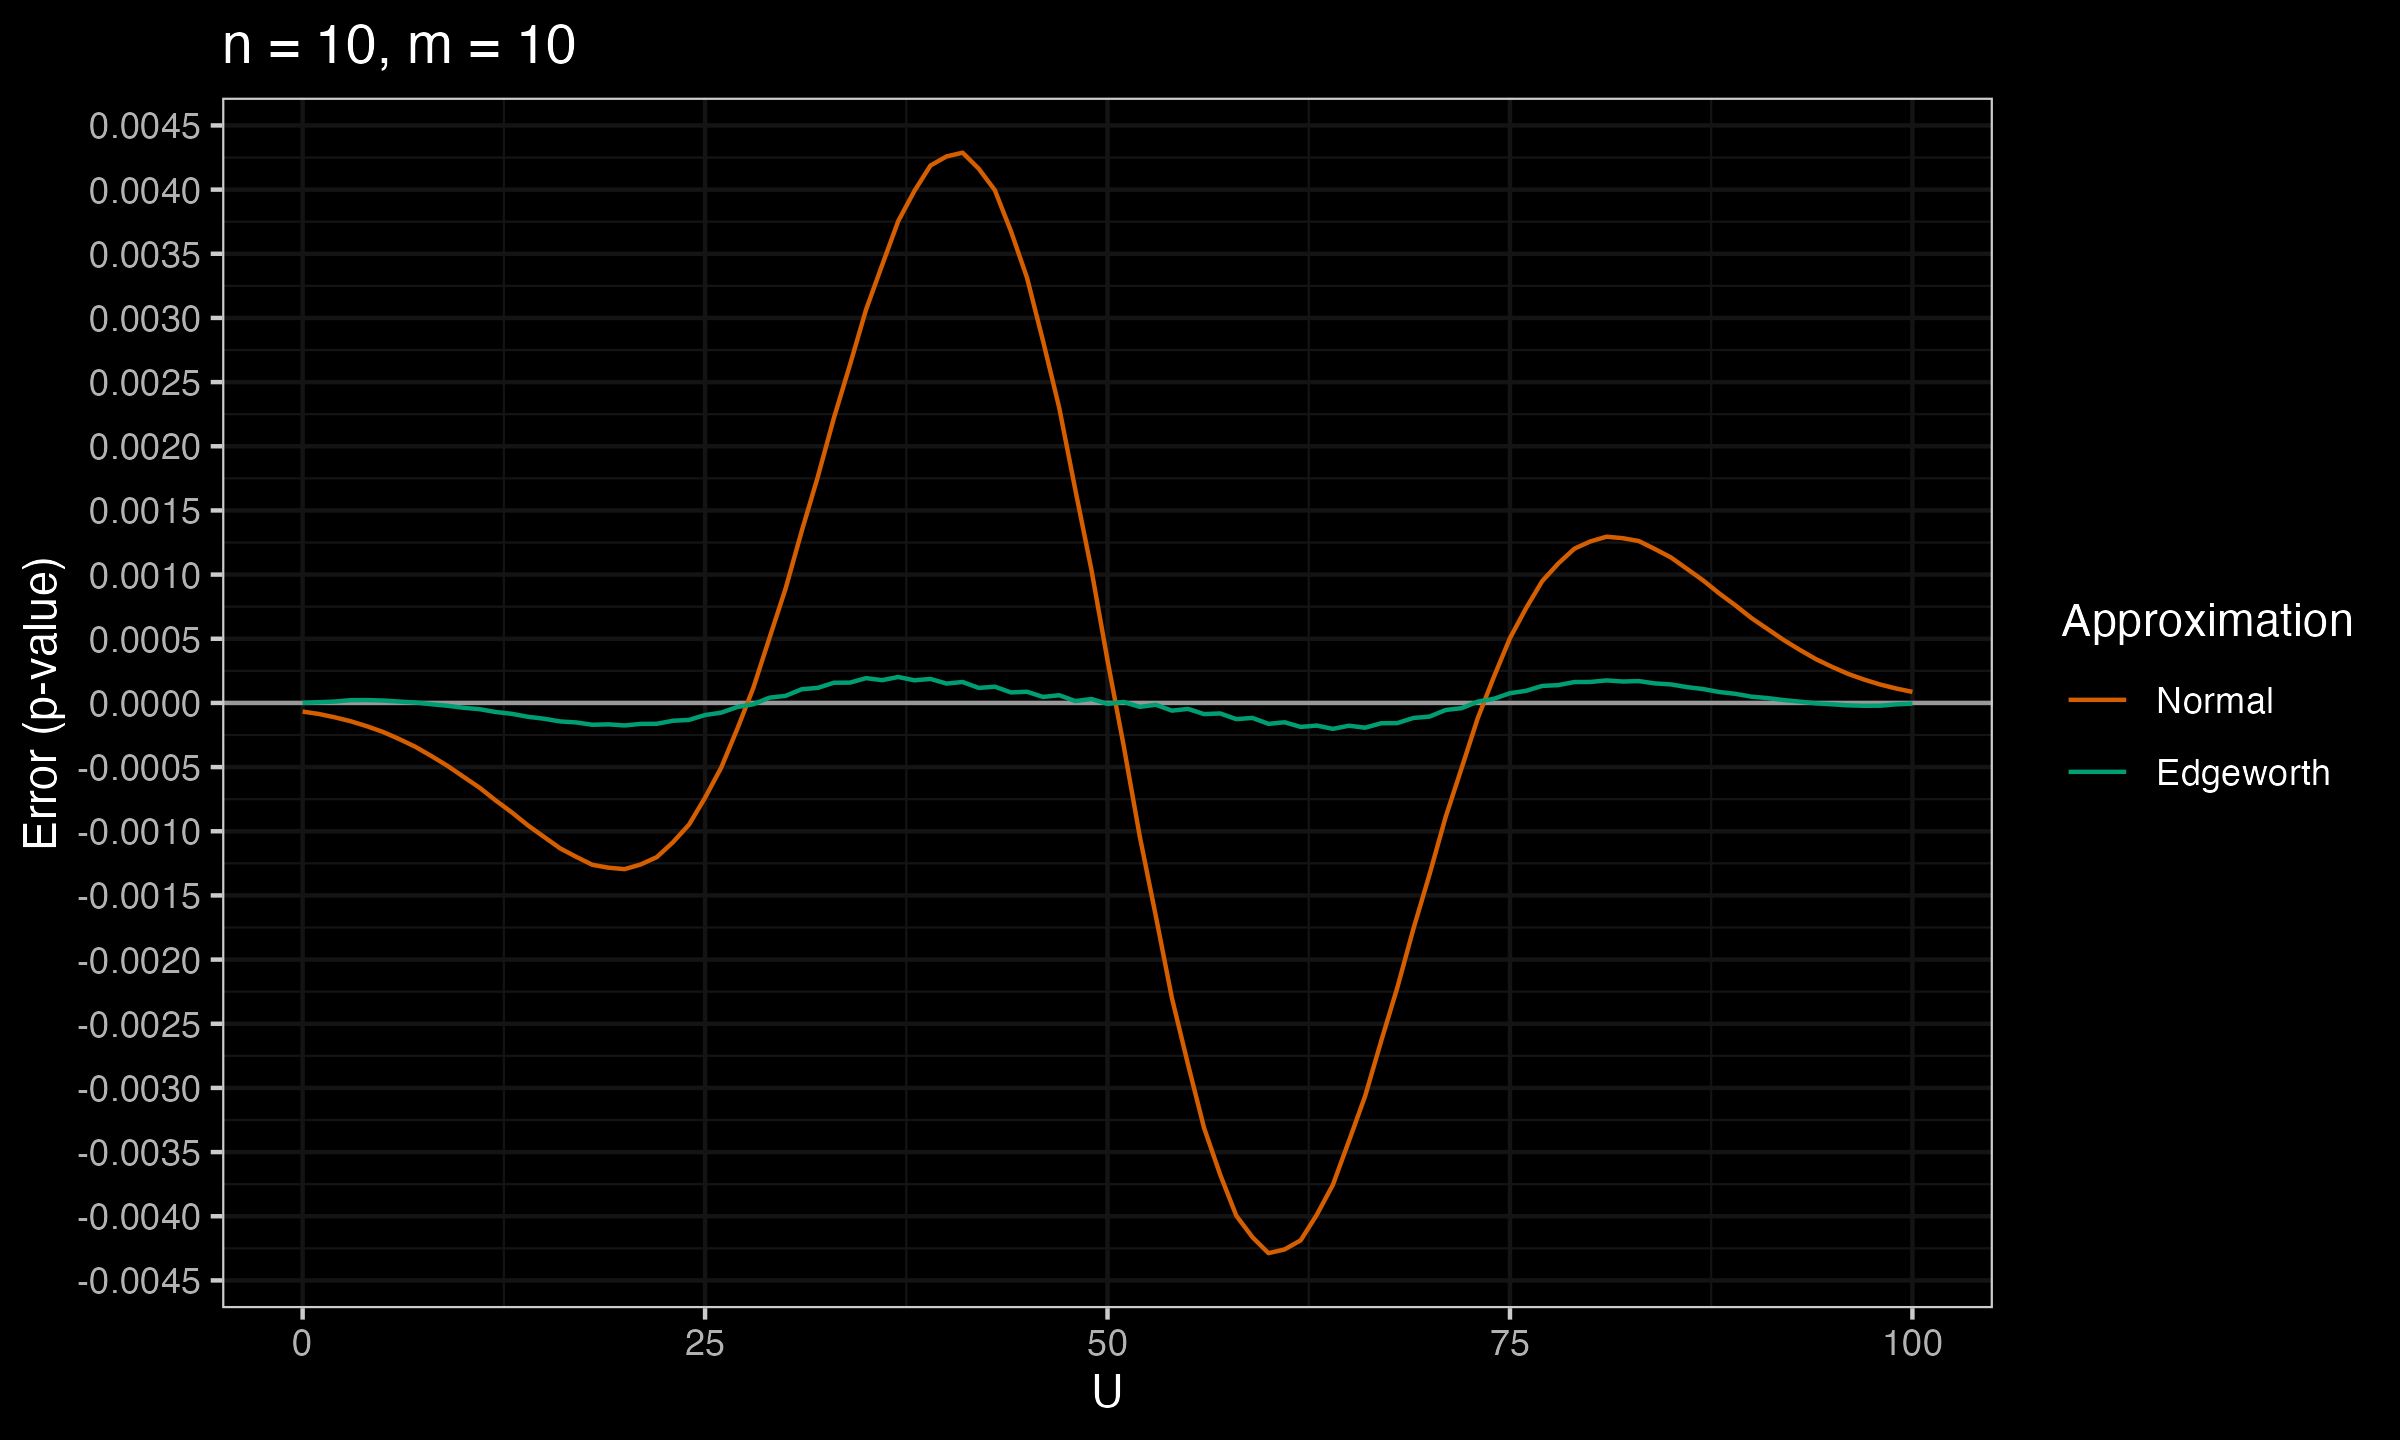
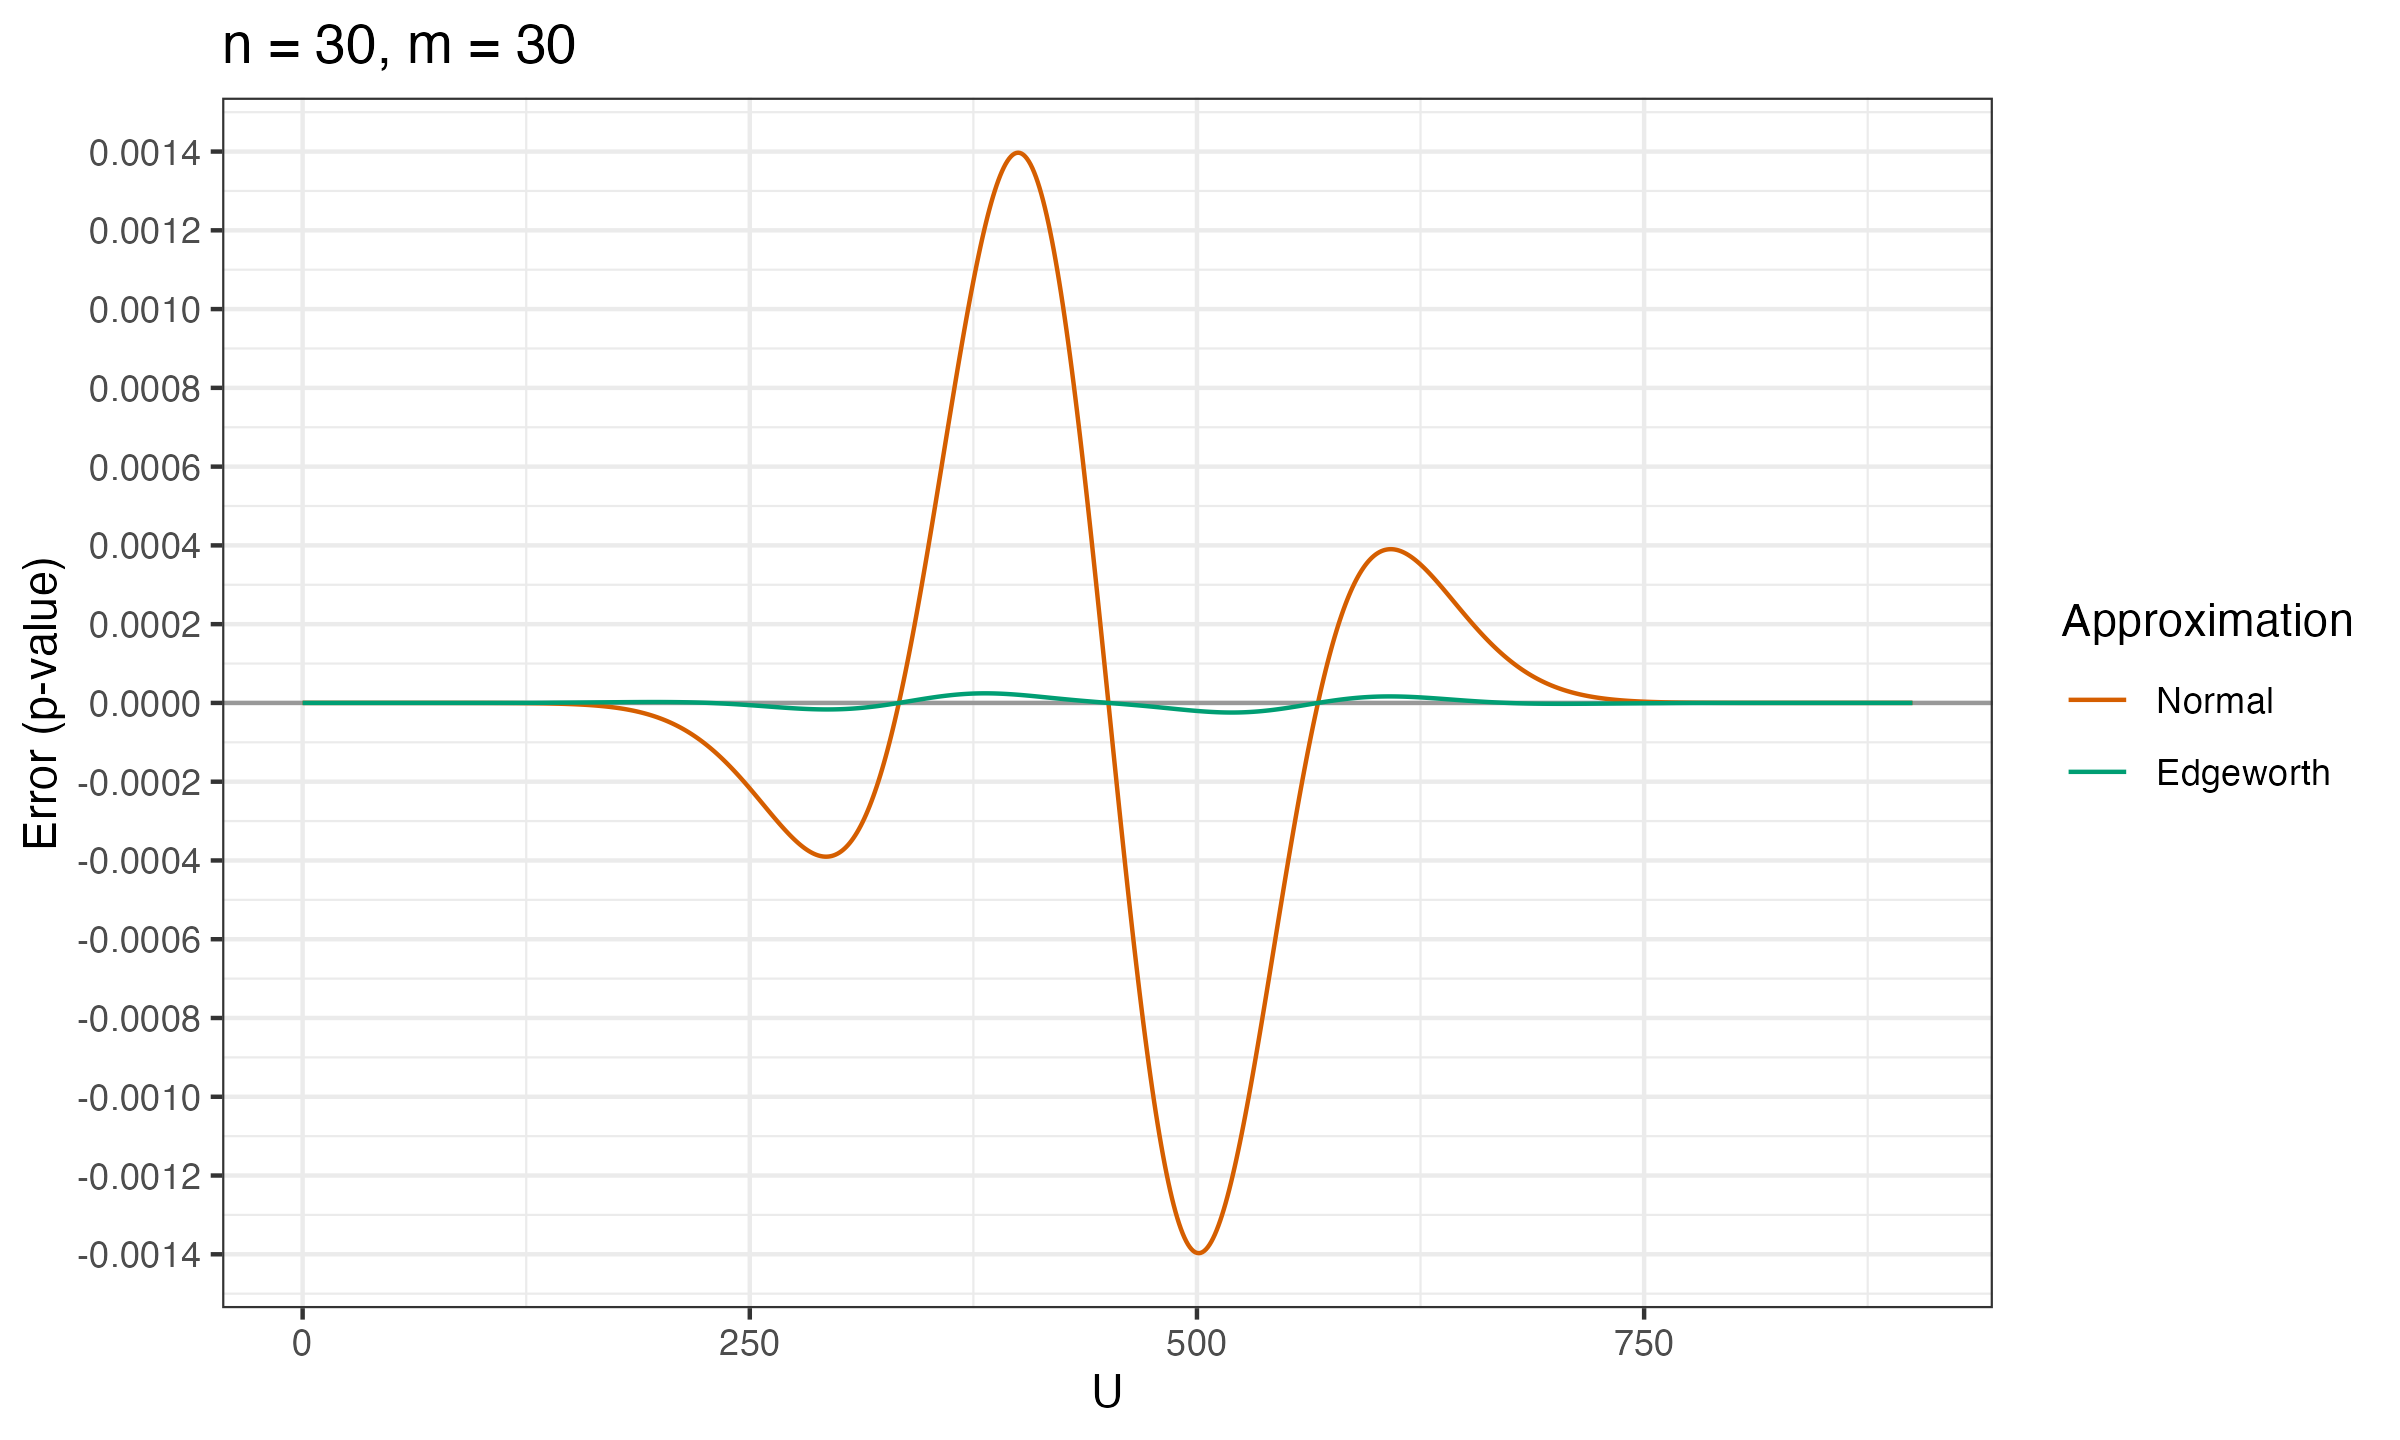
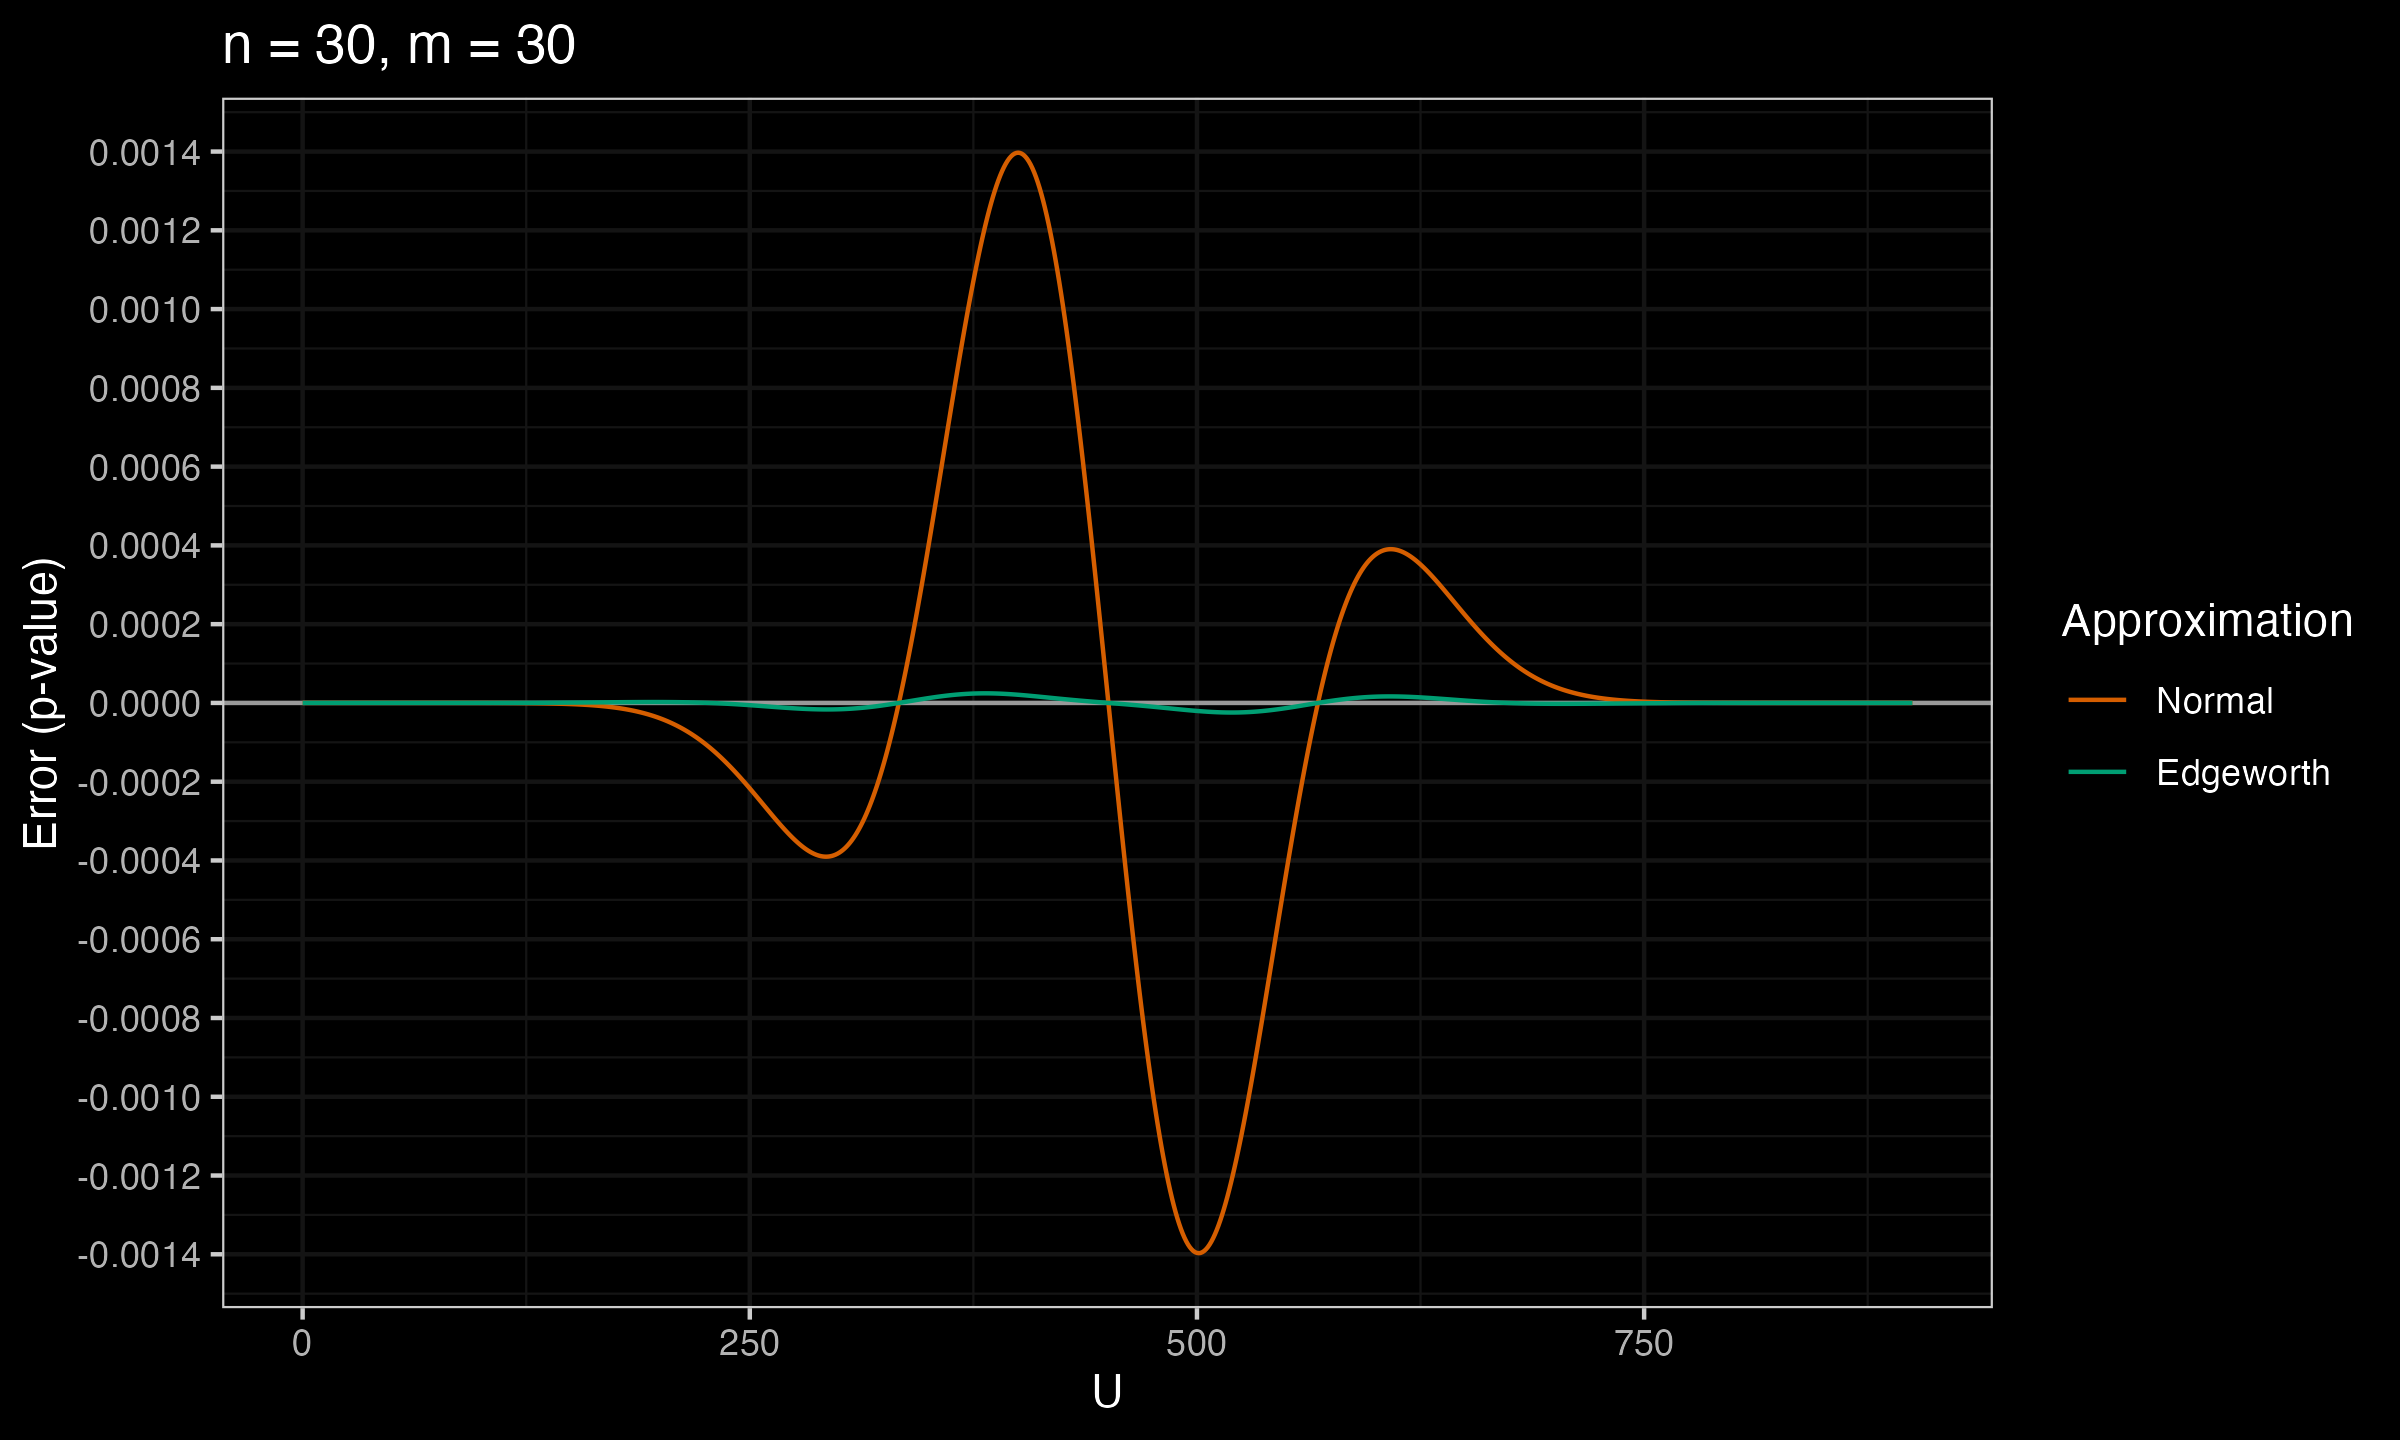
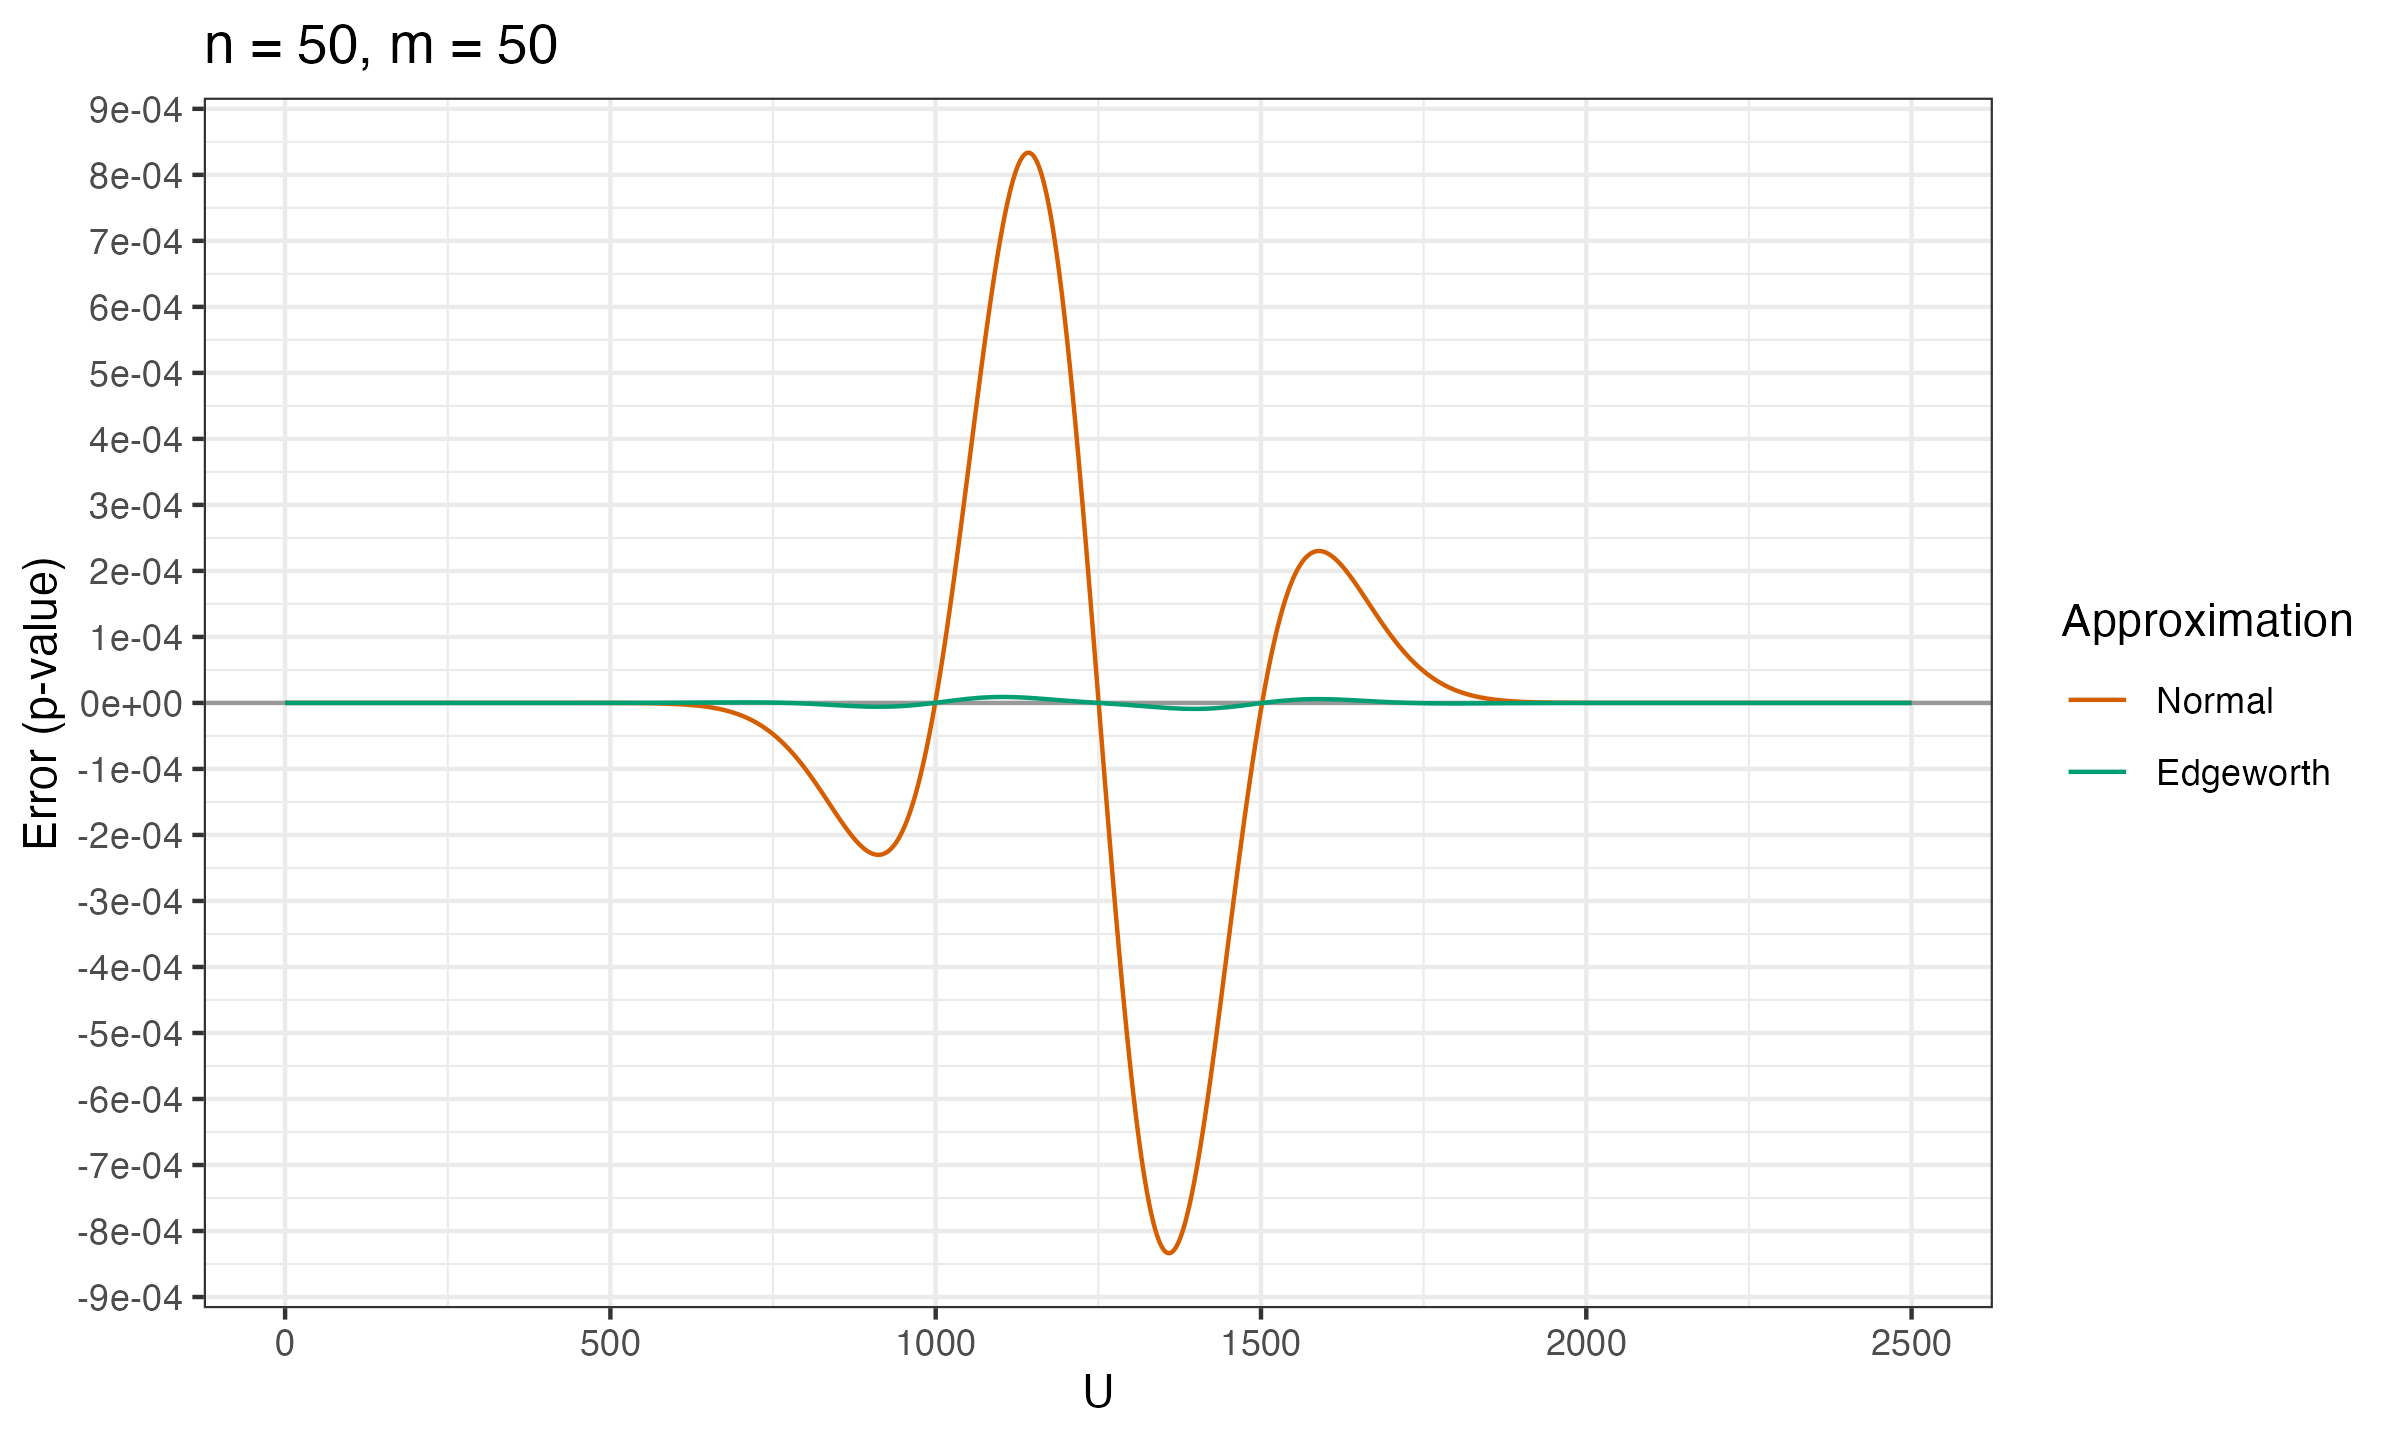
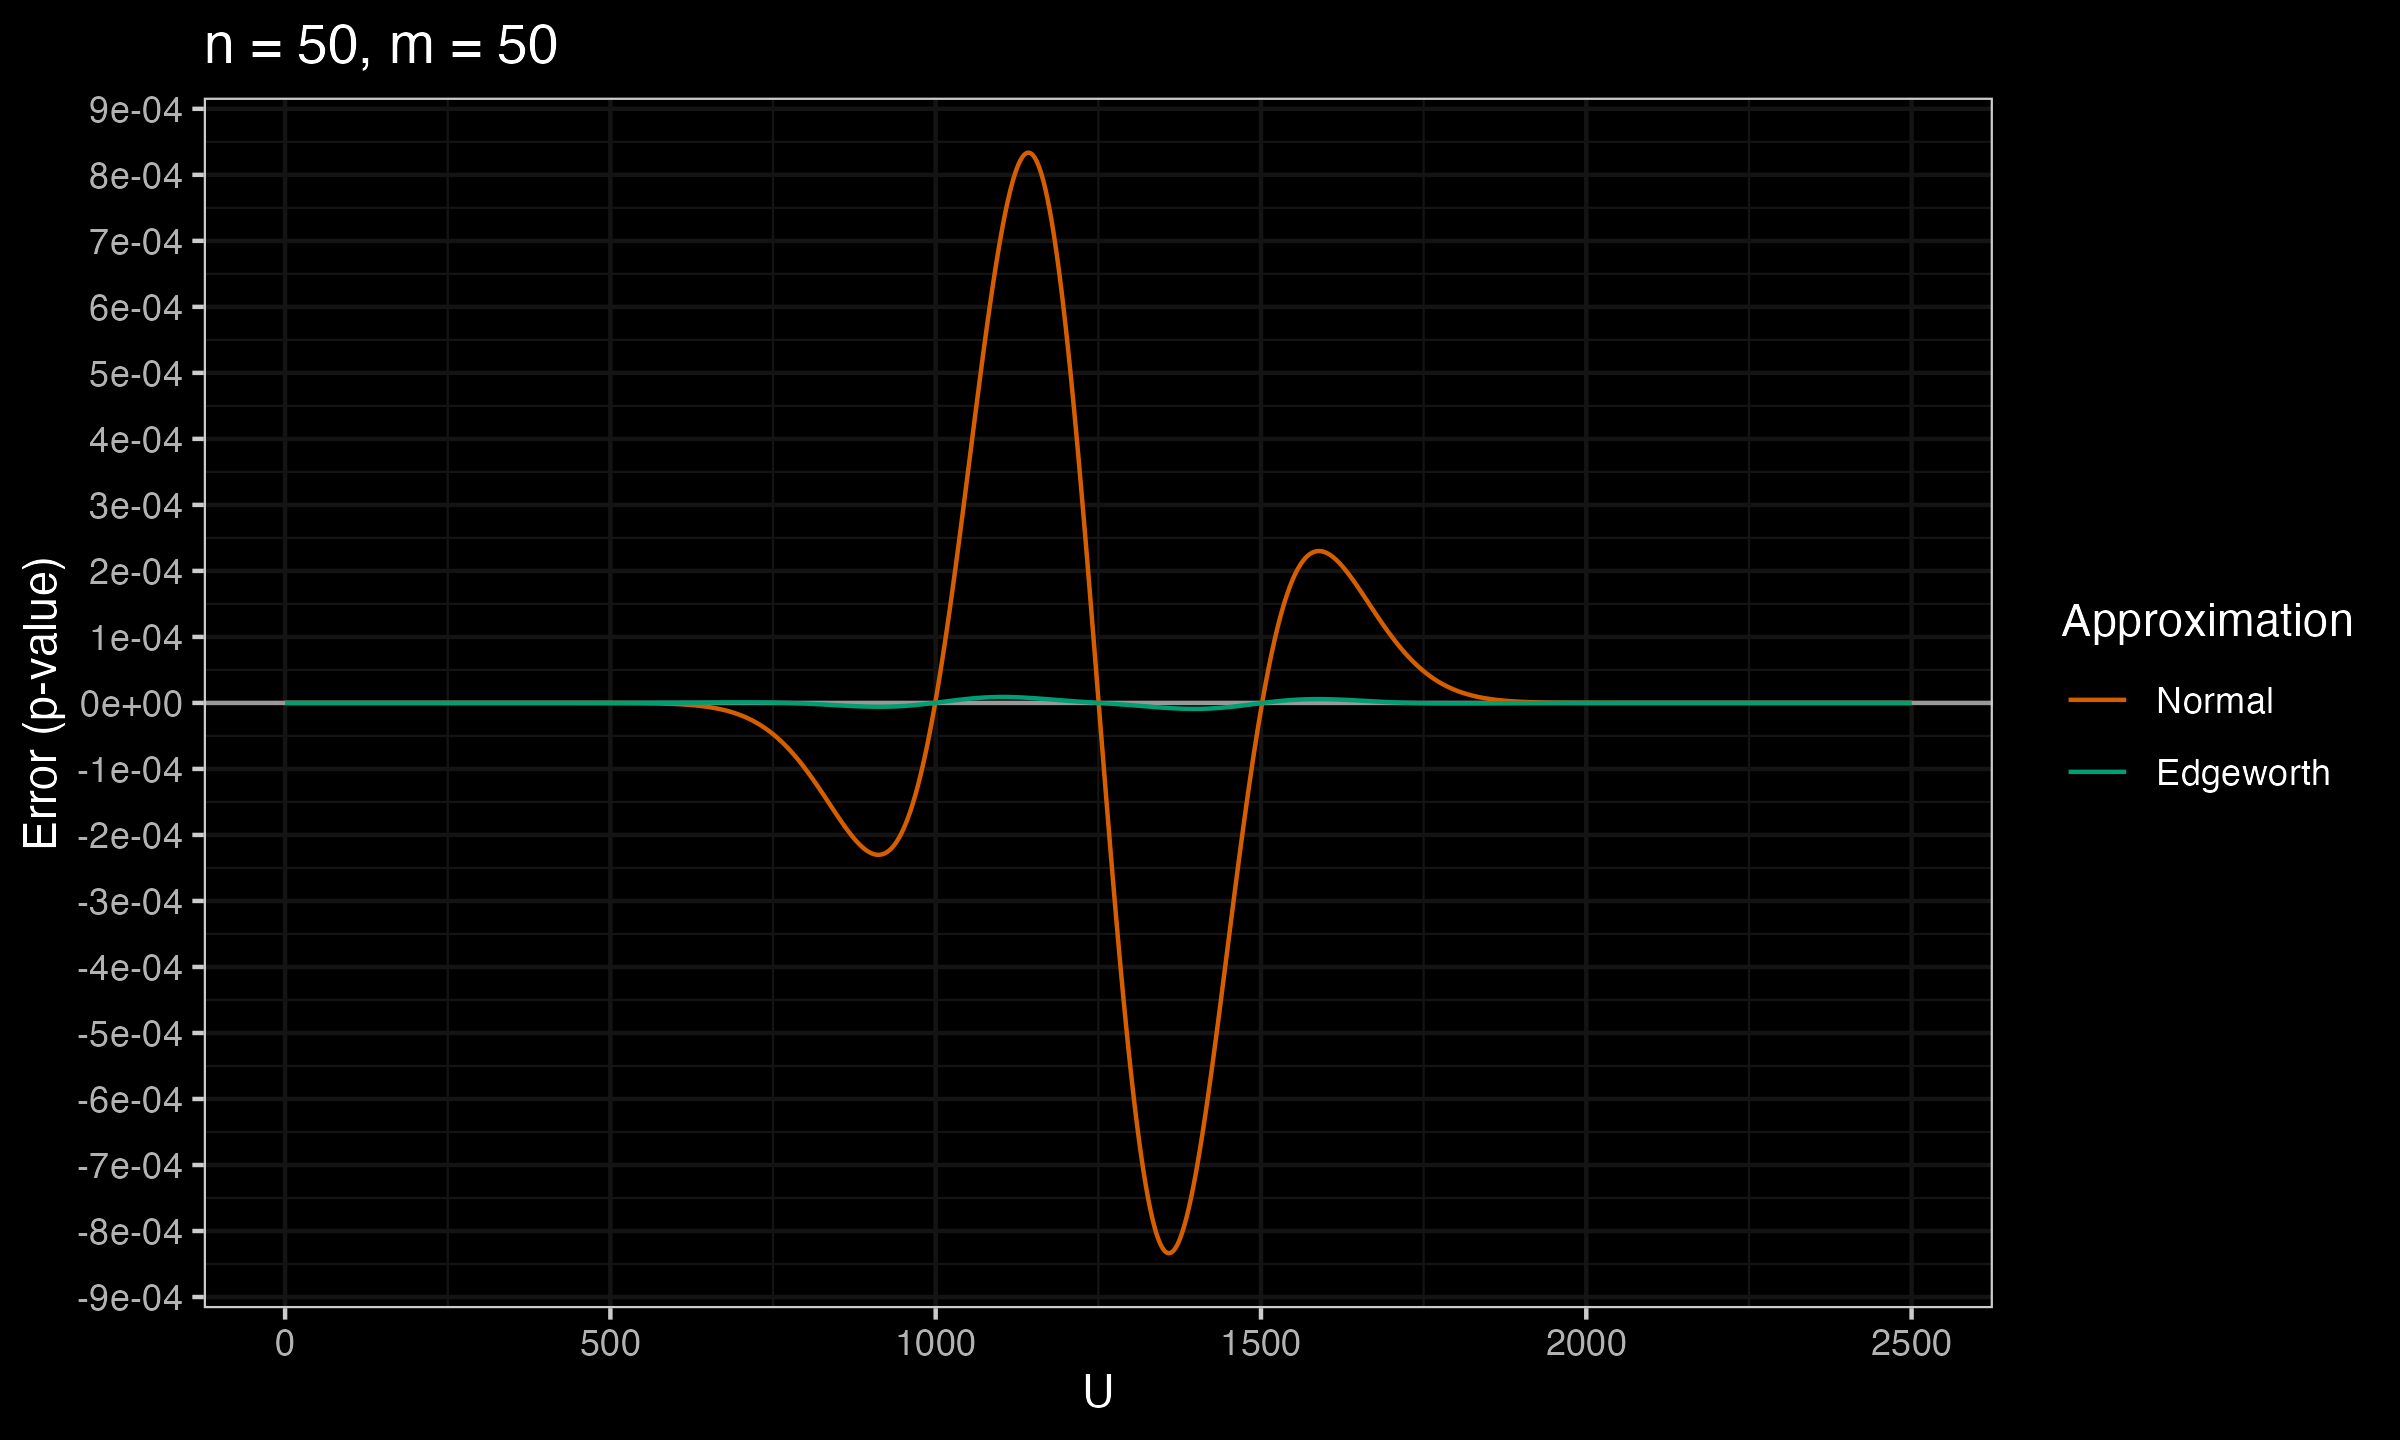
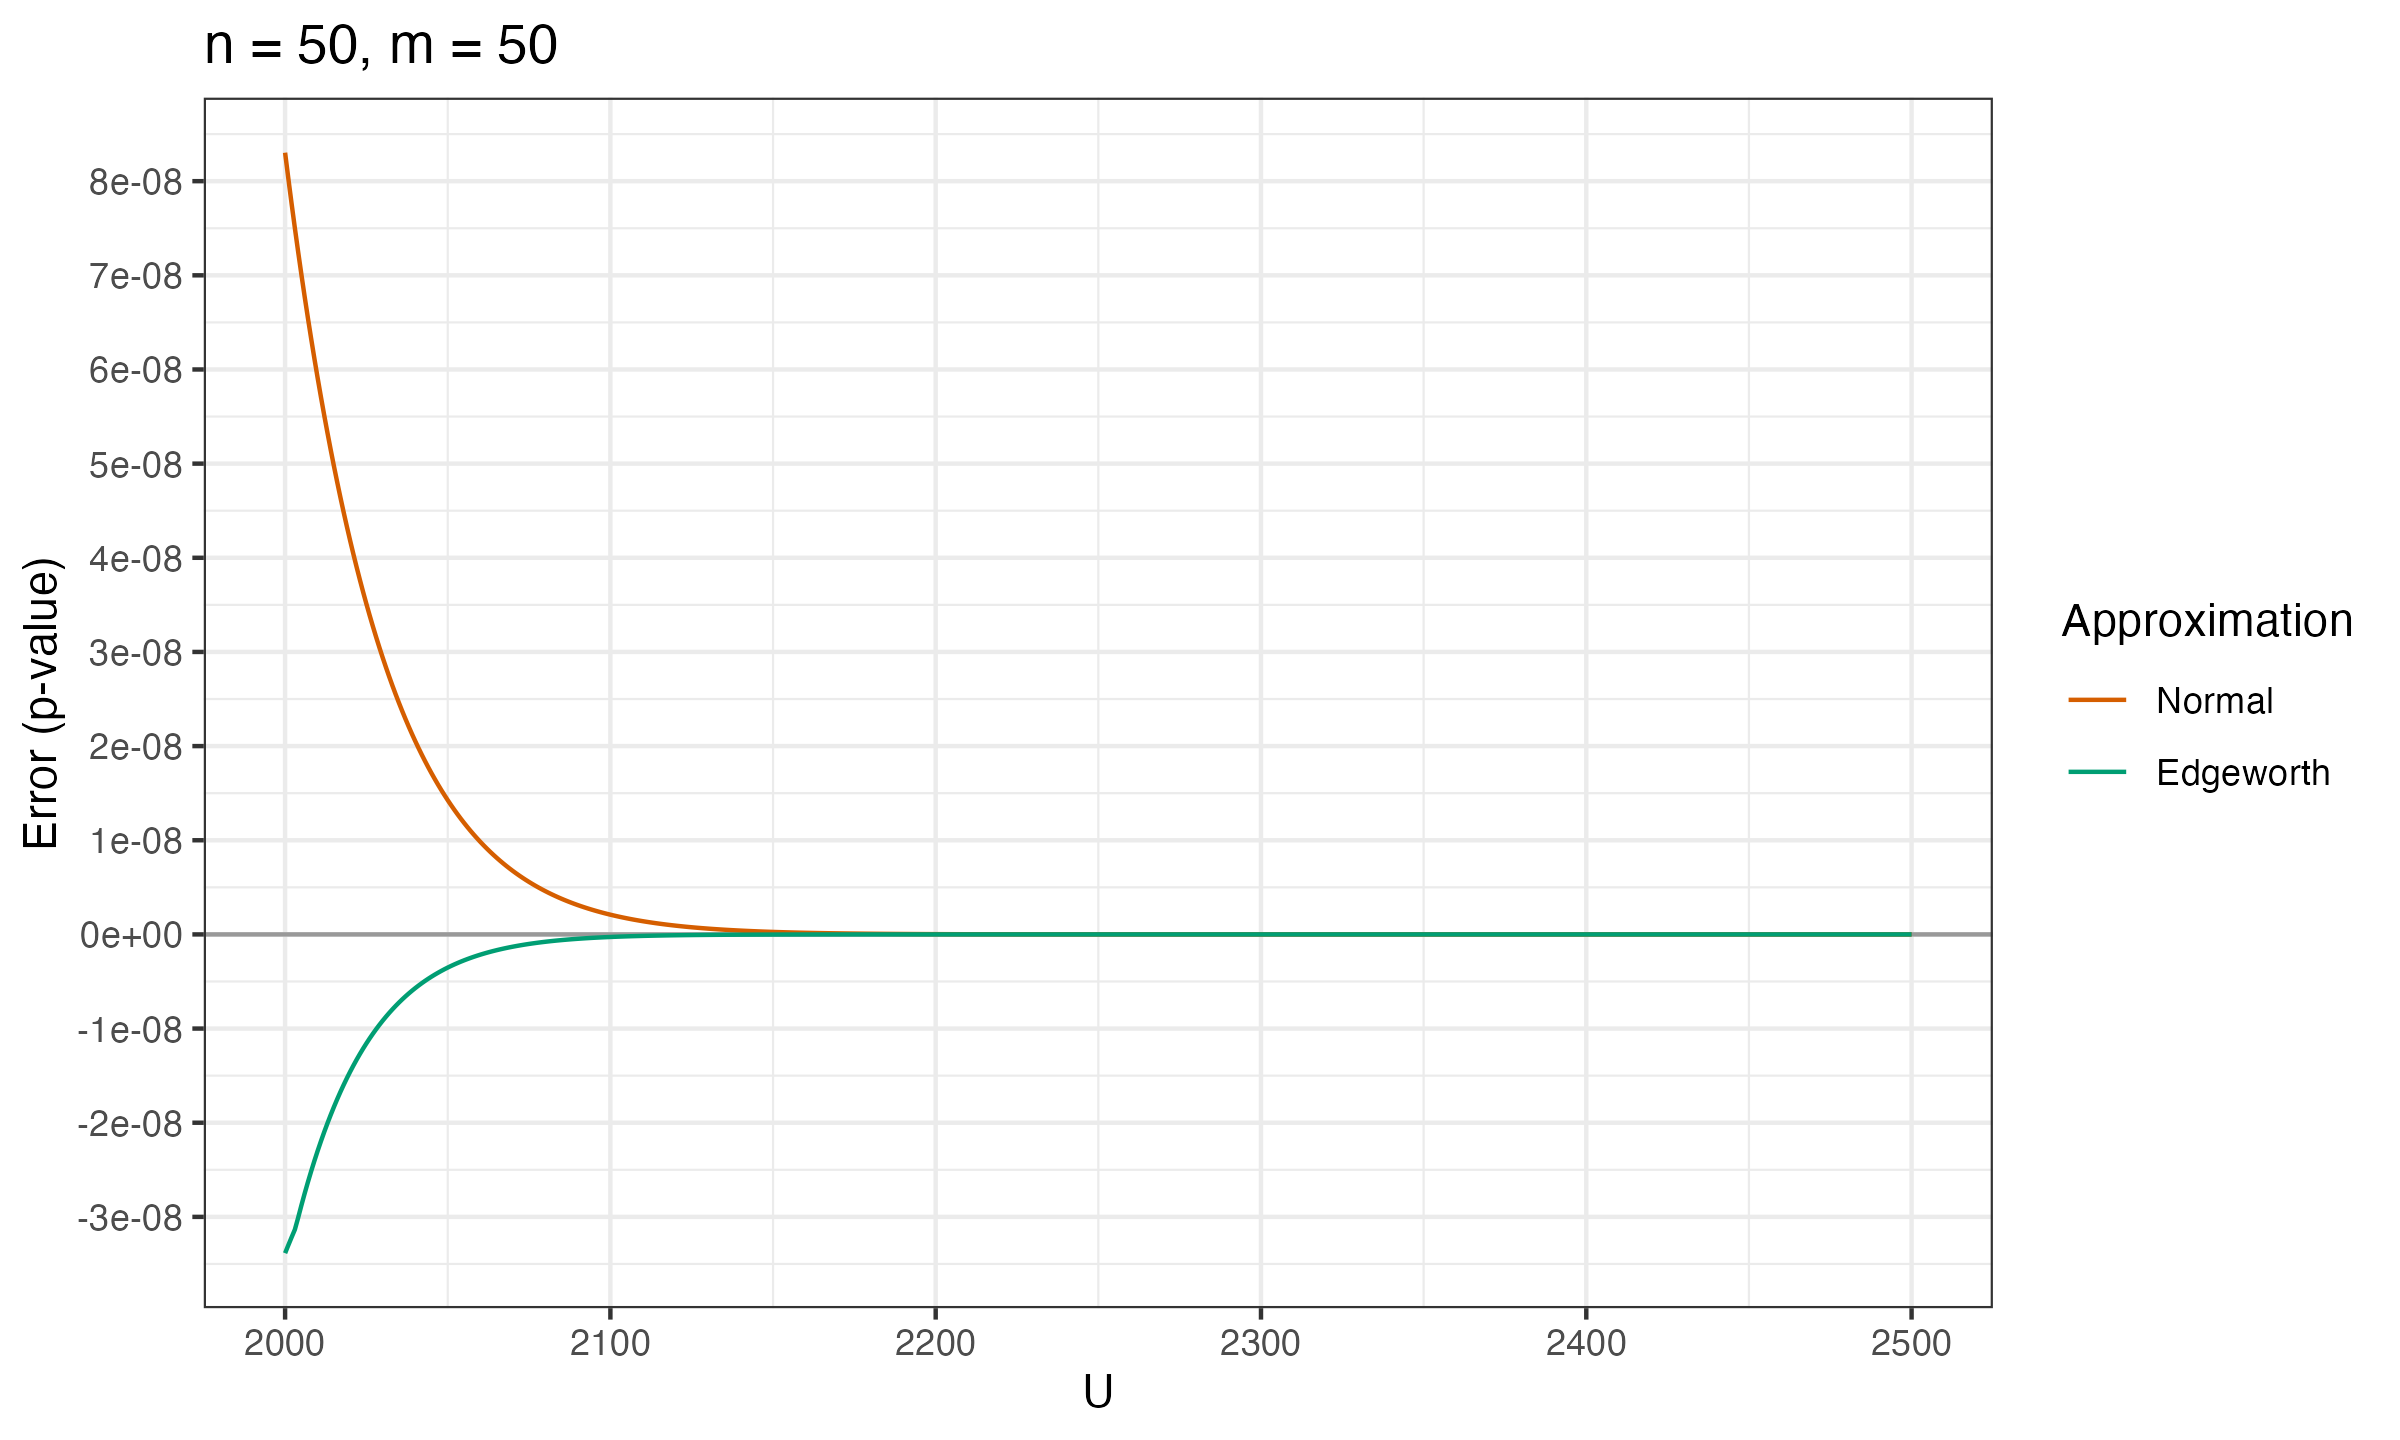
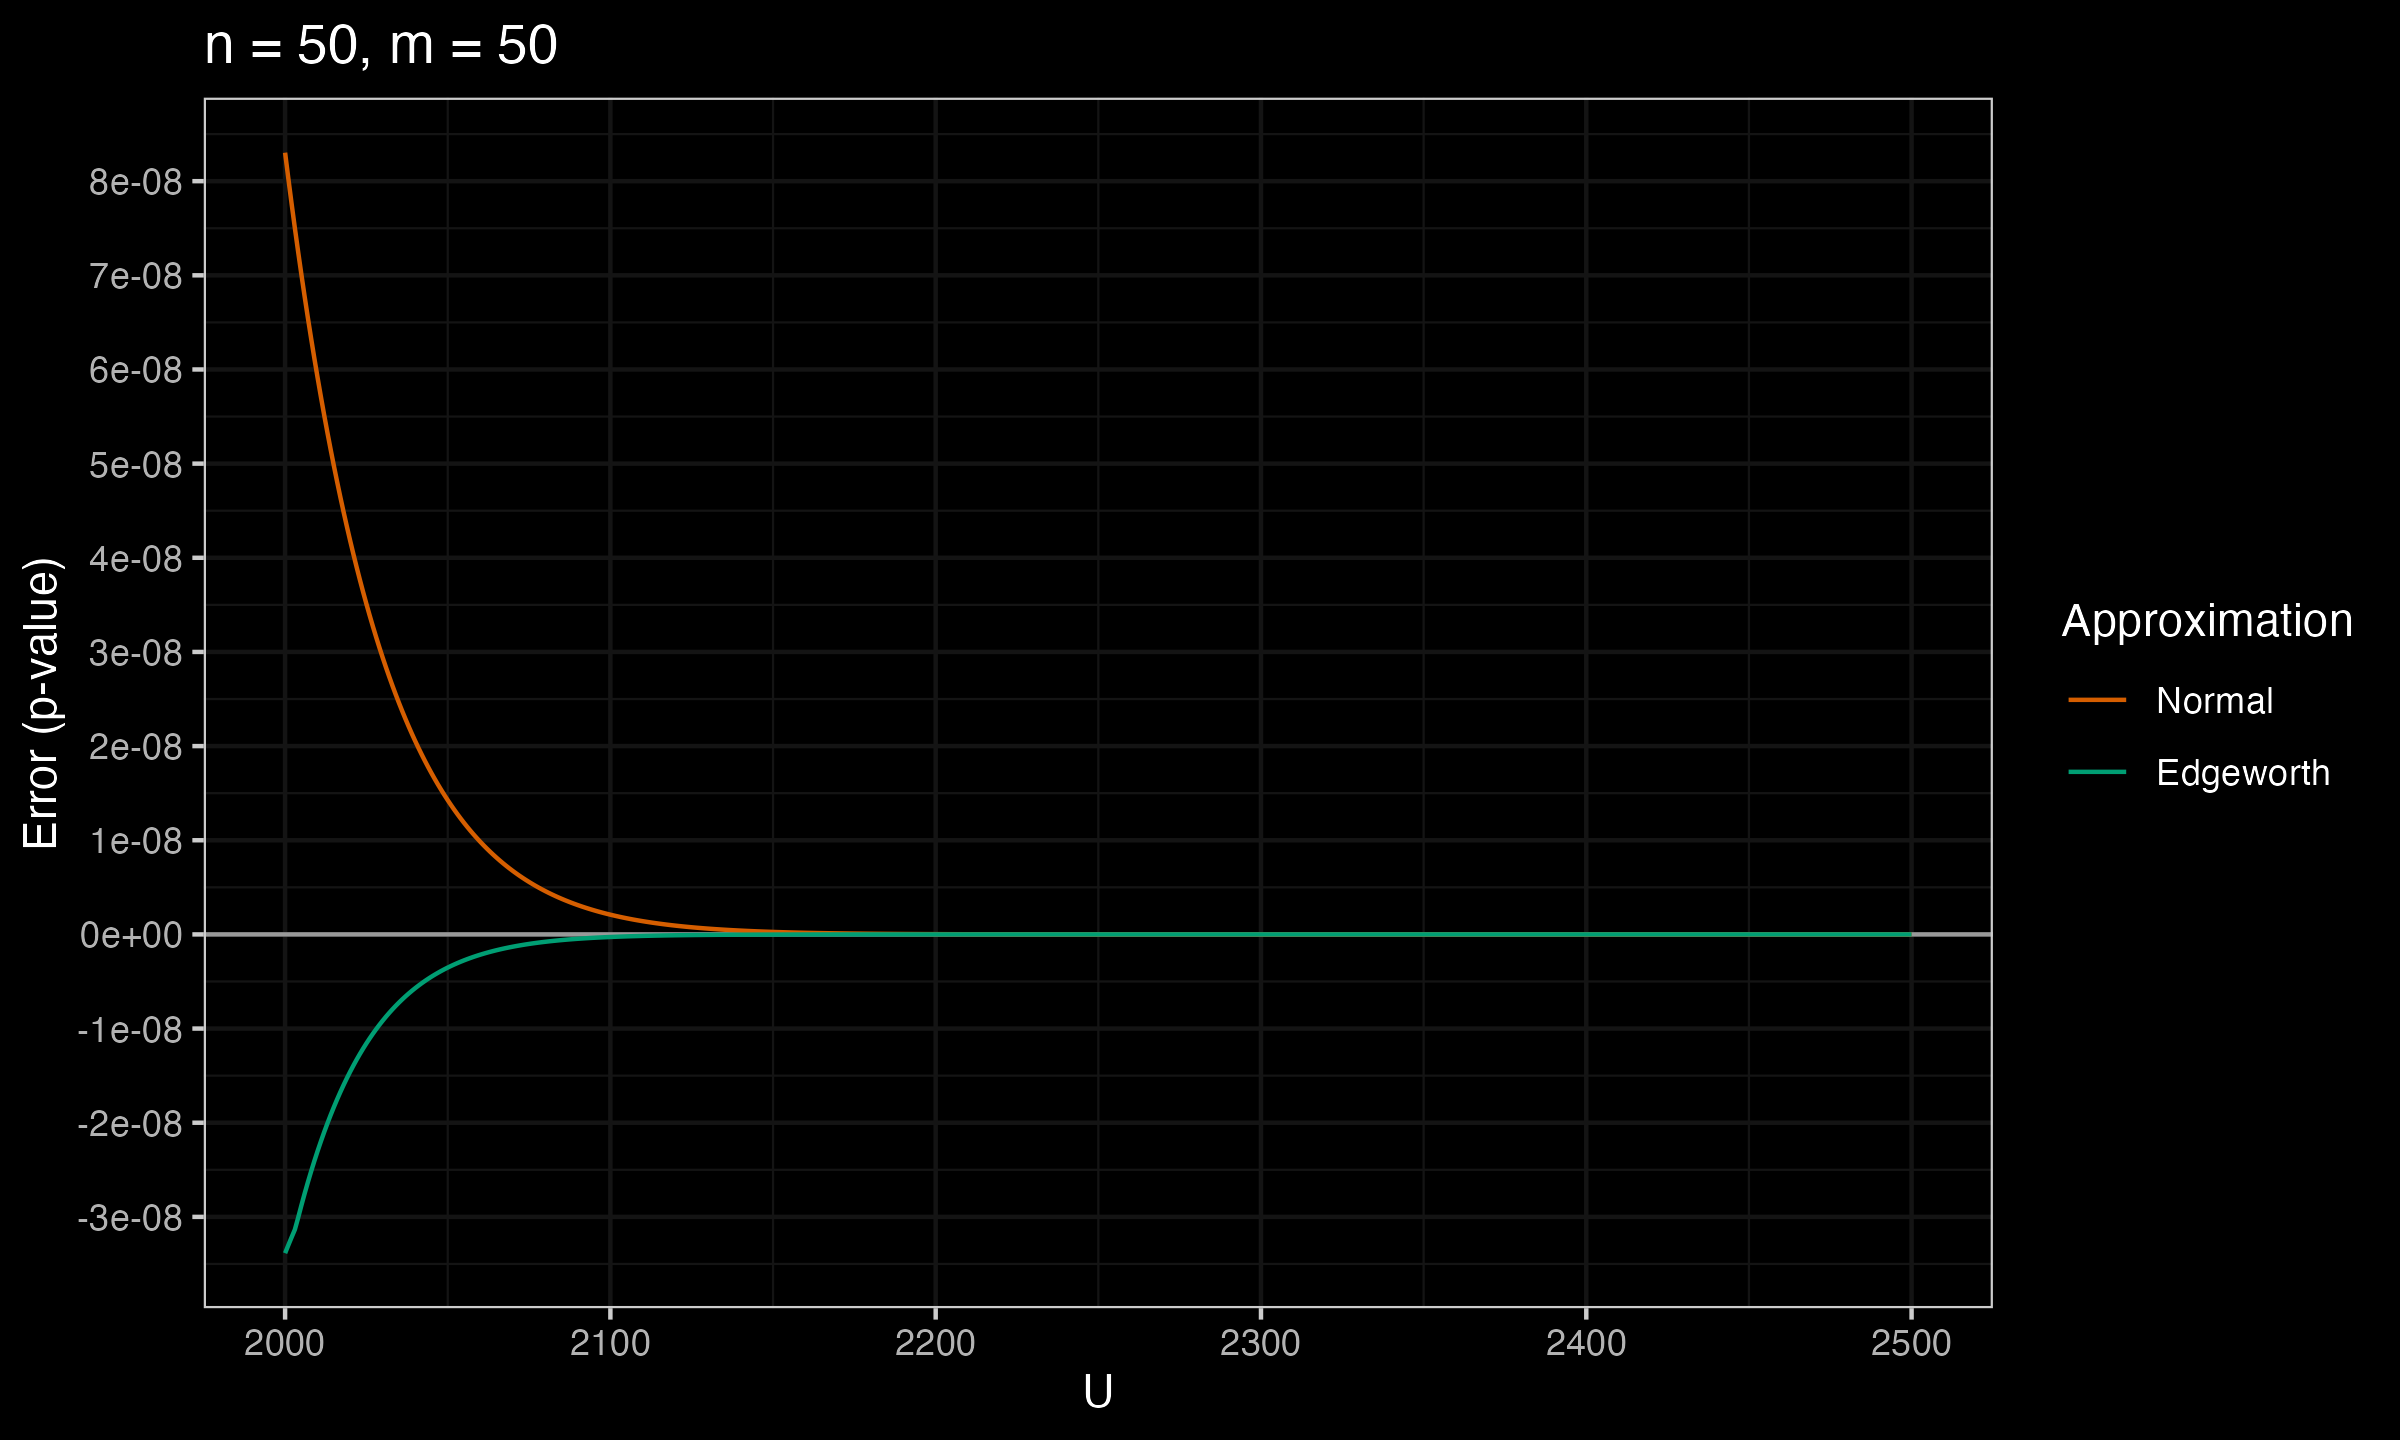
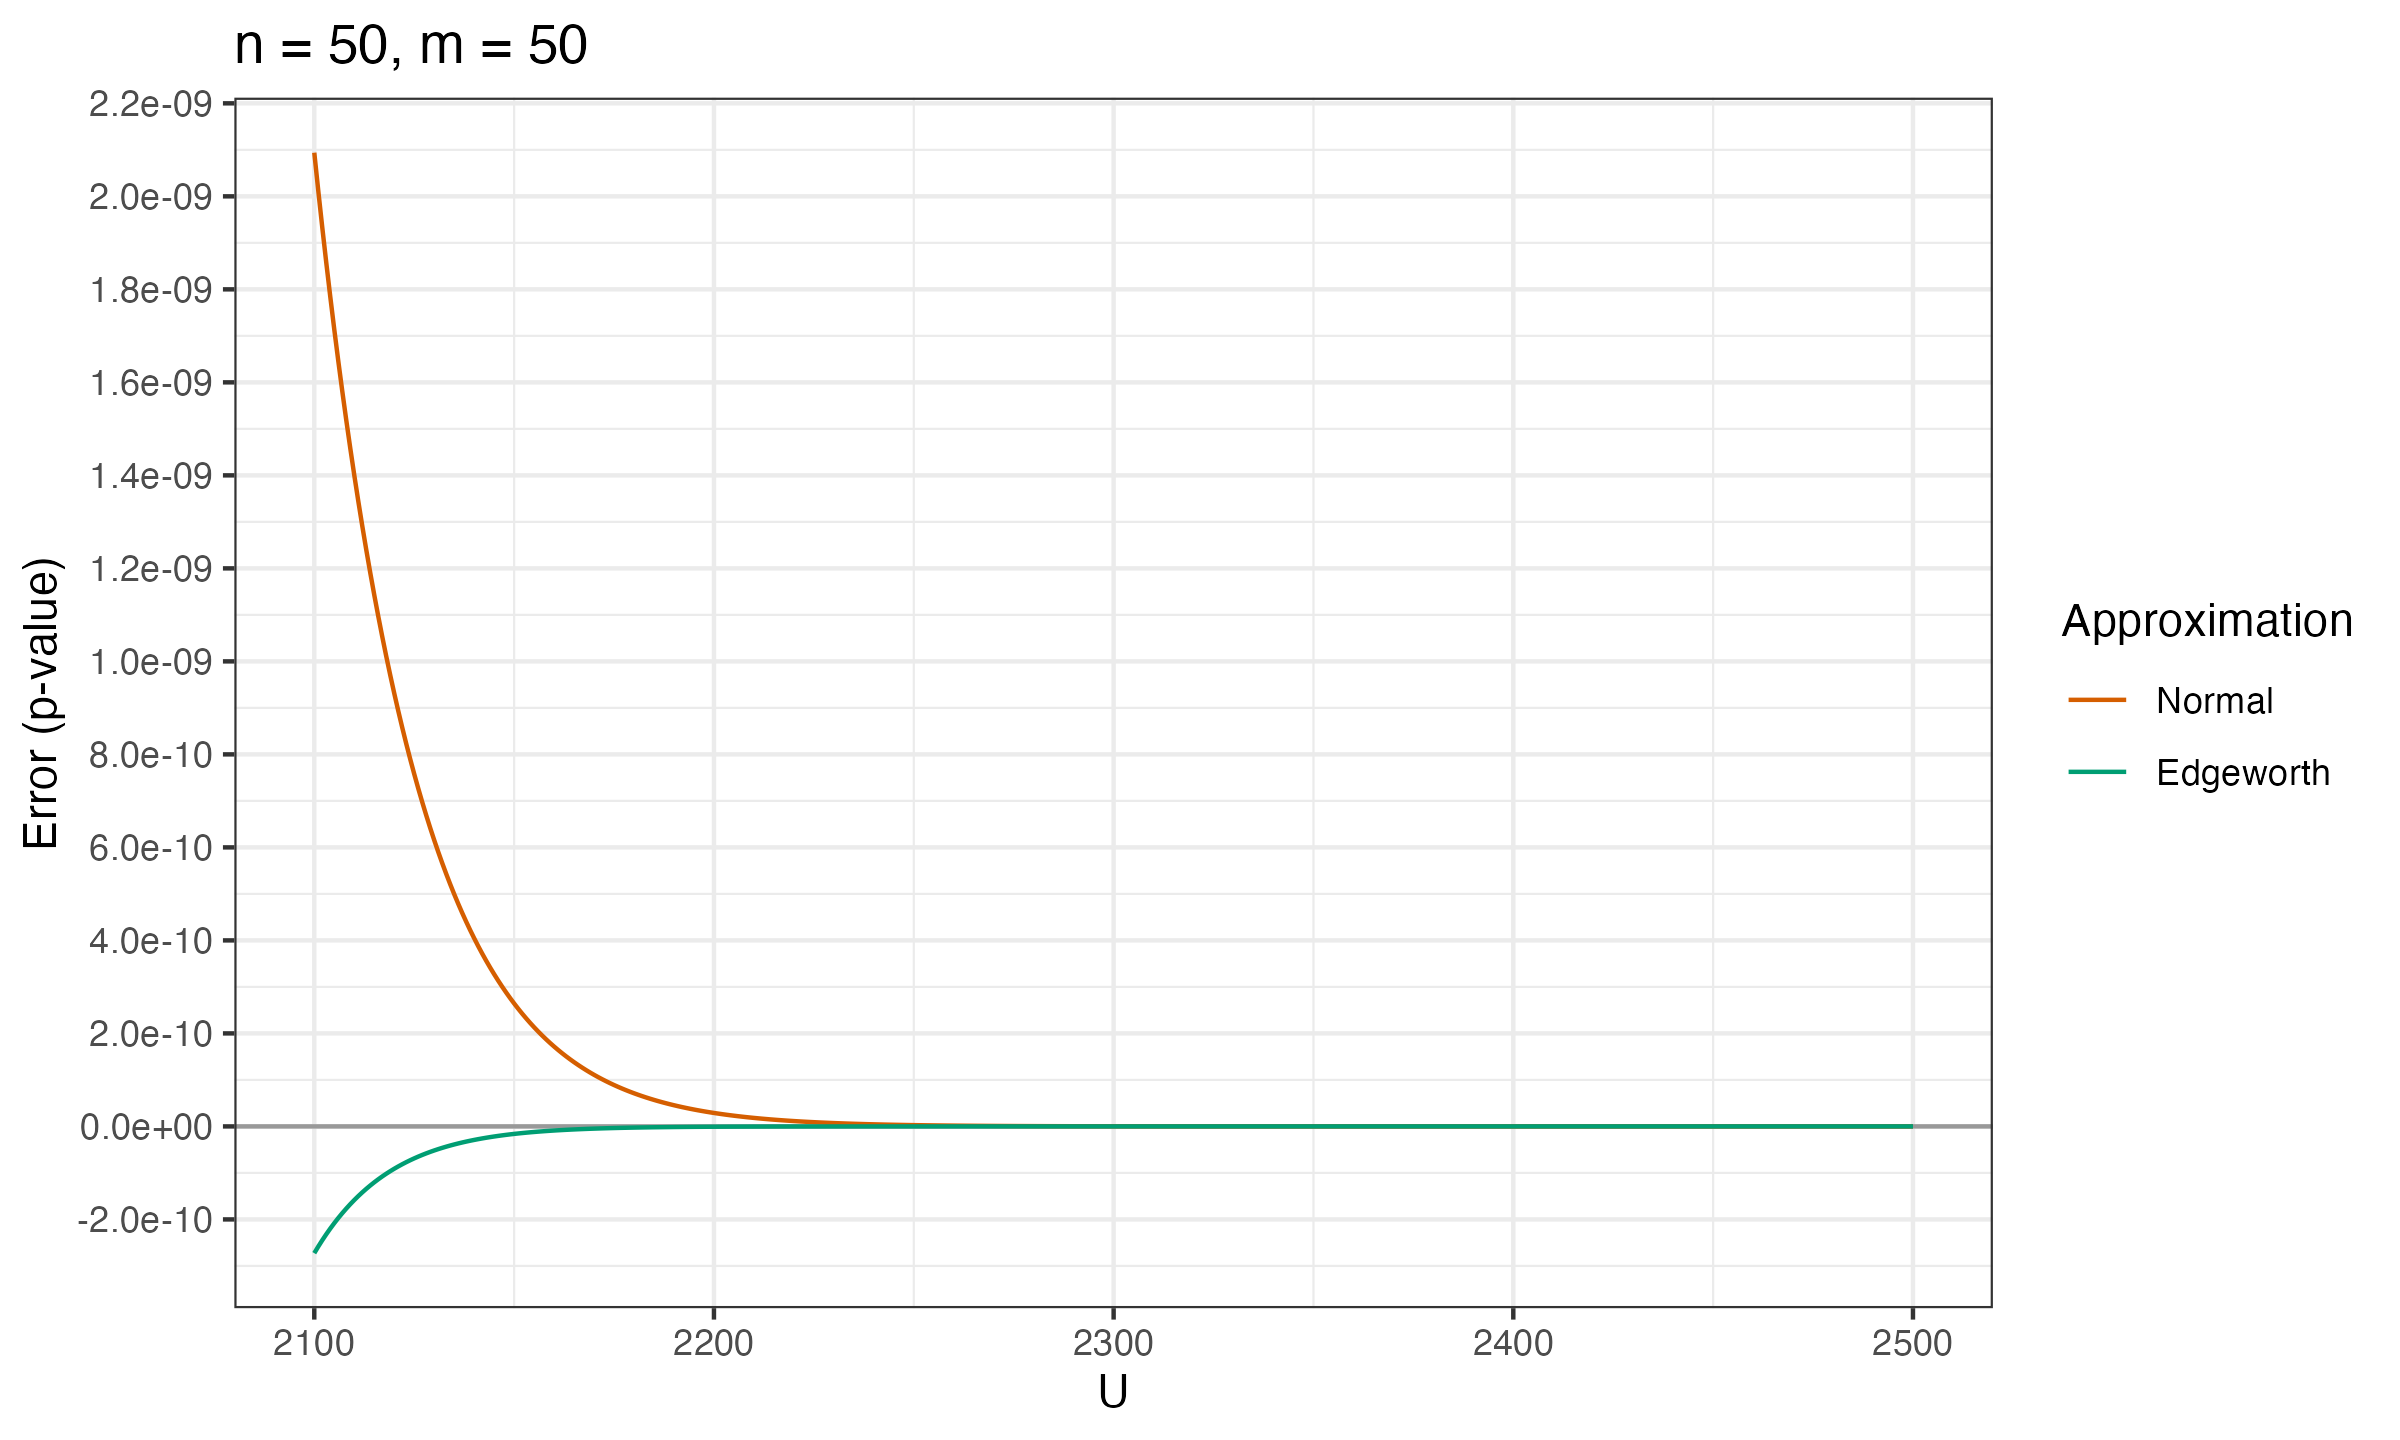
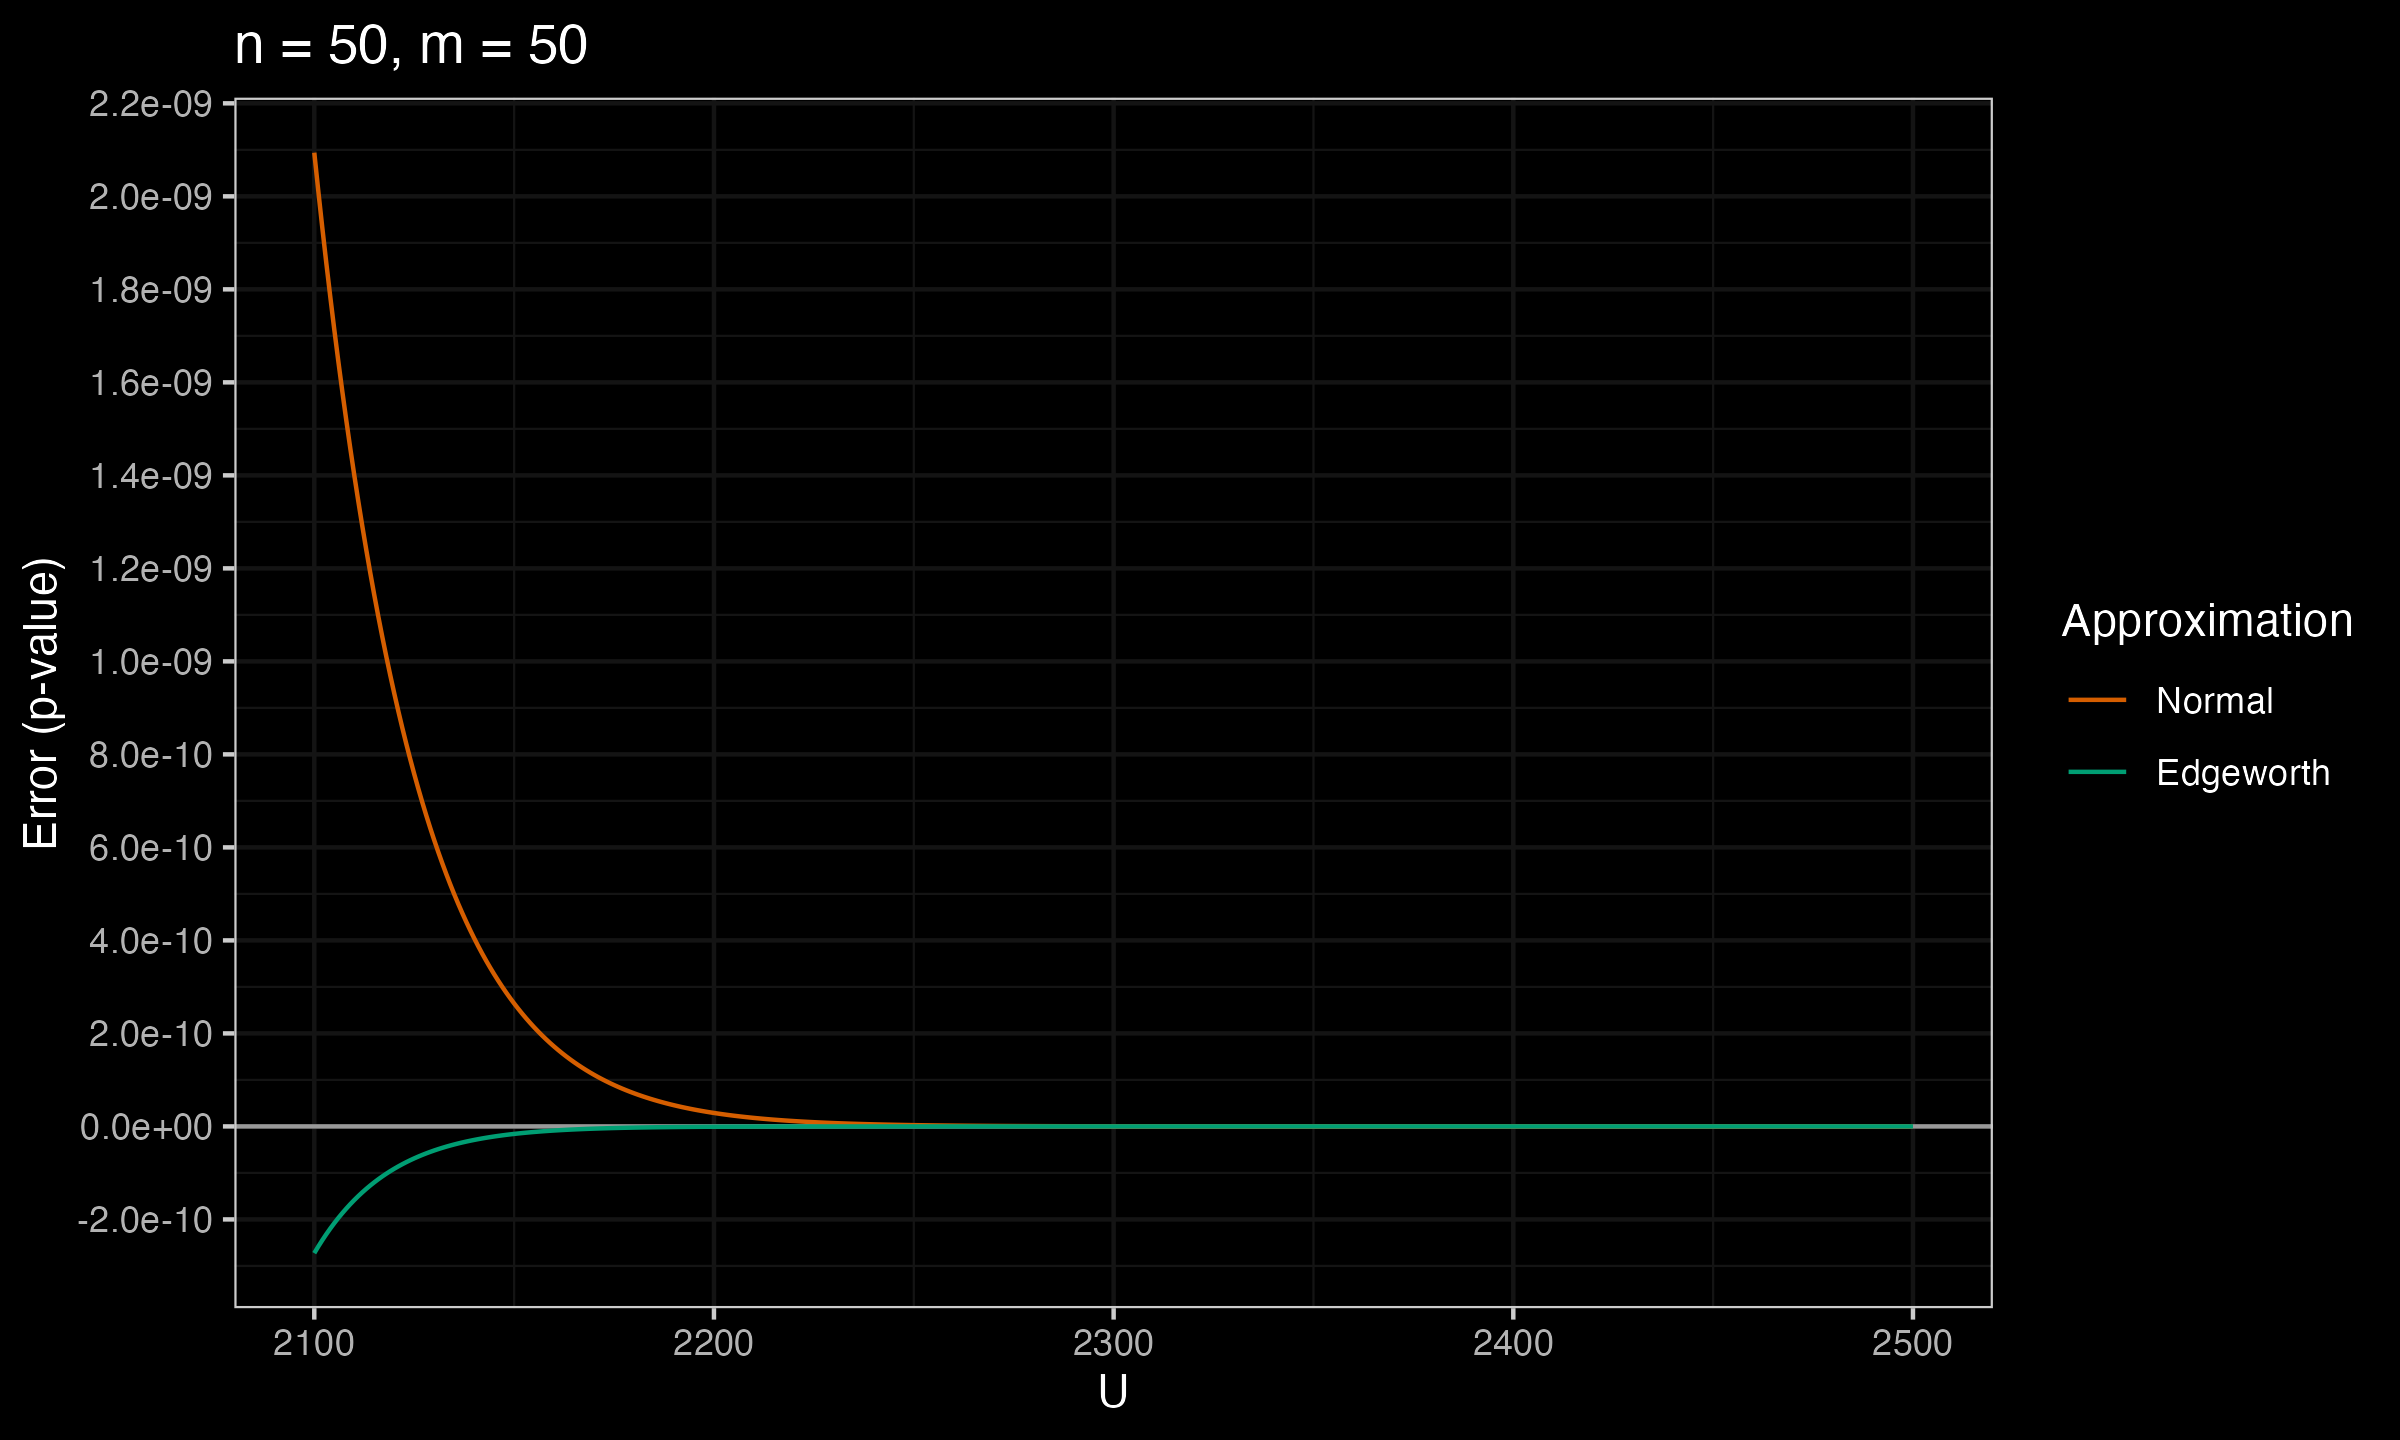
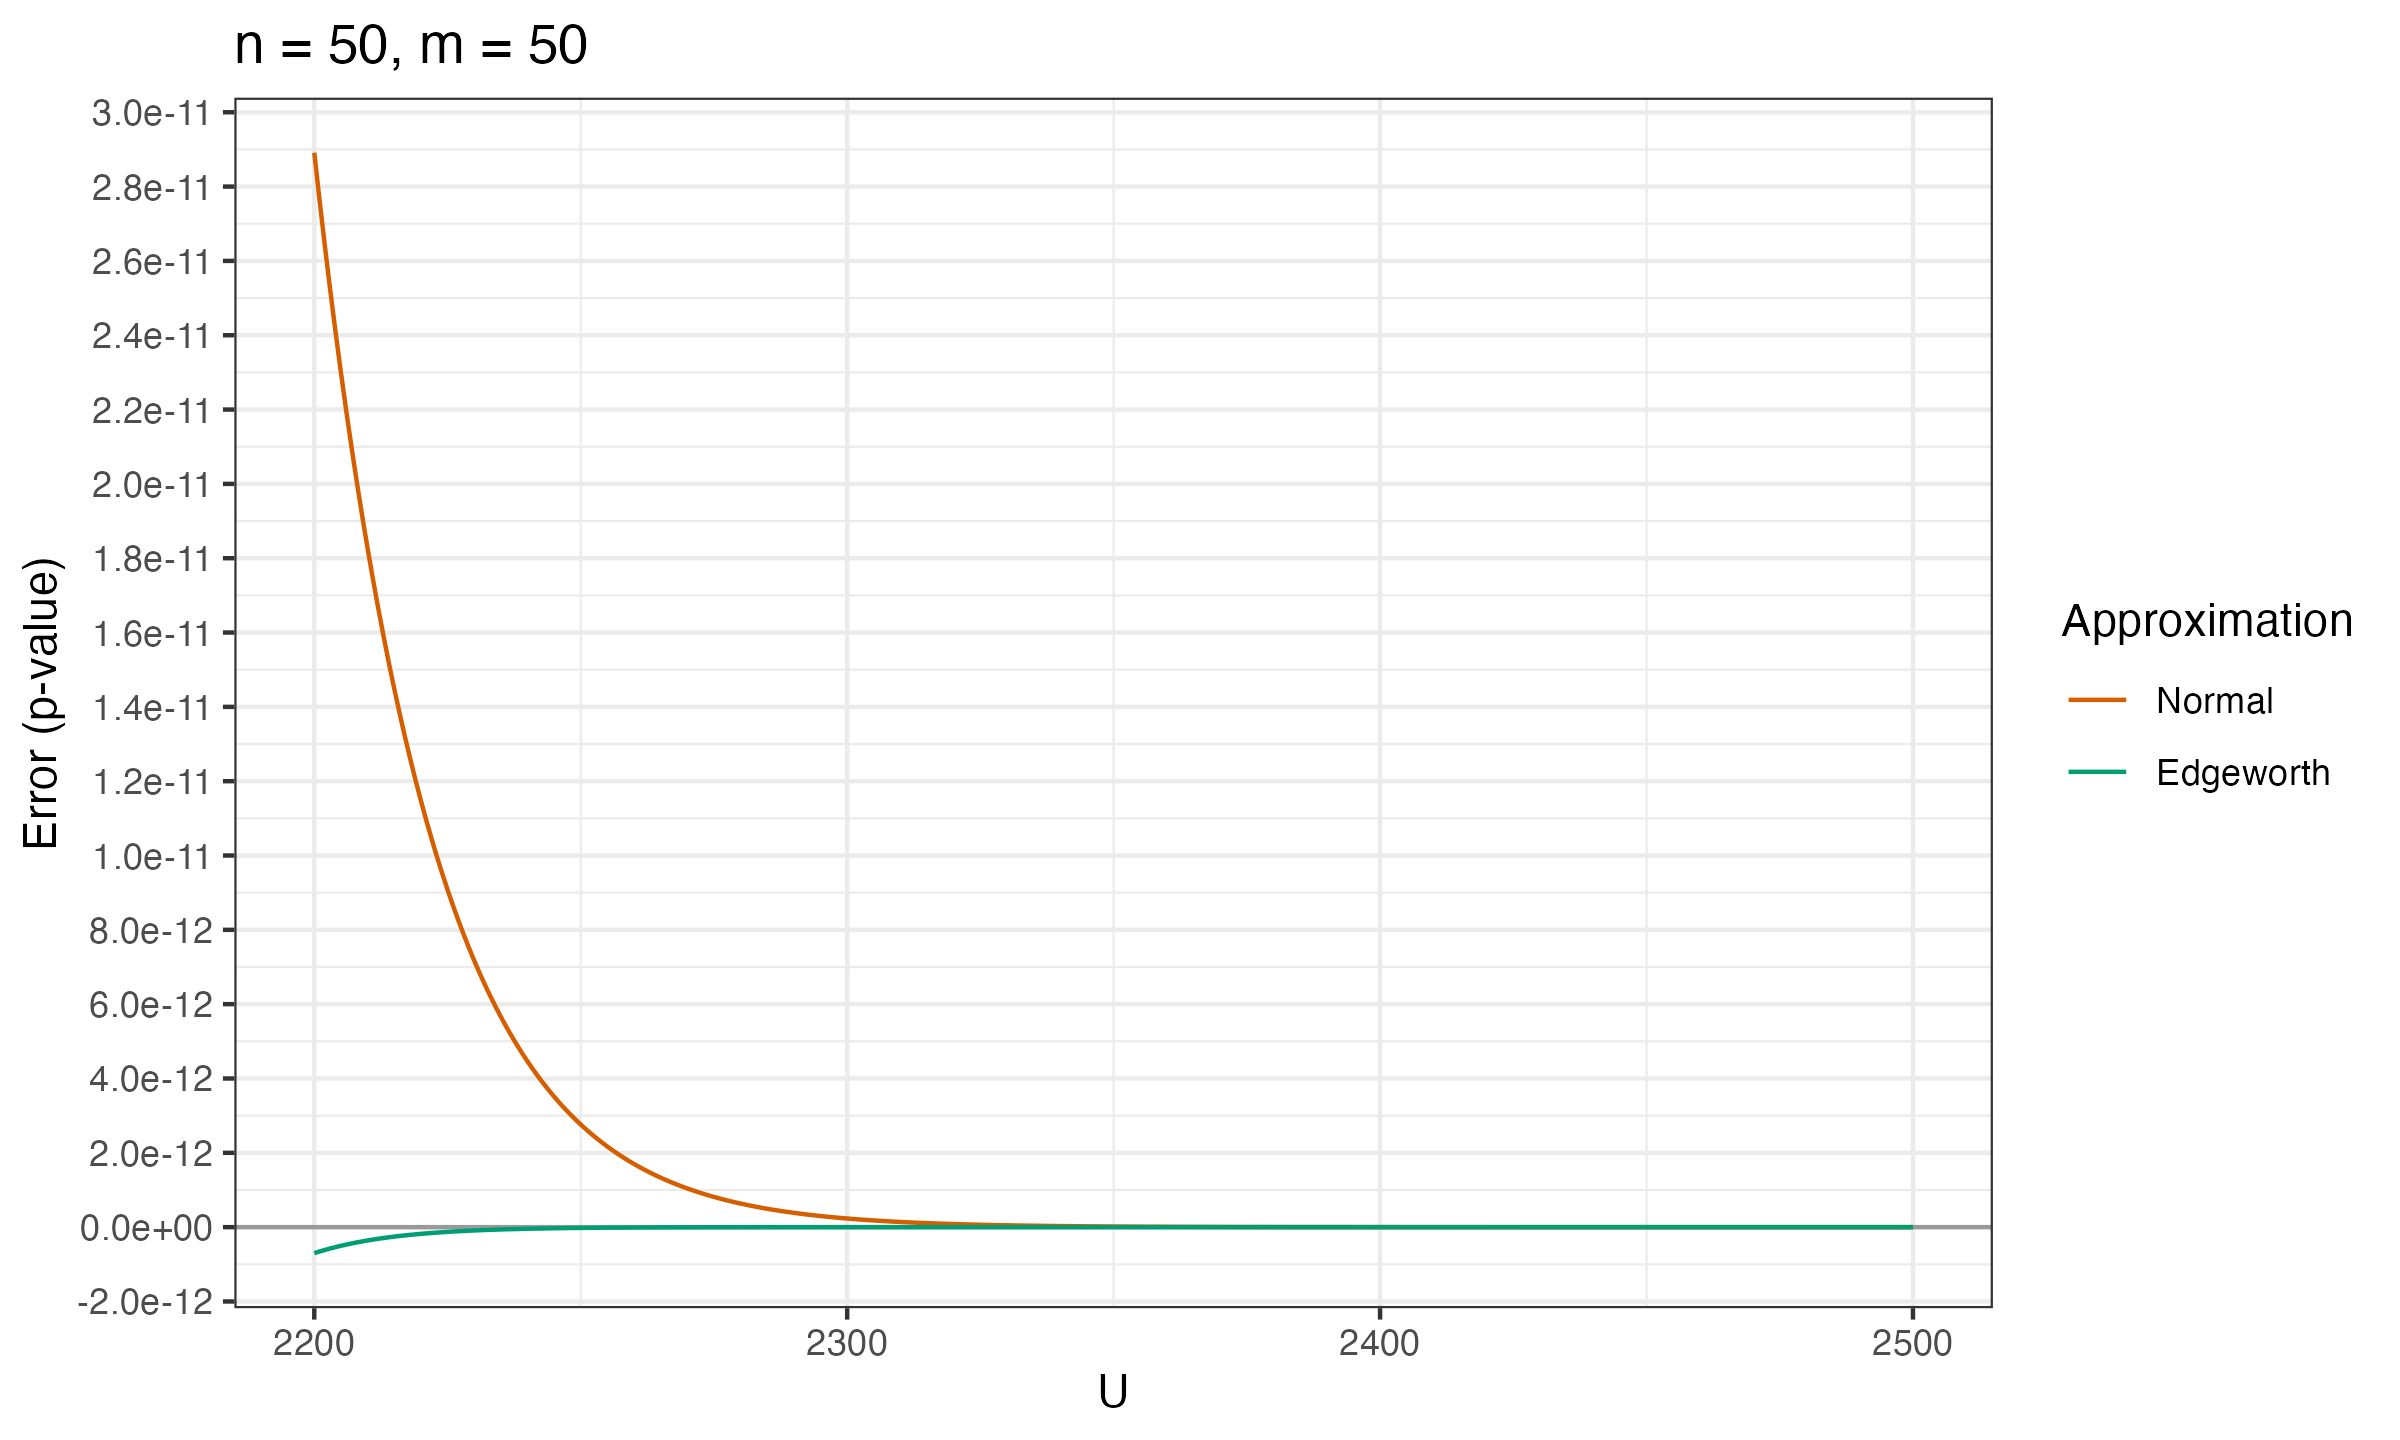
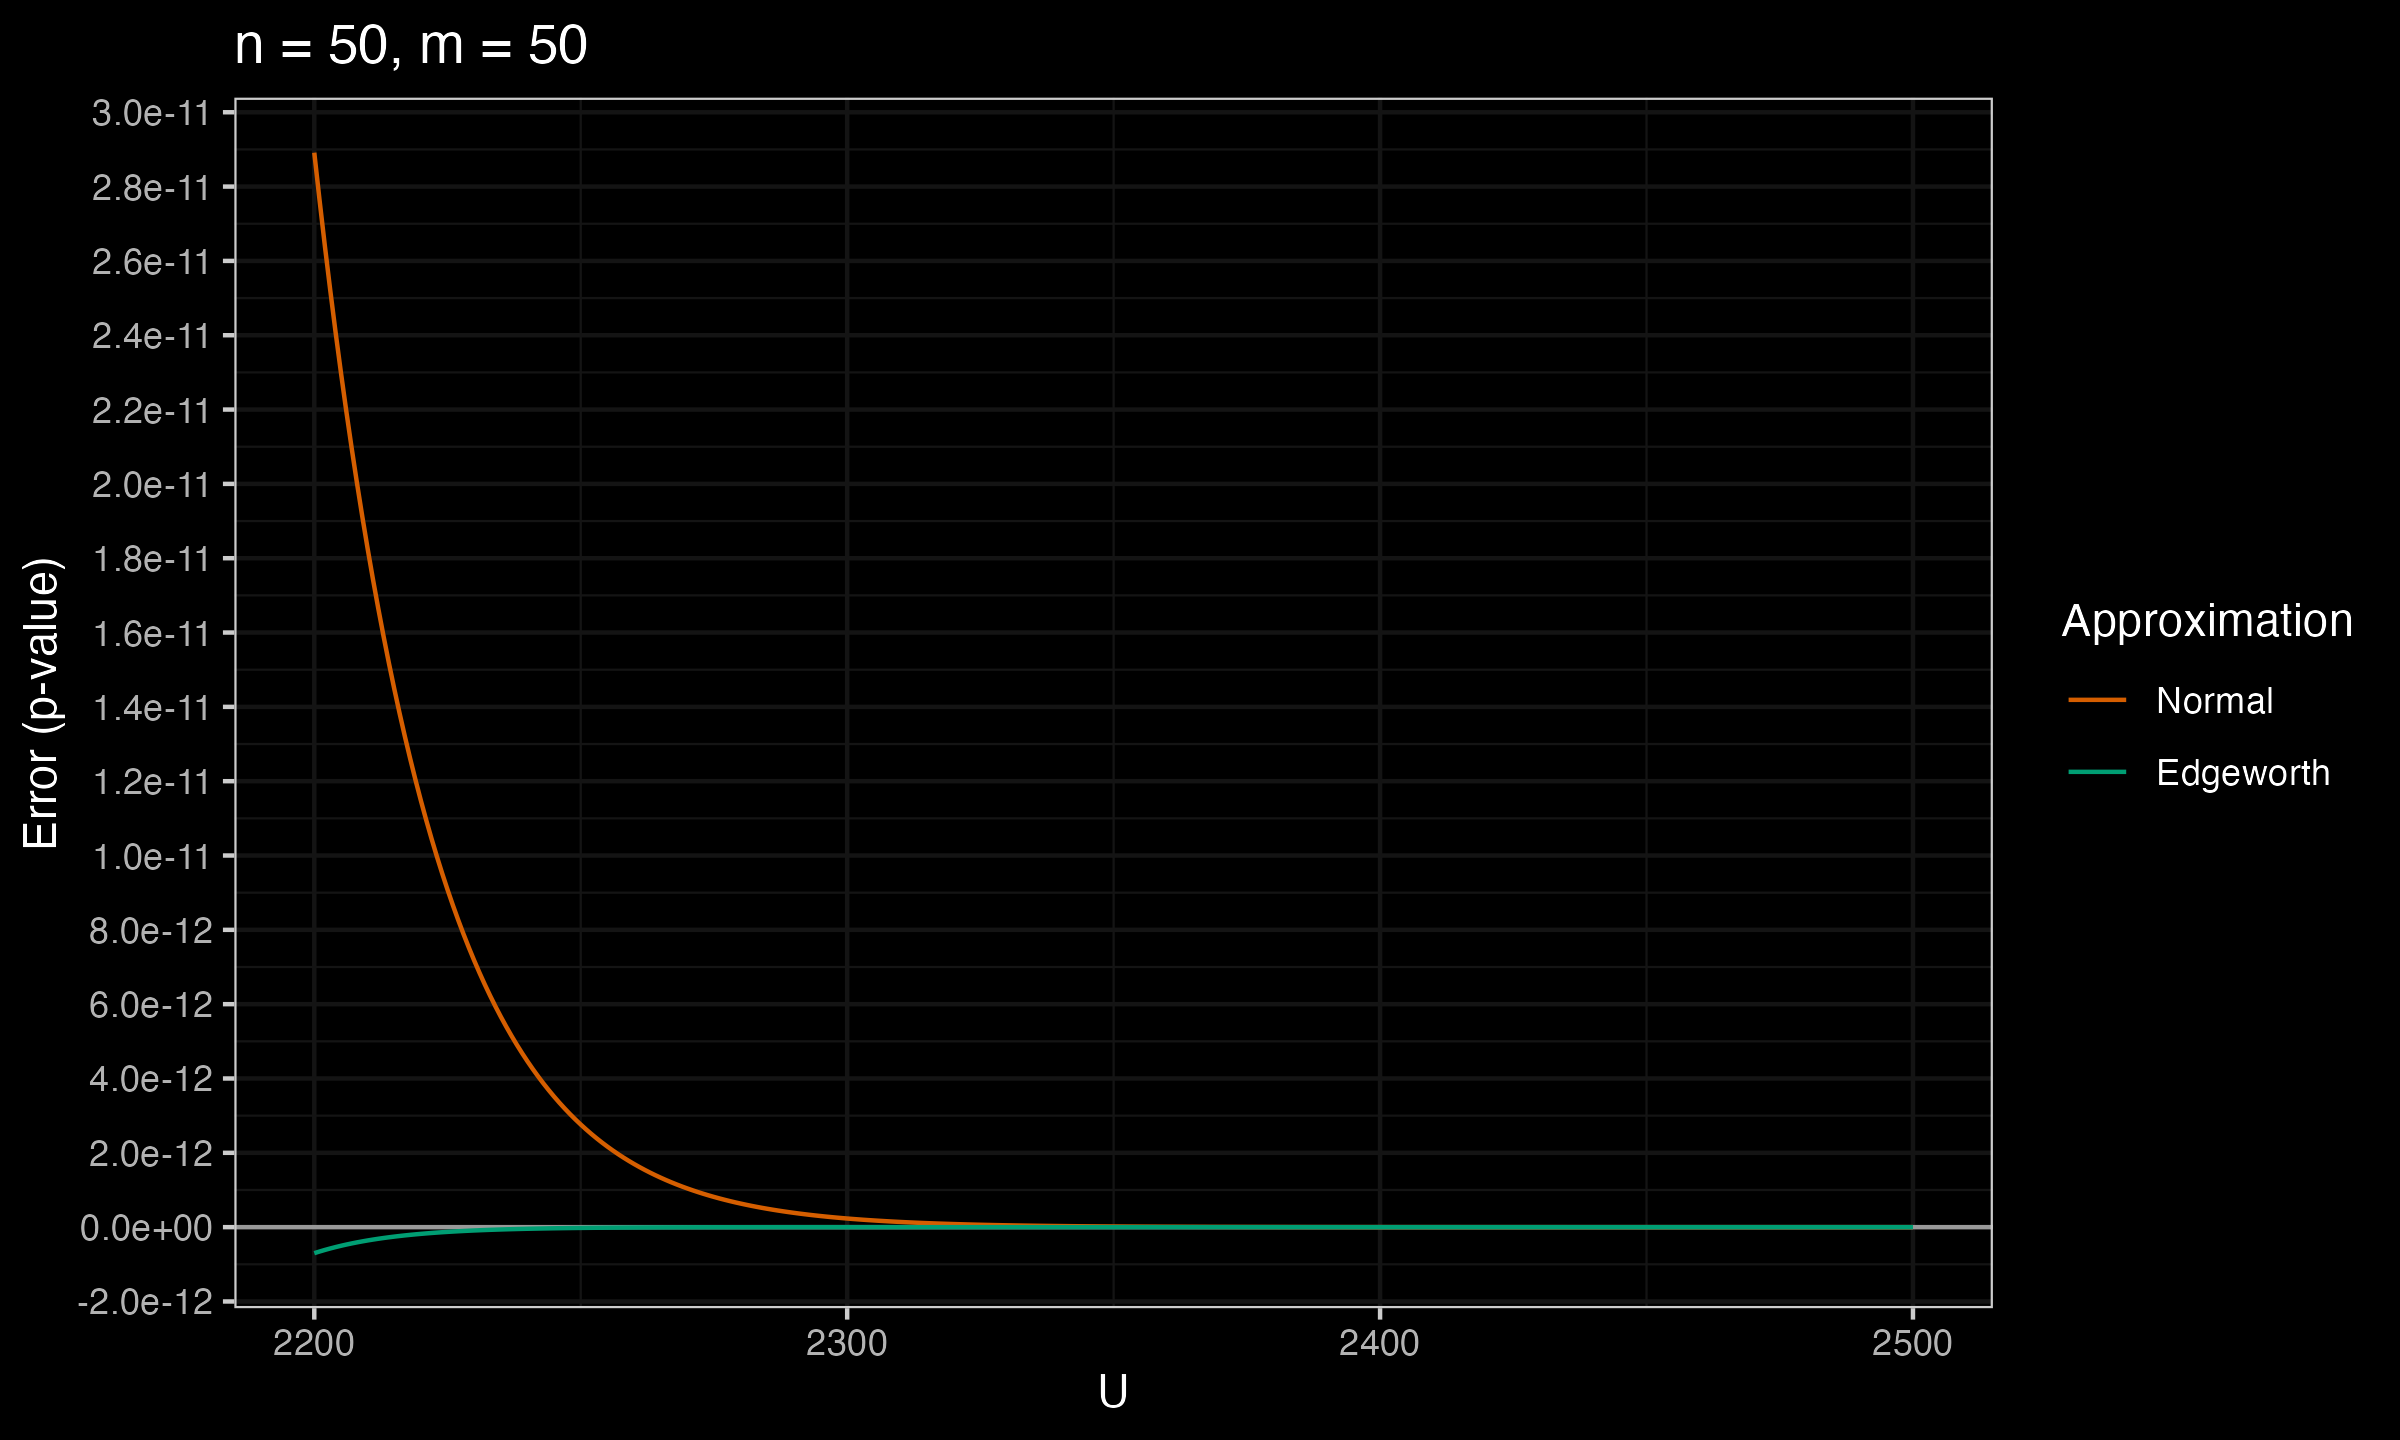
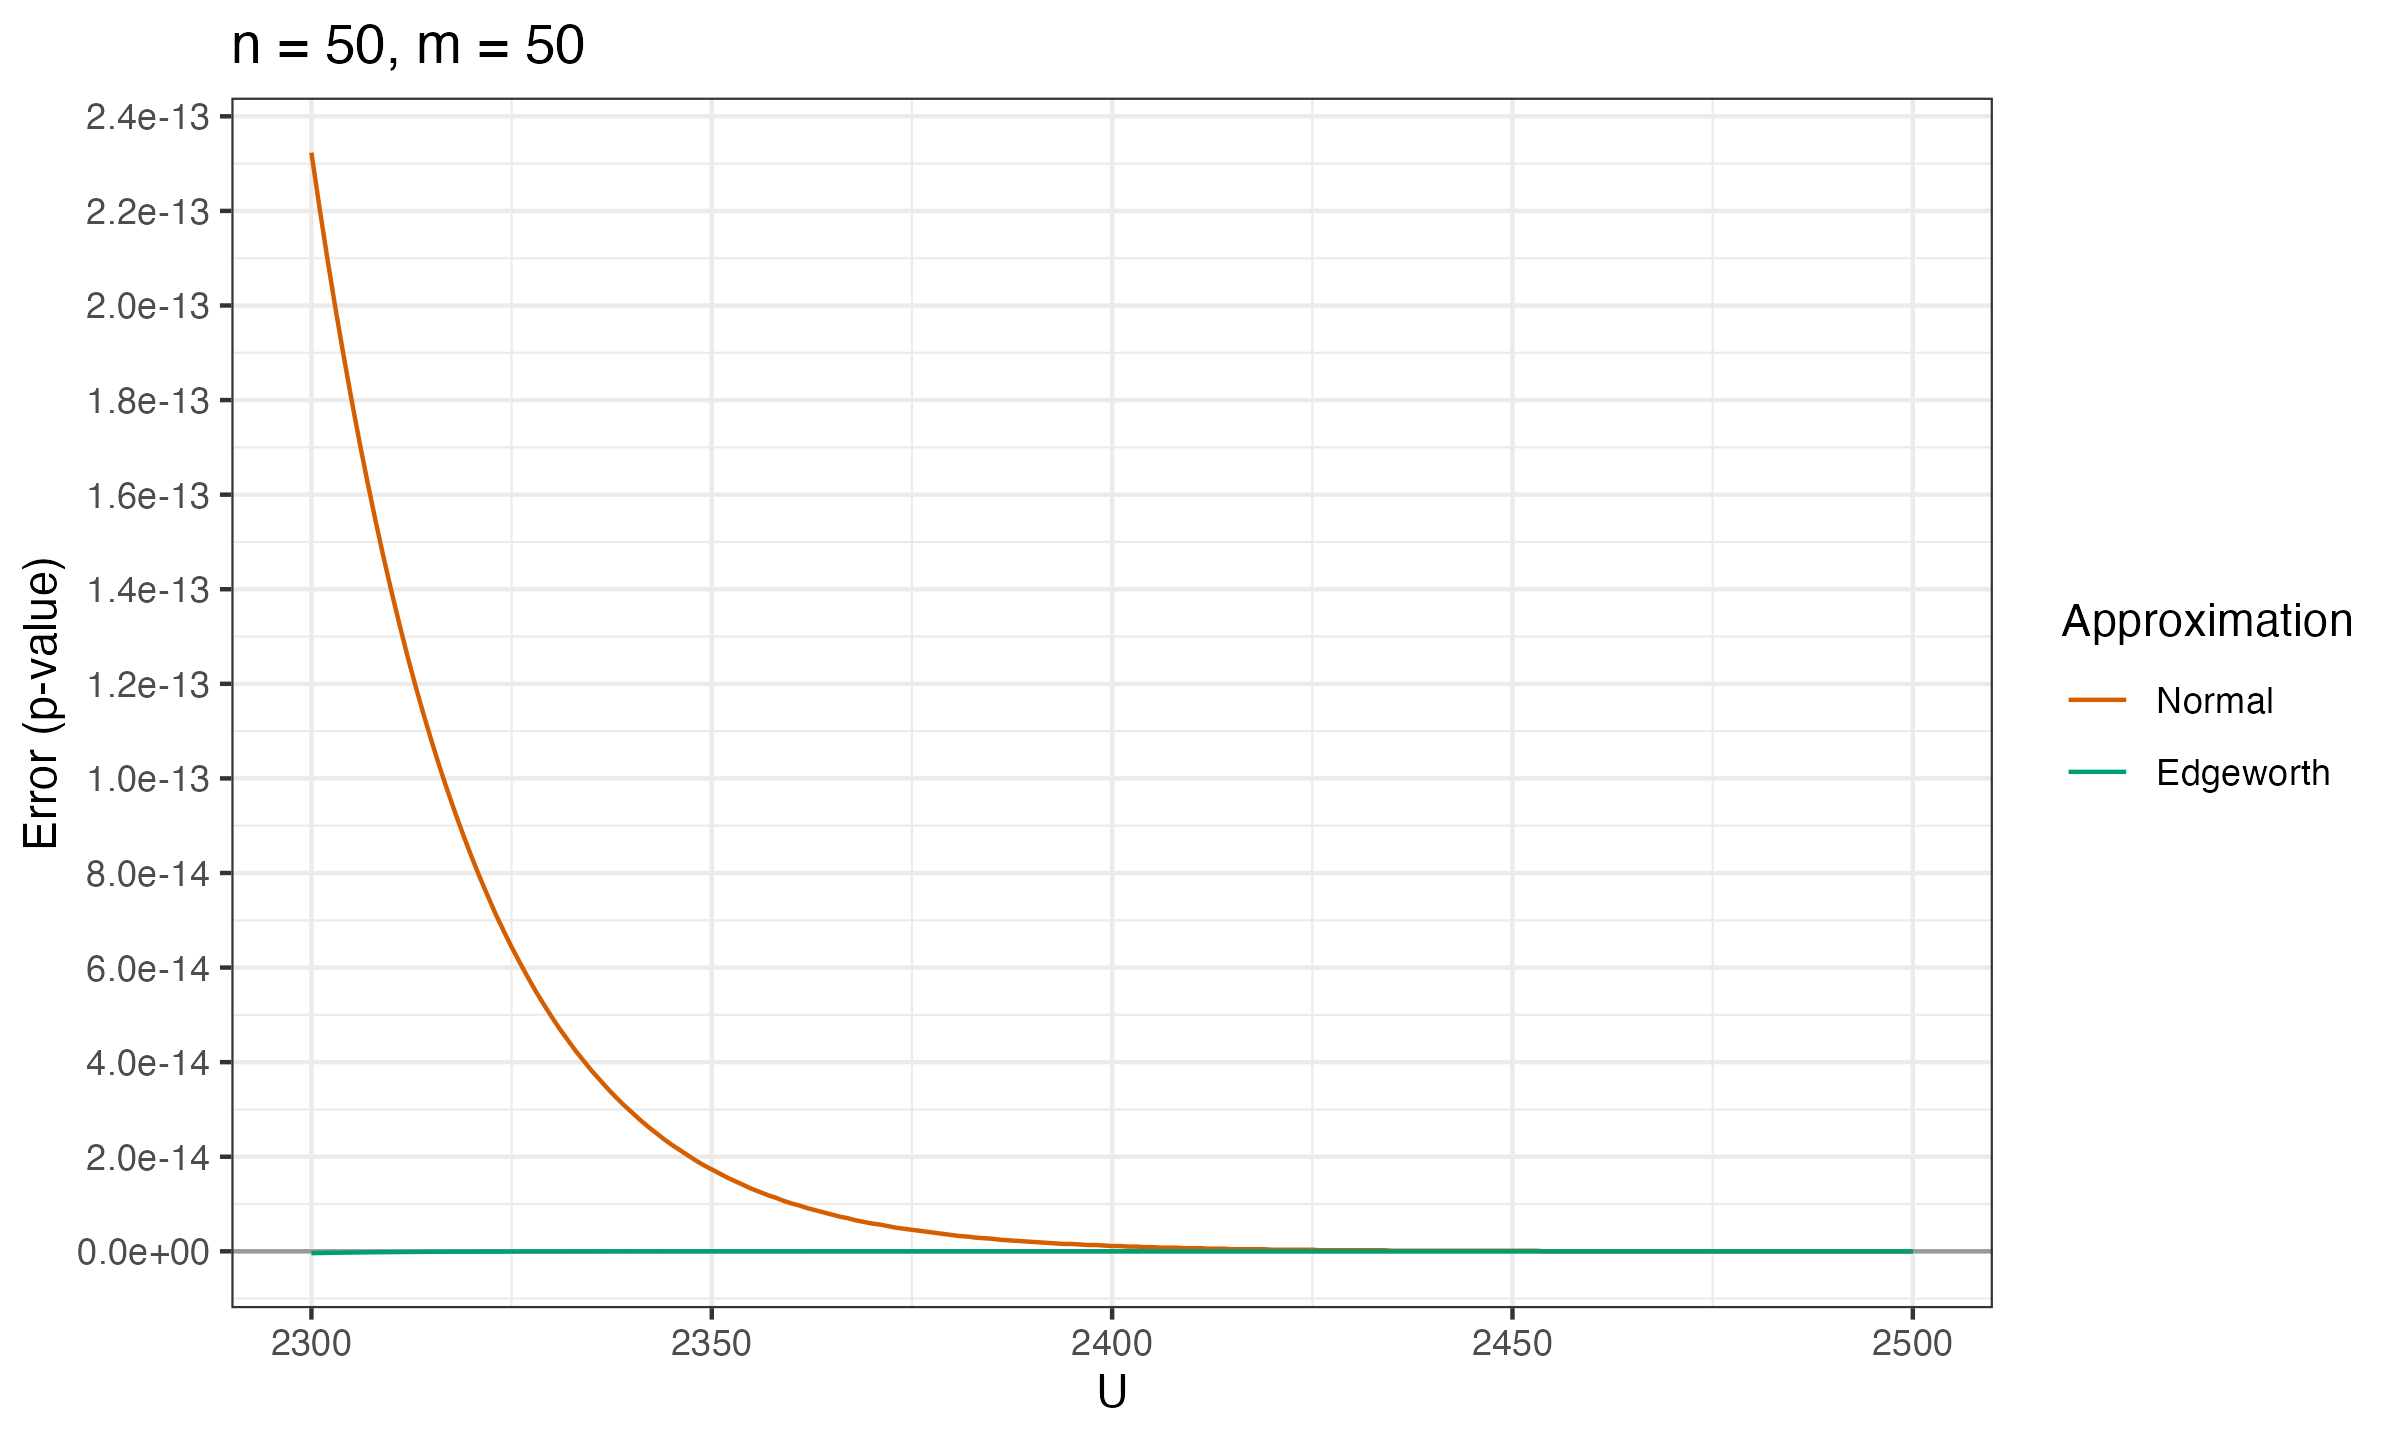
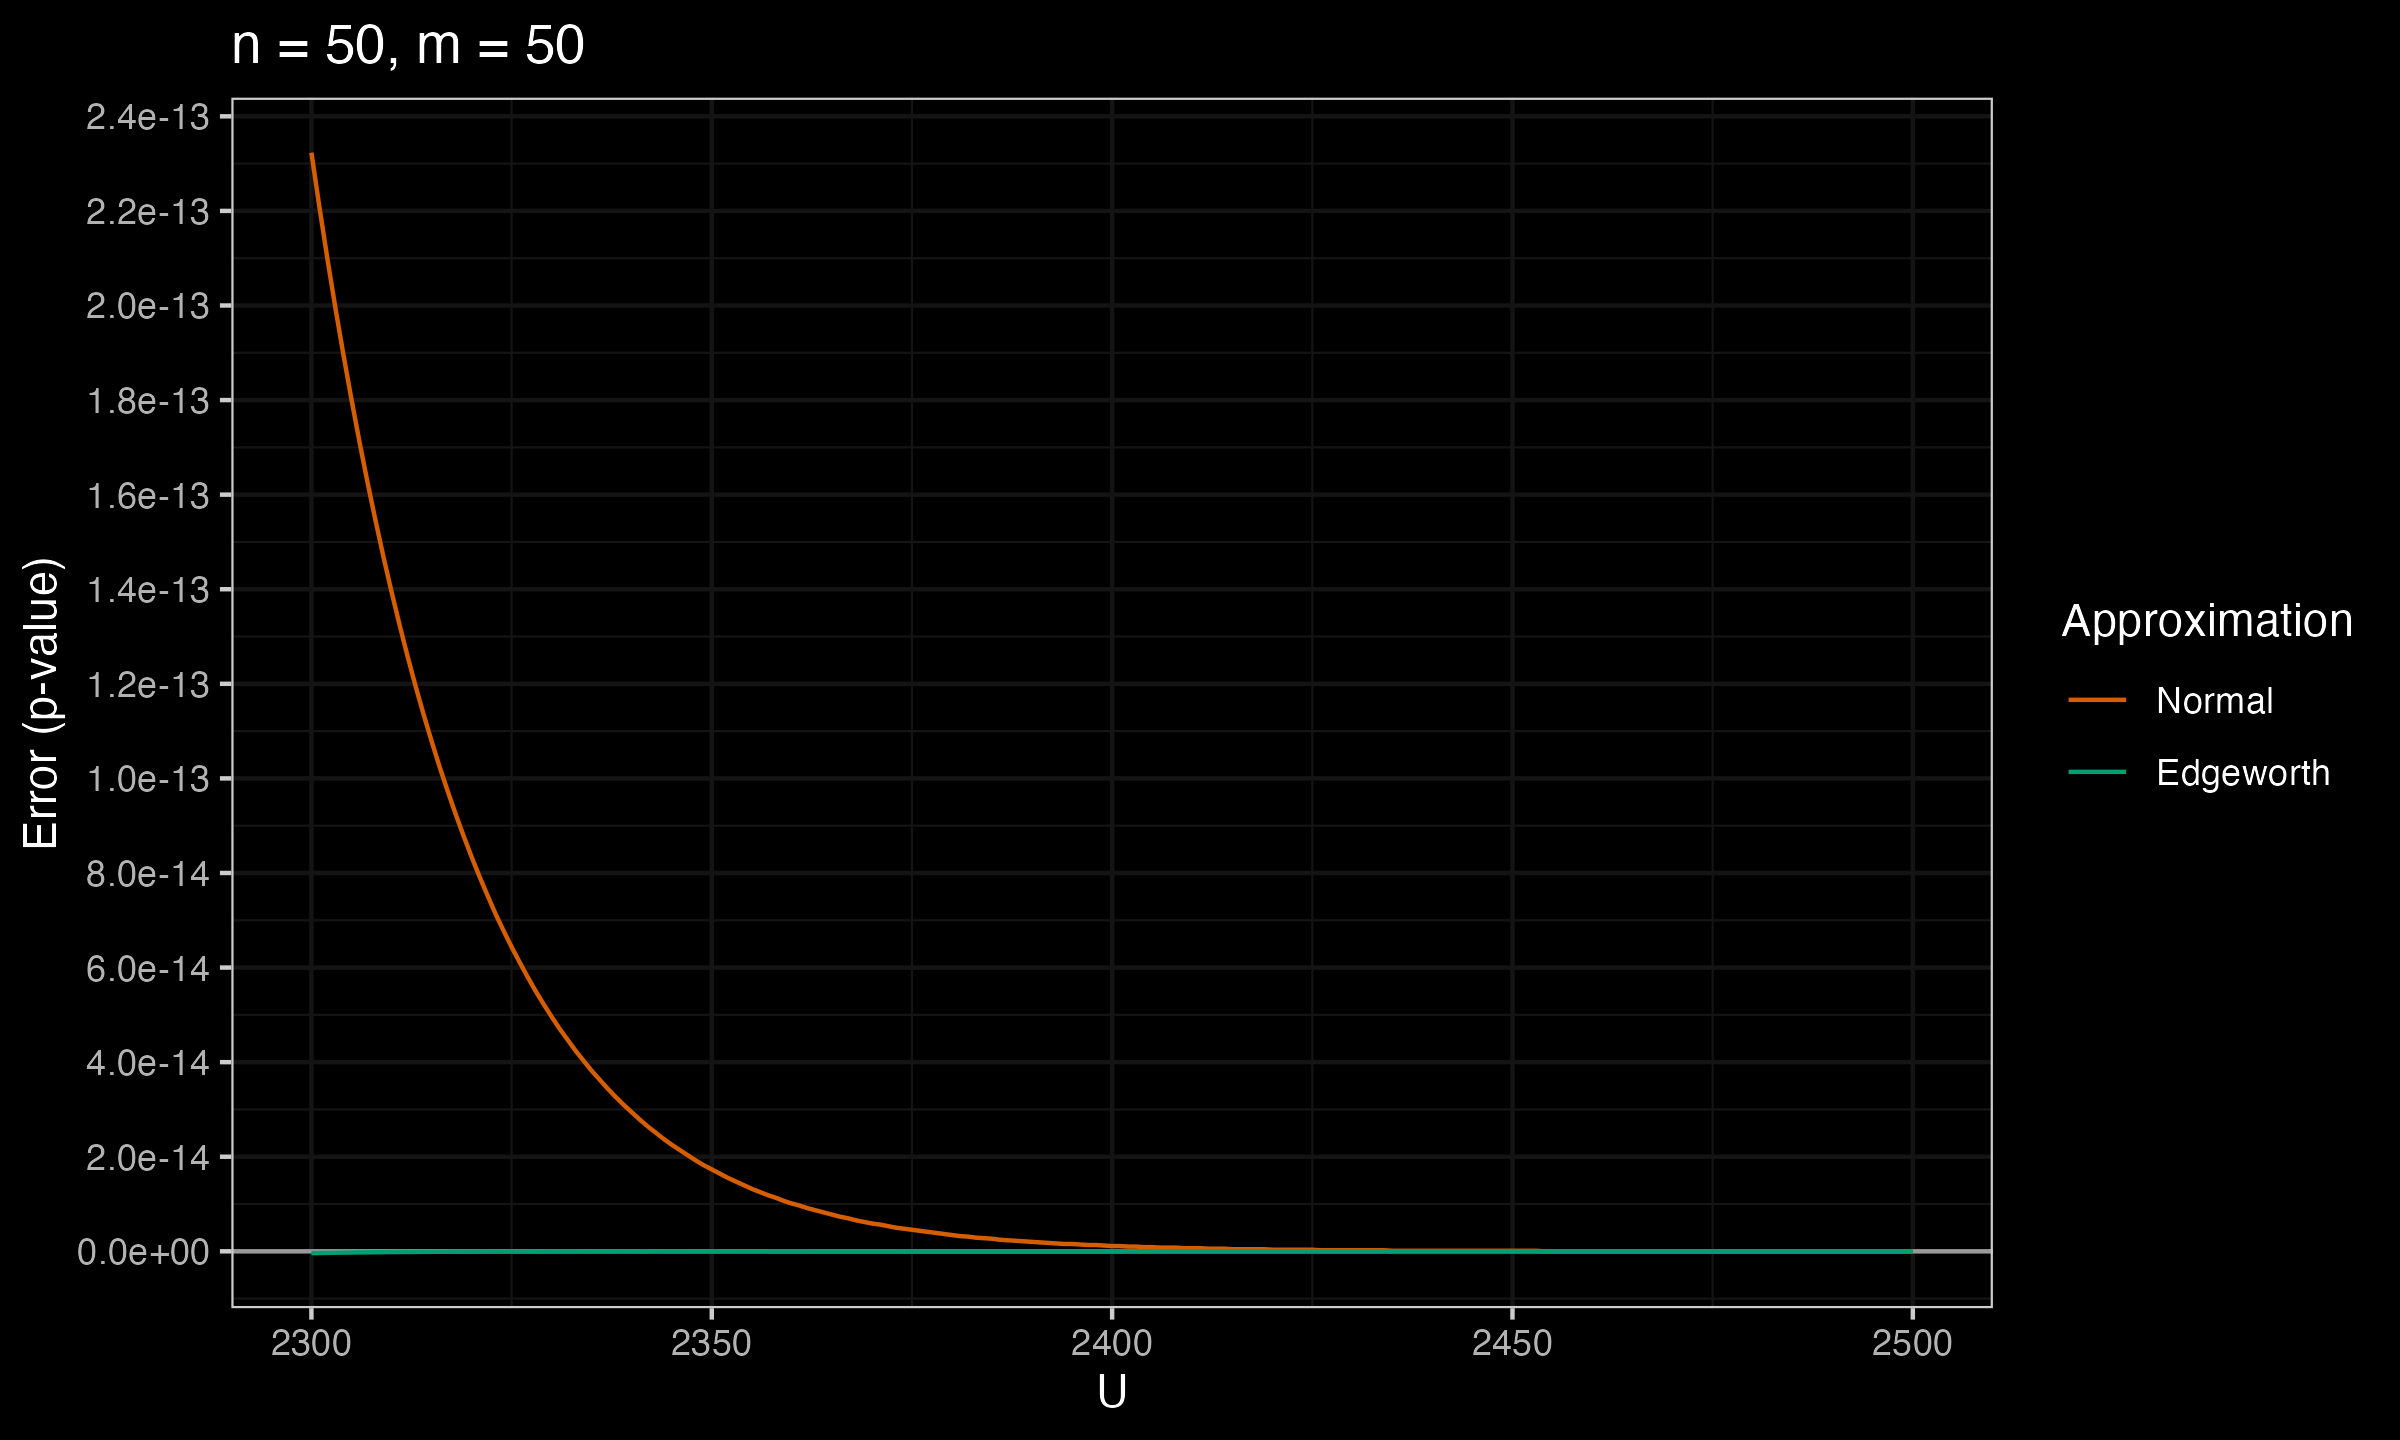
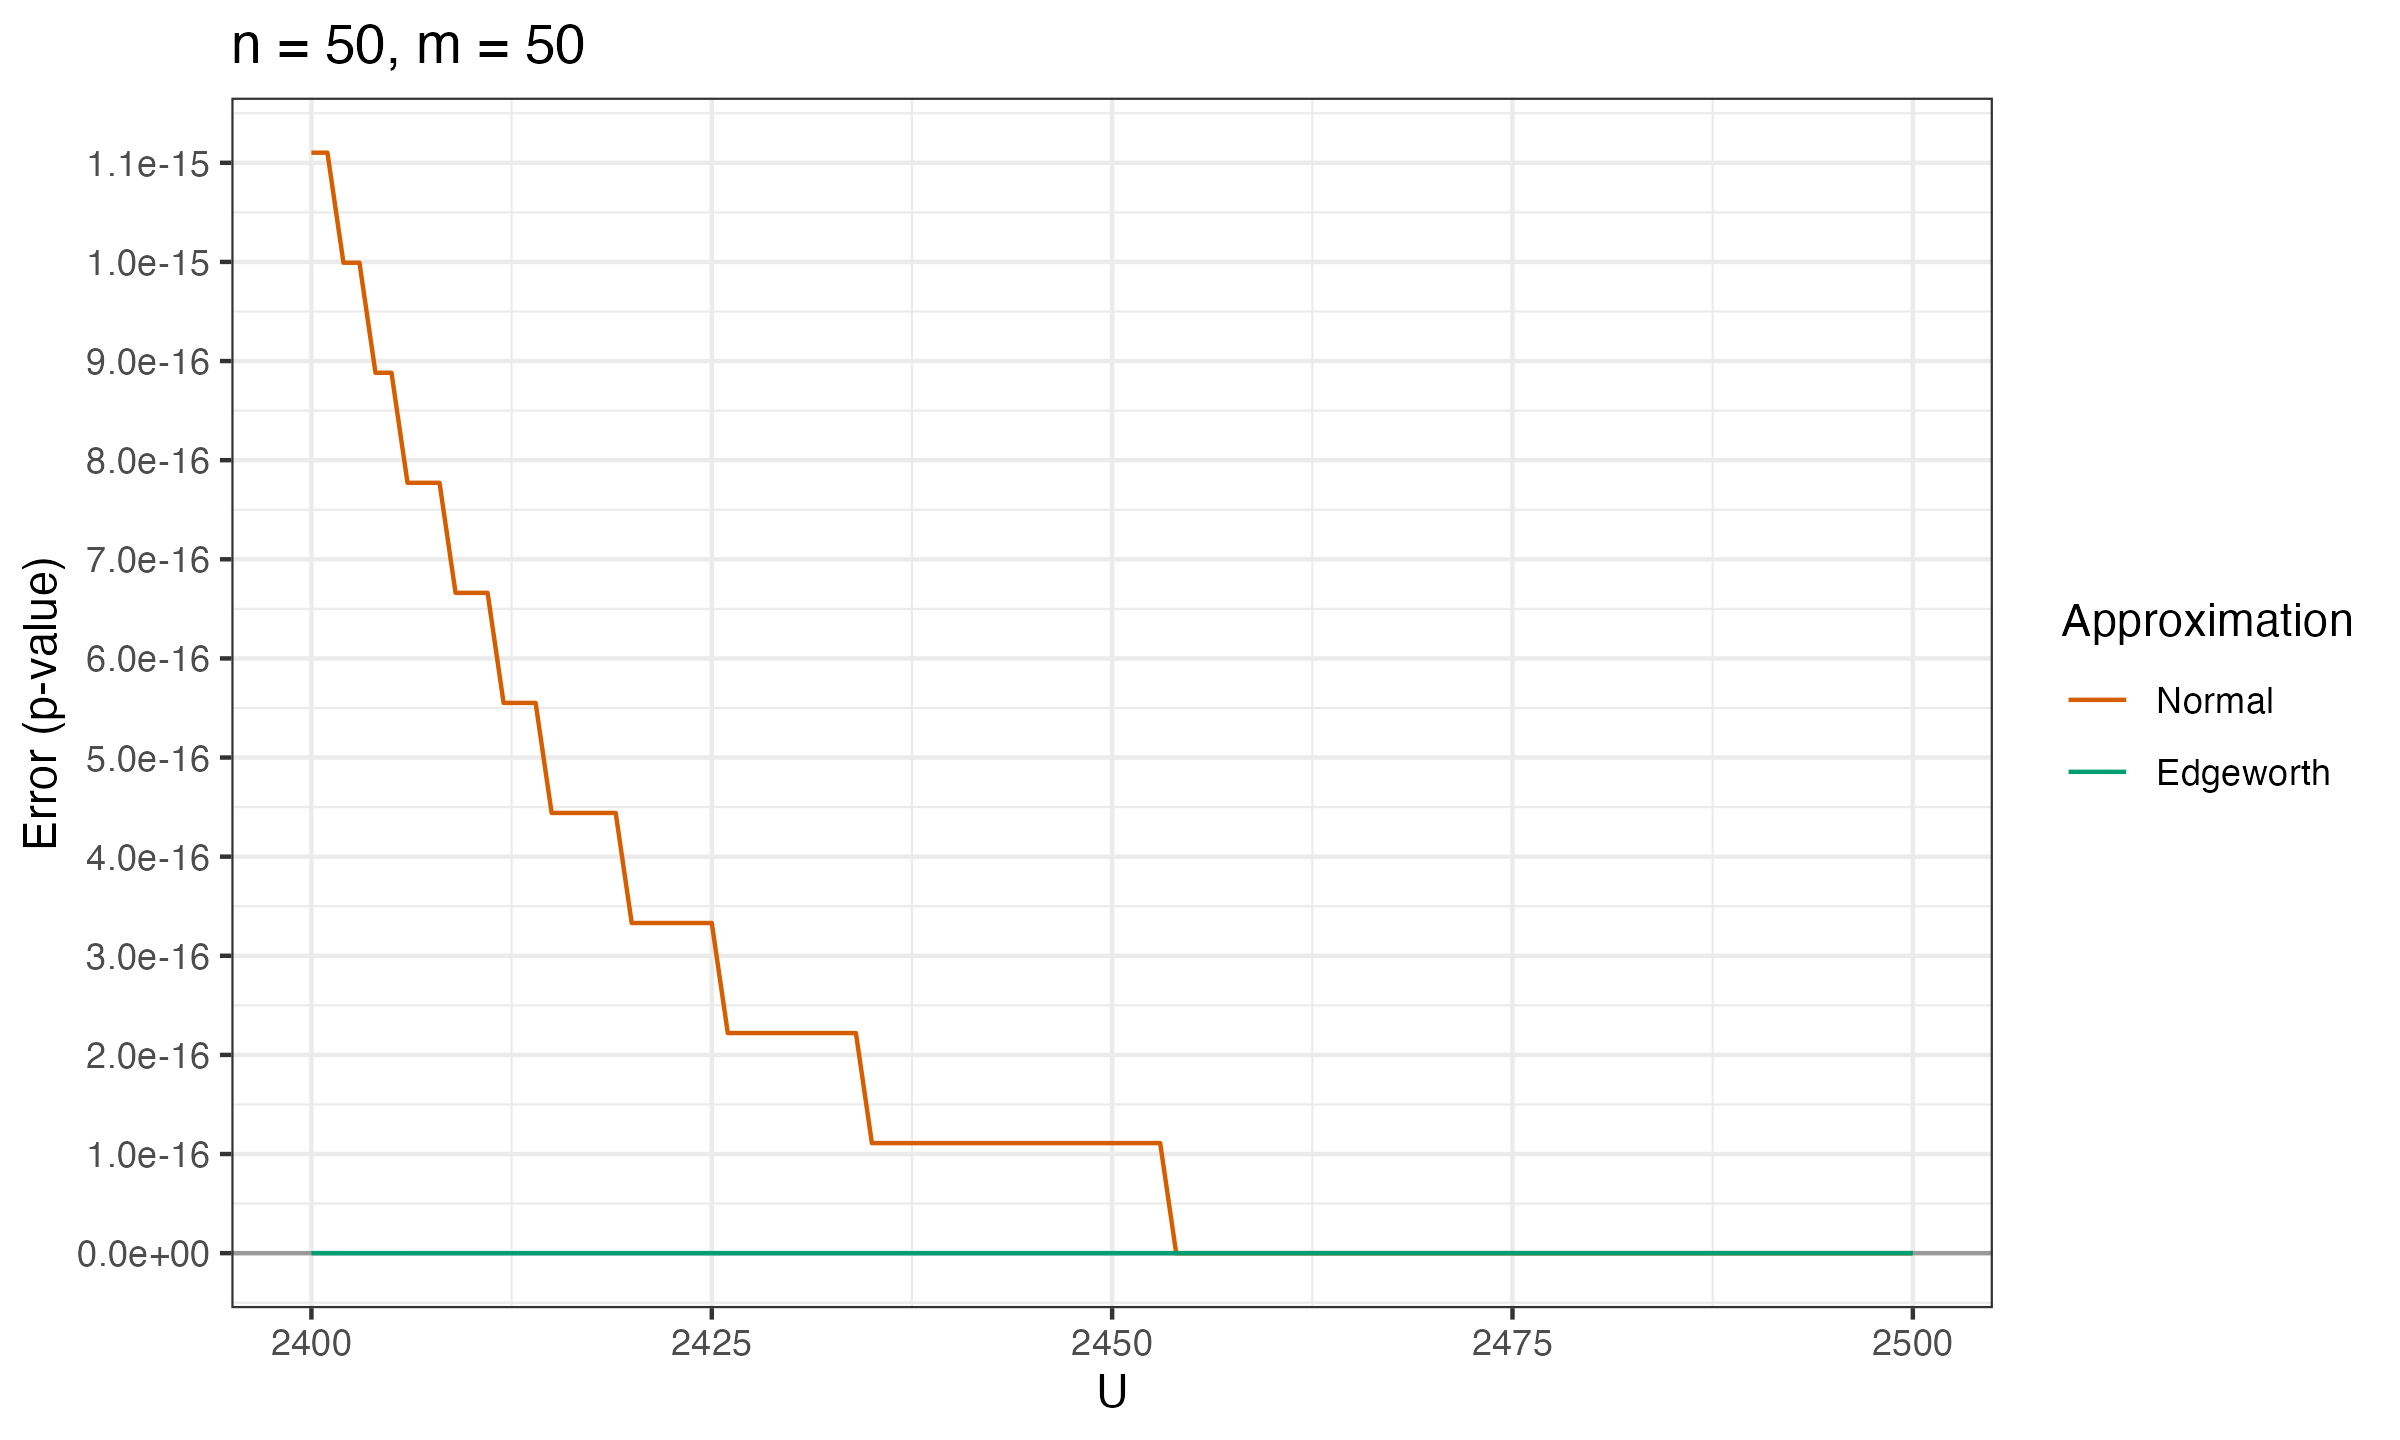
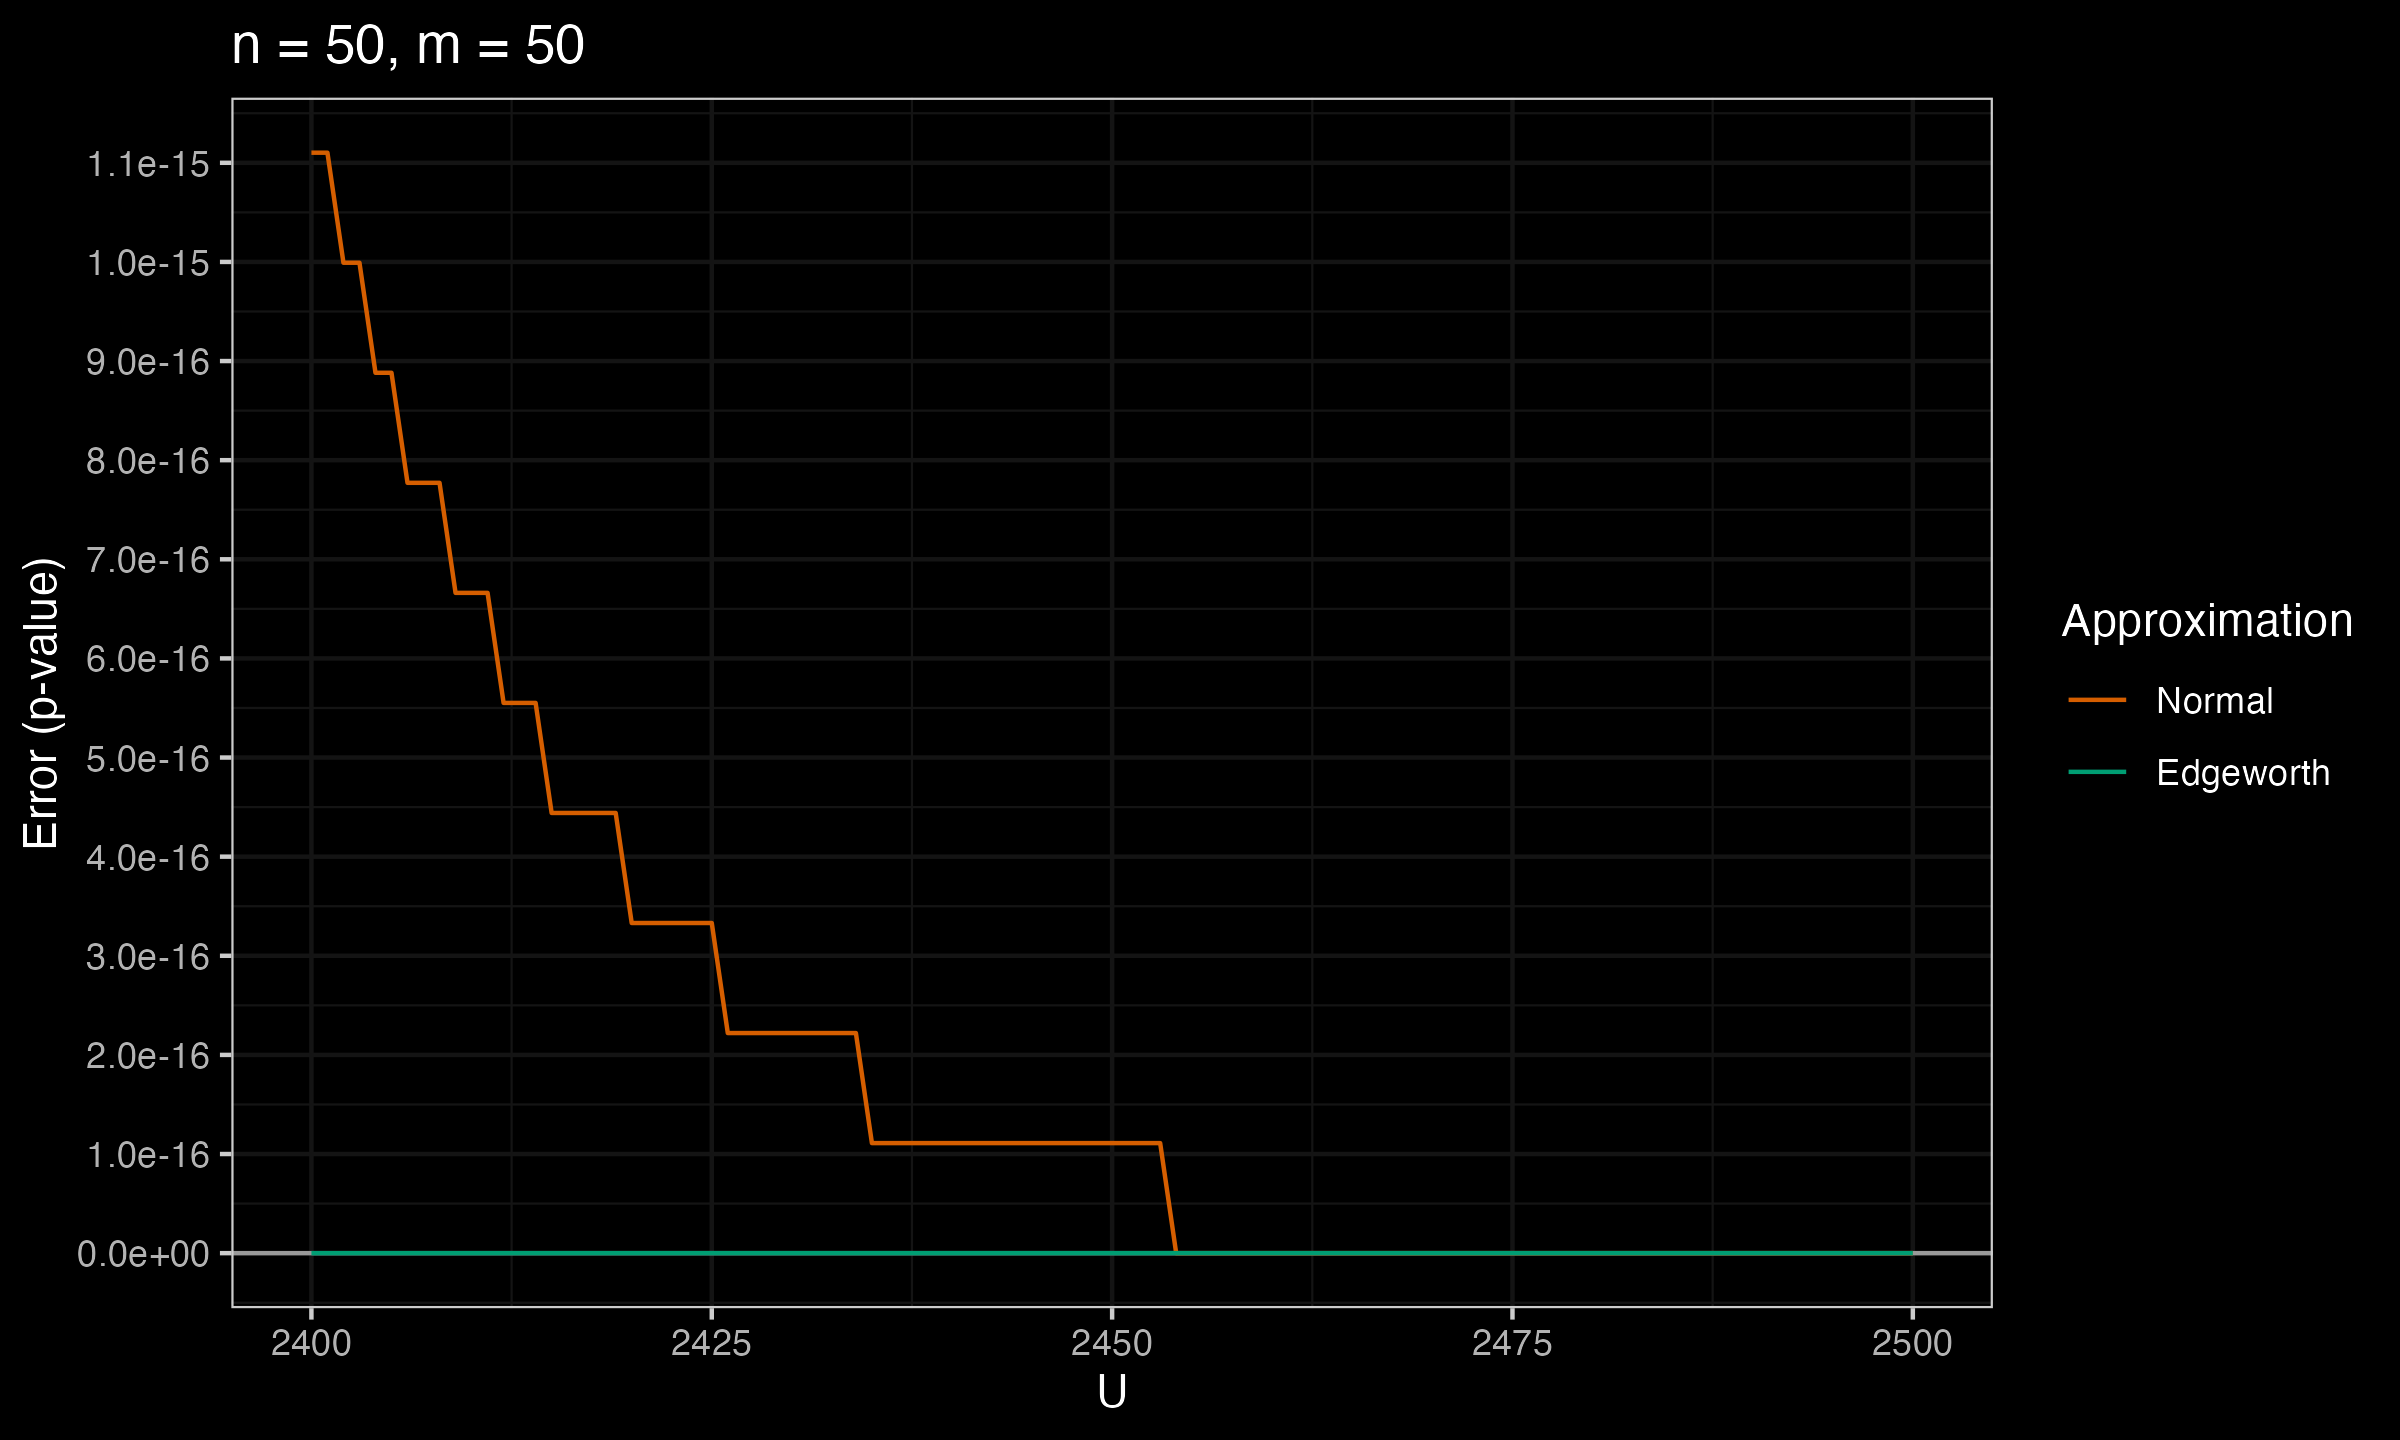
Below you can see the charts that show the error between the true p-value and $p_\mathcal{N}$, $p_E$ (the normal approximation and the Edgeworth approximation) for various values of $n$ and $m$.
As we can see, $p_E$ is much more accurate than $p_\mathcal{N}$.
Conclusion
In statistical hypothesis testing, accuracy is crucial, and the choice of the approximation method can substantially impact the results. While the Normal approximation is simple and widely used, it can lead to significant errors in p-value calculations, particularly for the Mann-Whitney U test.
The Edgeworth expansion, on the other hand, offers a promising alternative that significantly improves the approximation accuracy by accounting for higher moments of the distribution. Thus, it enhances the reliability and validity of the Mann-Whitney U test results.
So, the next time you perform a Mann-Whitney U test, consider using the Edgeworth expansion to approximate your p-values. You might find it to be a much more reliable and precise way to draw conclusions from your data.
