.NET Core performance revolution in Rider 2020.1
This blog post was originally posted on JetBrains .NET blog.
Many Rider users may know that the IDE has two main processes: frontend (Java-application based on the IntelliJ platform) and backend (.NET-application based on ReSharper). Since the first release of Rider, we’ve used Mono as the backend runtime on Linux and macOS. A few years ago, we decided to migrate to .NET Core. After resolving hundreds of technical challenges, we are finally ready to present the .NET Core edition of Rider!
In this blog post, we want to share the results of some benchmarks that compare the Mono-powered and the .NET Core-powered editions of Rider. You may find this interesting if you are also thinking about migrating to .NET Core, or if you just want a high-level overview of the improvements to Rider in terms of performance and footprint, following the migration. (Spoiler: they’re huge!)
Setup of our Performance Lab
Before we start to measure, we need to prepare. It's not easy to benchmark such a huge project, and we have dozens of different approaches for measuring performance. Since Rider is a desktop application, some approaches require physical access to the machine.For example, some issues are monitor specific (like rendering lag on 4K-displays), while some others are laptop specific. Sometimes, performance can be affected by thermal throttling, which is hard to control without physical access. That’s why we built a small performance laboratory with different kinds of hardware. Currently, our employees are working remotely, so the laboratory has temporarily been moved from the office to a home environment:
I finally finished setupping my home performance laboratory. It's time to run some benchmarks! pic.twitter.com/o2C62STxwG
— Andrey Akinshin (@andrey_akinshin) April 9, 2020
For this blog post, we captured some manual performance measurements on the following hardware from the above picture:
- Mac mini, Intel Core i7-3615QM 2.30GHz. We have three such devices with different operating systems:
- Windows 10 (build 15063.1418)
- Ubuntu 18.04
- macOS 10.15
- MacBook (Mid 2015, Intel Core i7-4870HQ 2.5GHz) with macOS 10.15.4
- Linux Desktop (Intel Core i7-6700 3.40GHz) with Deepin 15.11
In this blog post, we will work with our three favorite benchmarks, which open an empty project, the Orchard solution (54 projects), and the nopCommerce solution (40 projects). And with respect to the runtime versions, we use Mono 6.8.0 and .NET Core 3.1.3.
Since we use complex integration benchmarks, we can’t use BenchmarkDotNet, JMH, or other benchmarking libraries for measurements. Instead we use our own benchmark harness, and we use perfolizer to analyze the performance data. The density plots in this post are drawn in R using the ggplot2 package and the Sheather & Jones bandwidth selector.
OK, now we are ready to benchmark!
Performance Measuring & Improvements
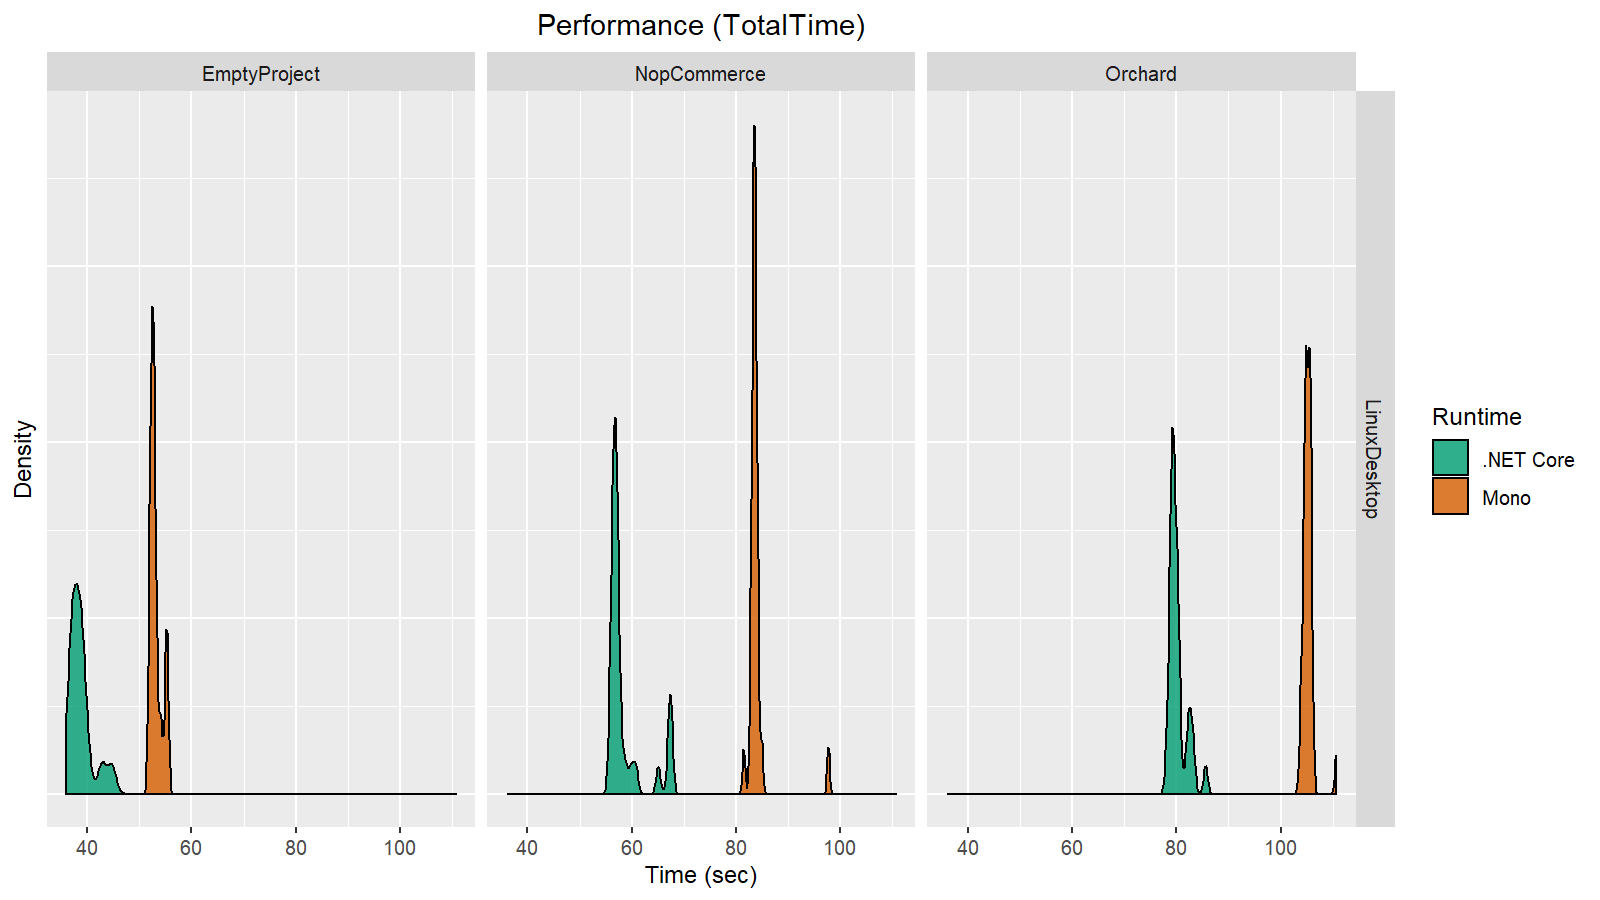
We start with the test that opens a solution. Let's check the total time of this test on the Linux desktop:Note that these results don’t mean that Rider takes 40-60 seconds to open a solution. These performance tests are synthetic, which means they include many waits and internal checks. The total duration of the test correlates with the actual time it takes for the solution to open, but it’s much longer. We use such tests to track the relative changes in performance between revisions. At the same time, it’s also useful to compare different runtimes.
As you can see, the total opening time improved 20-30% after switching from Mono to .NET Core. That’s an impressive result given that we haven’t changed a single line in the source code!
Our benchmark harness is capable of measuring not only the total test time, but also individual metrics. Here is a plot that illustrates the difference in performance for a job that is responsible for adding solution assemblies to the internal Rider cache:
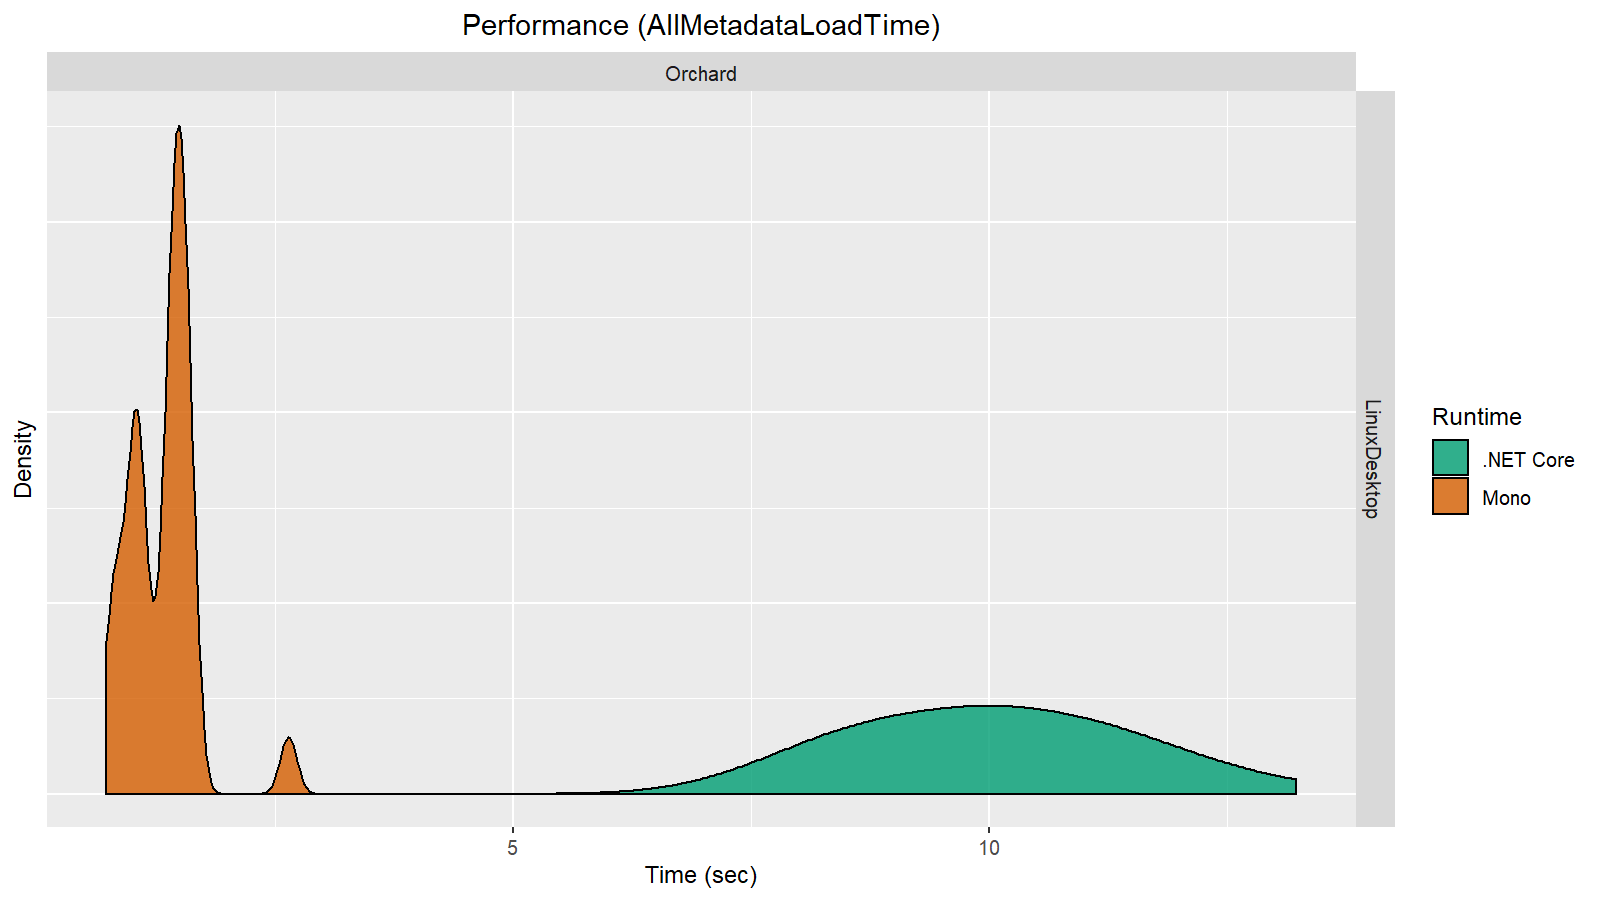
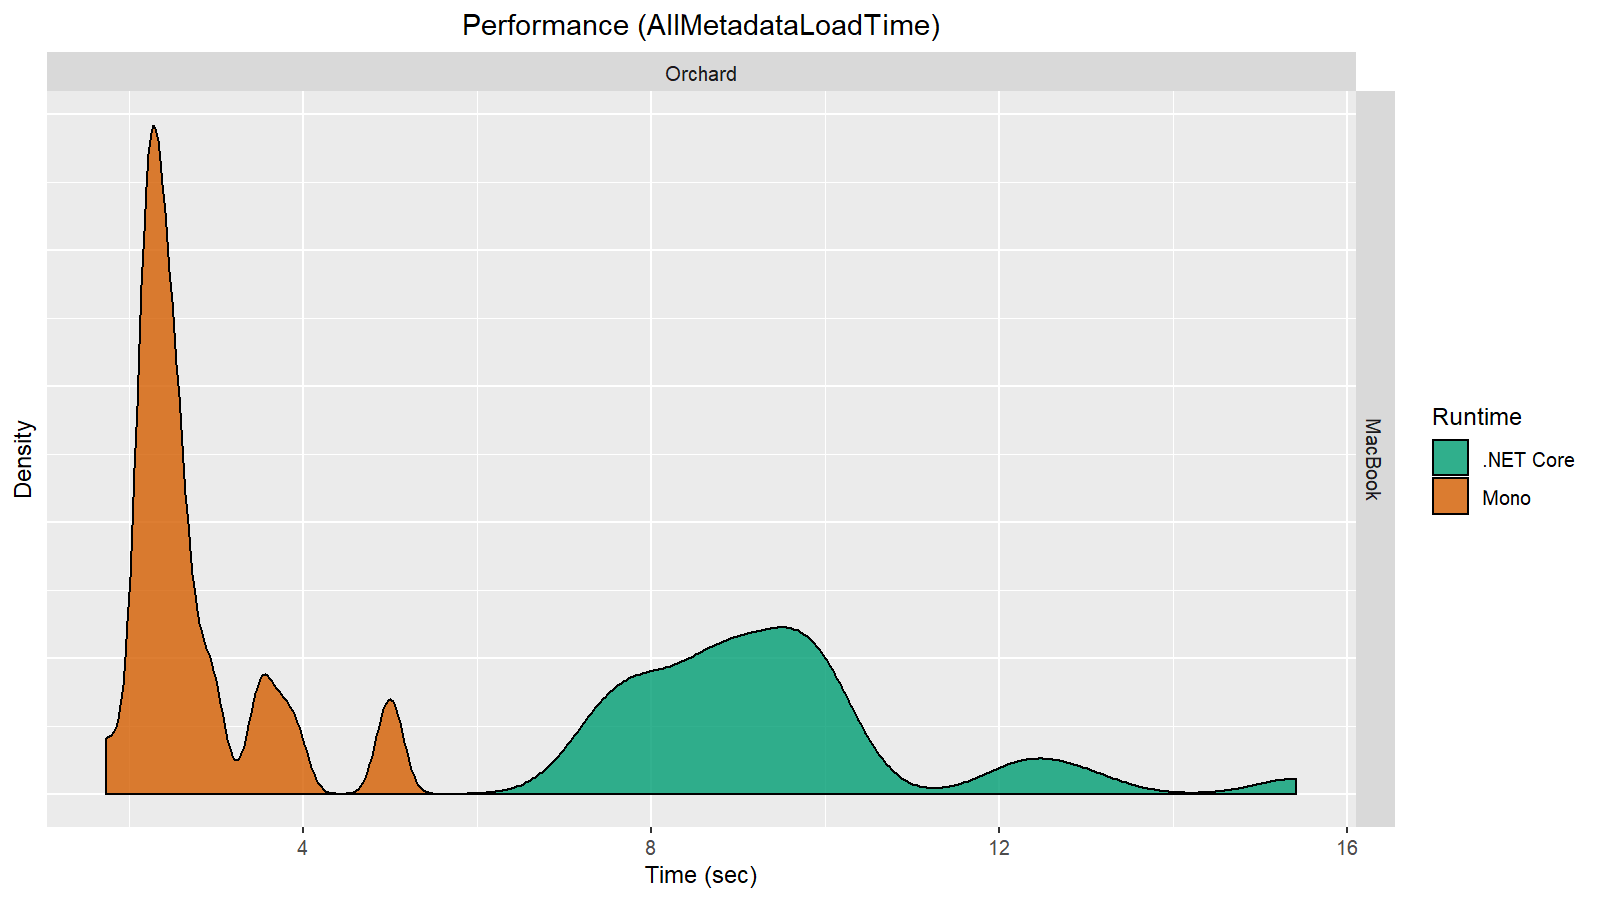
Here we see a 40-60% improvement! However, not all the metric plots look like this. Let’s look at another metric that corresponds to the time it takes to load assembly metadata from the disk:
Here we can see that this metric has significantly degraded. We didn’t have enough time for a detailed investigation, but we are definitely going to figure out why we got this result. The most important result for us right now is the improvement of the overall performance level, even though some sub metrics have degraded.
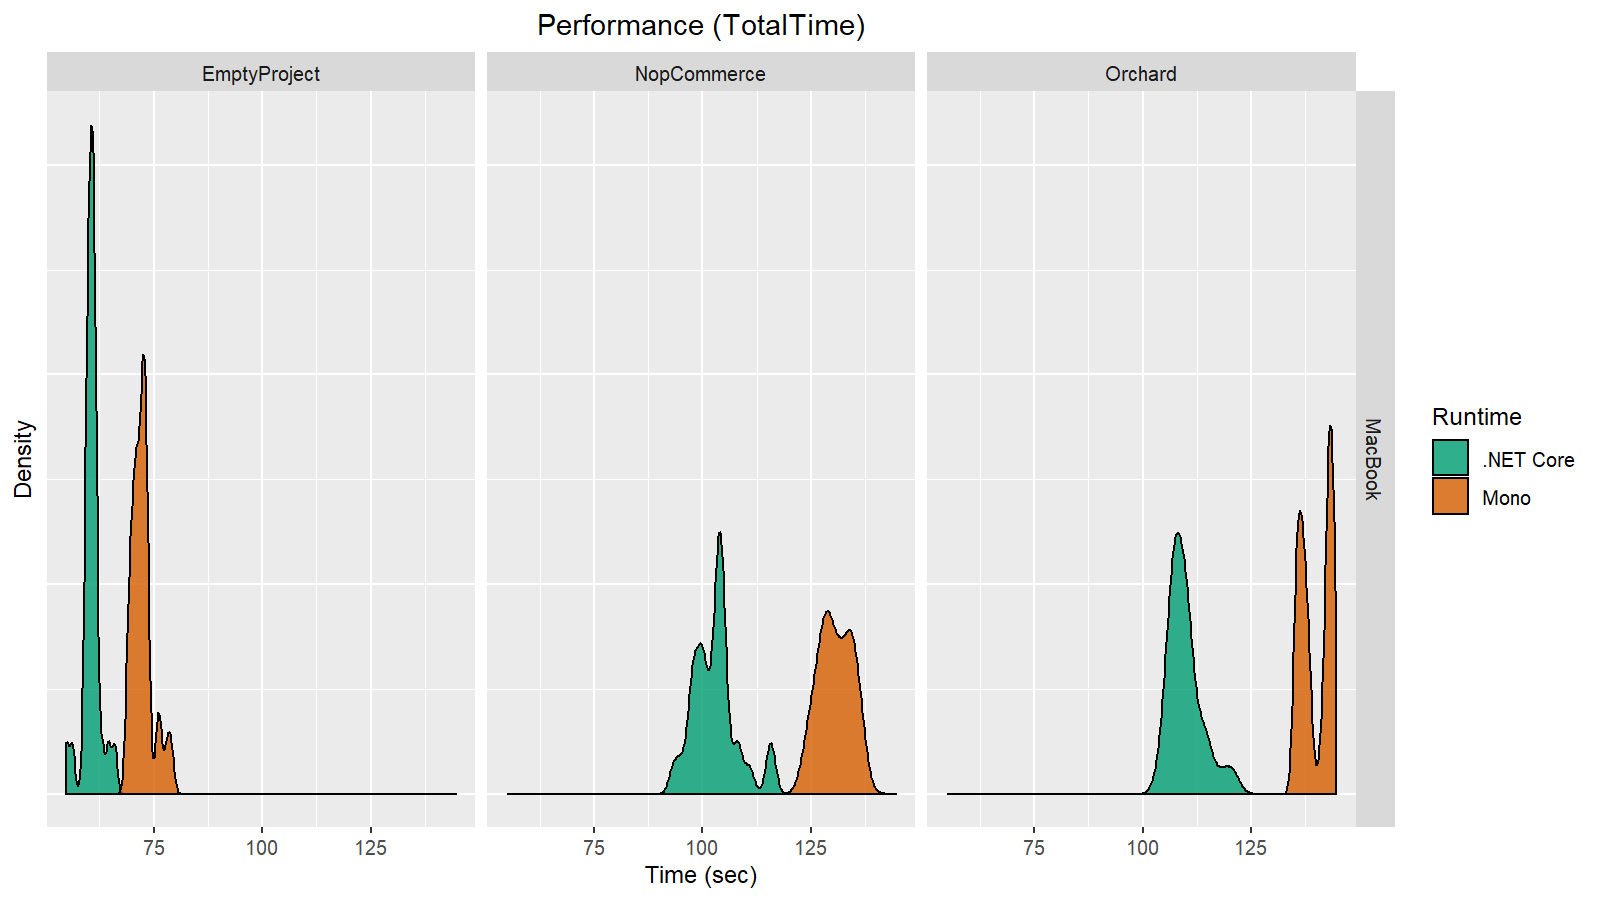
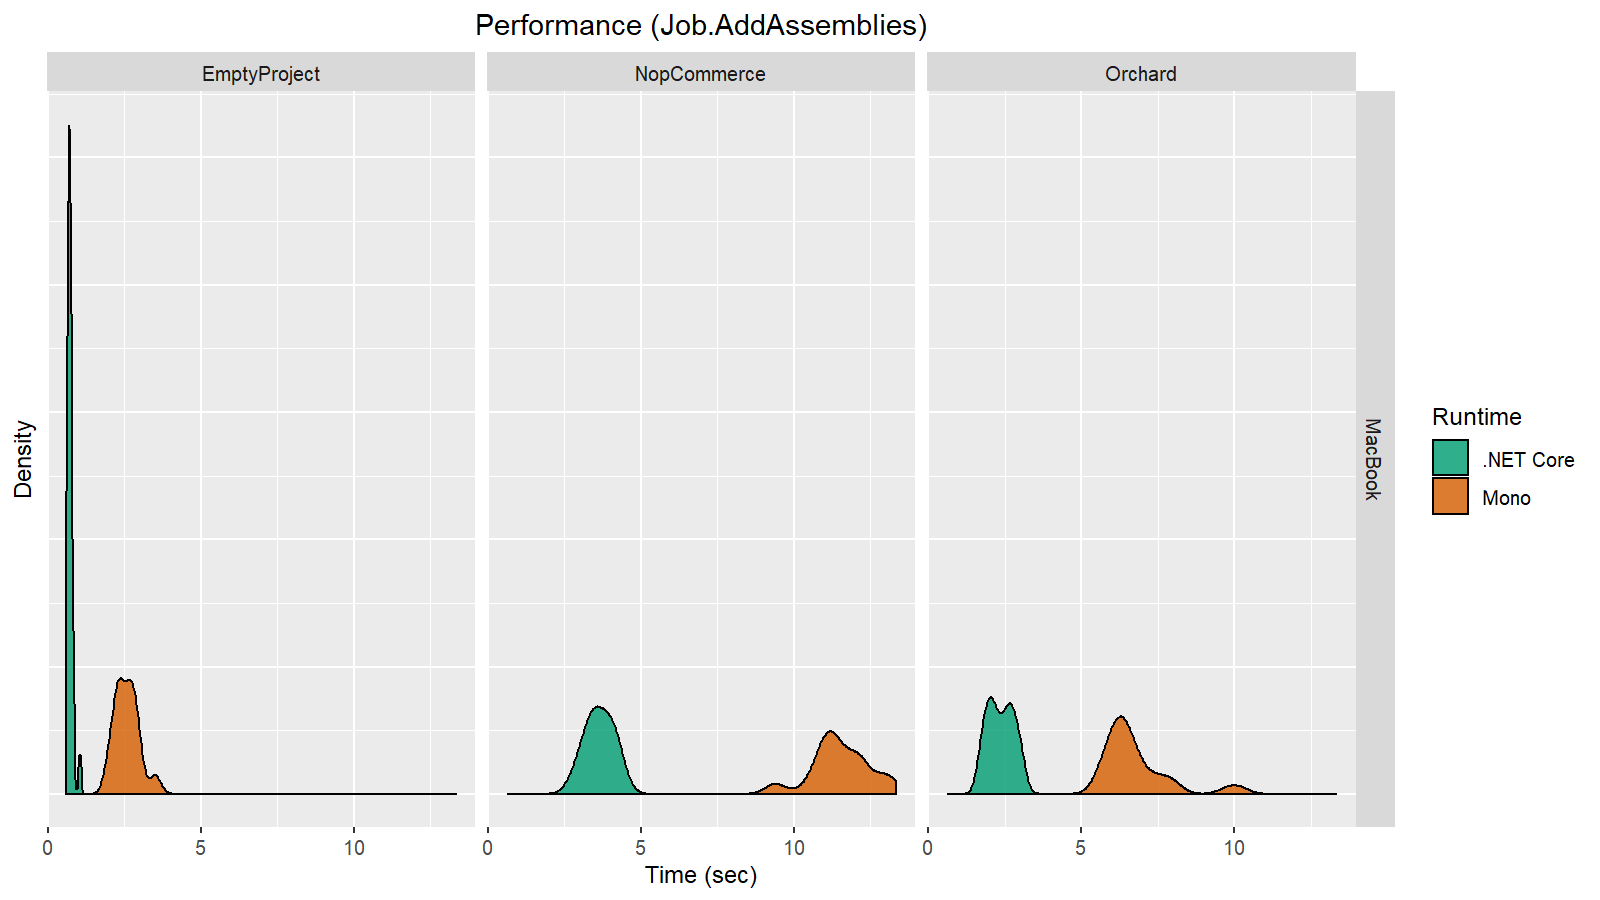
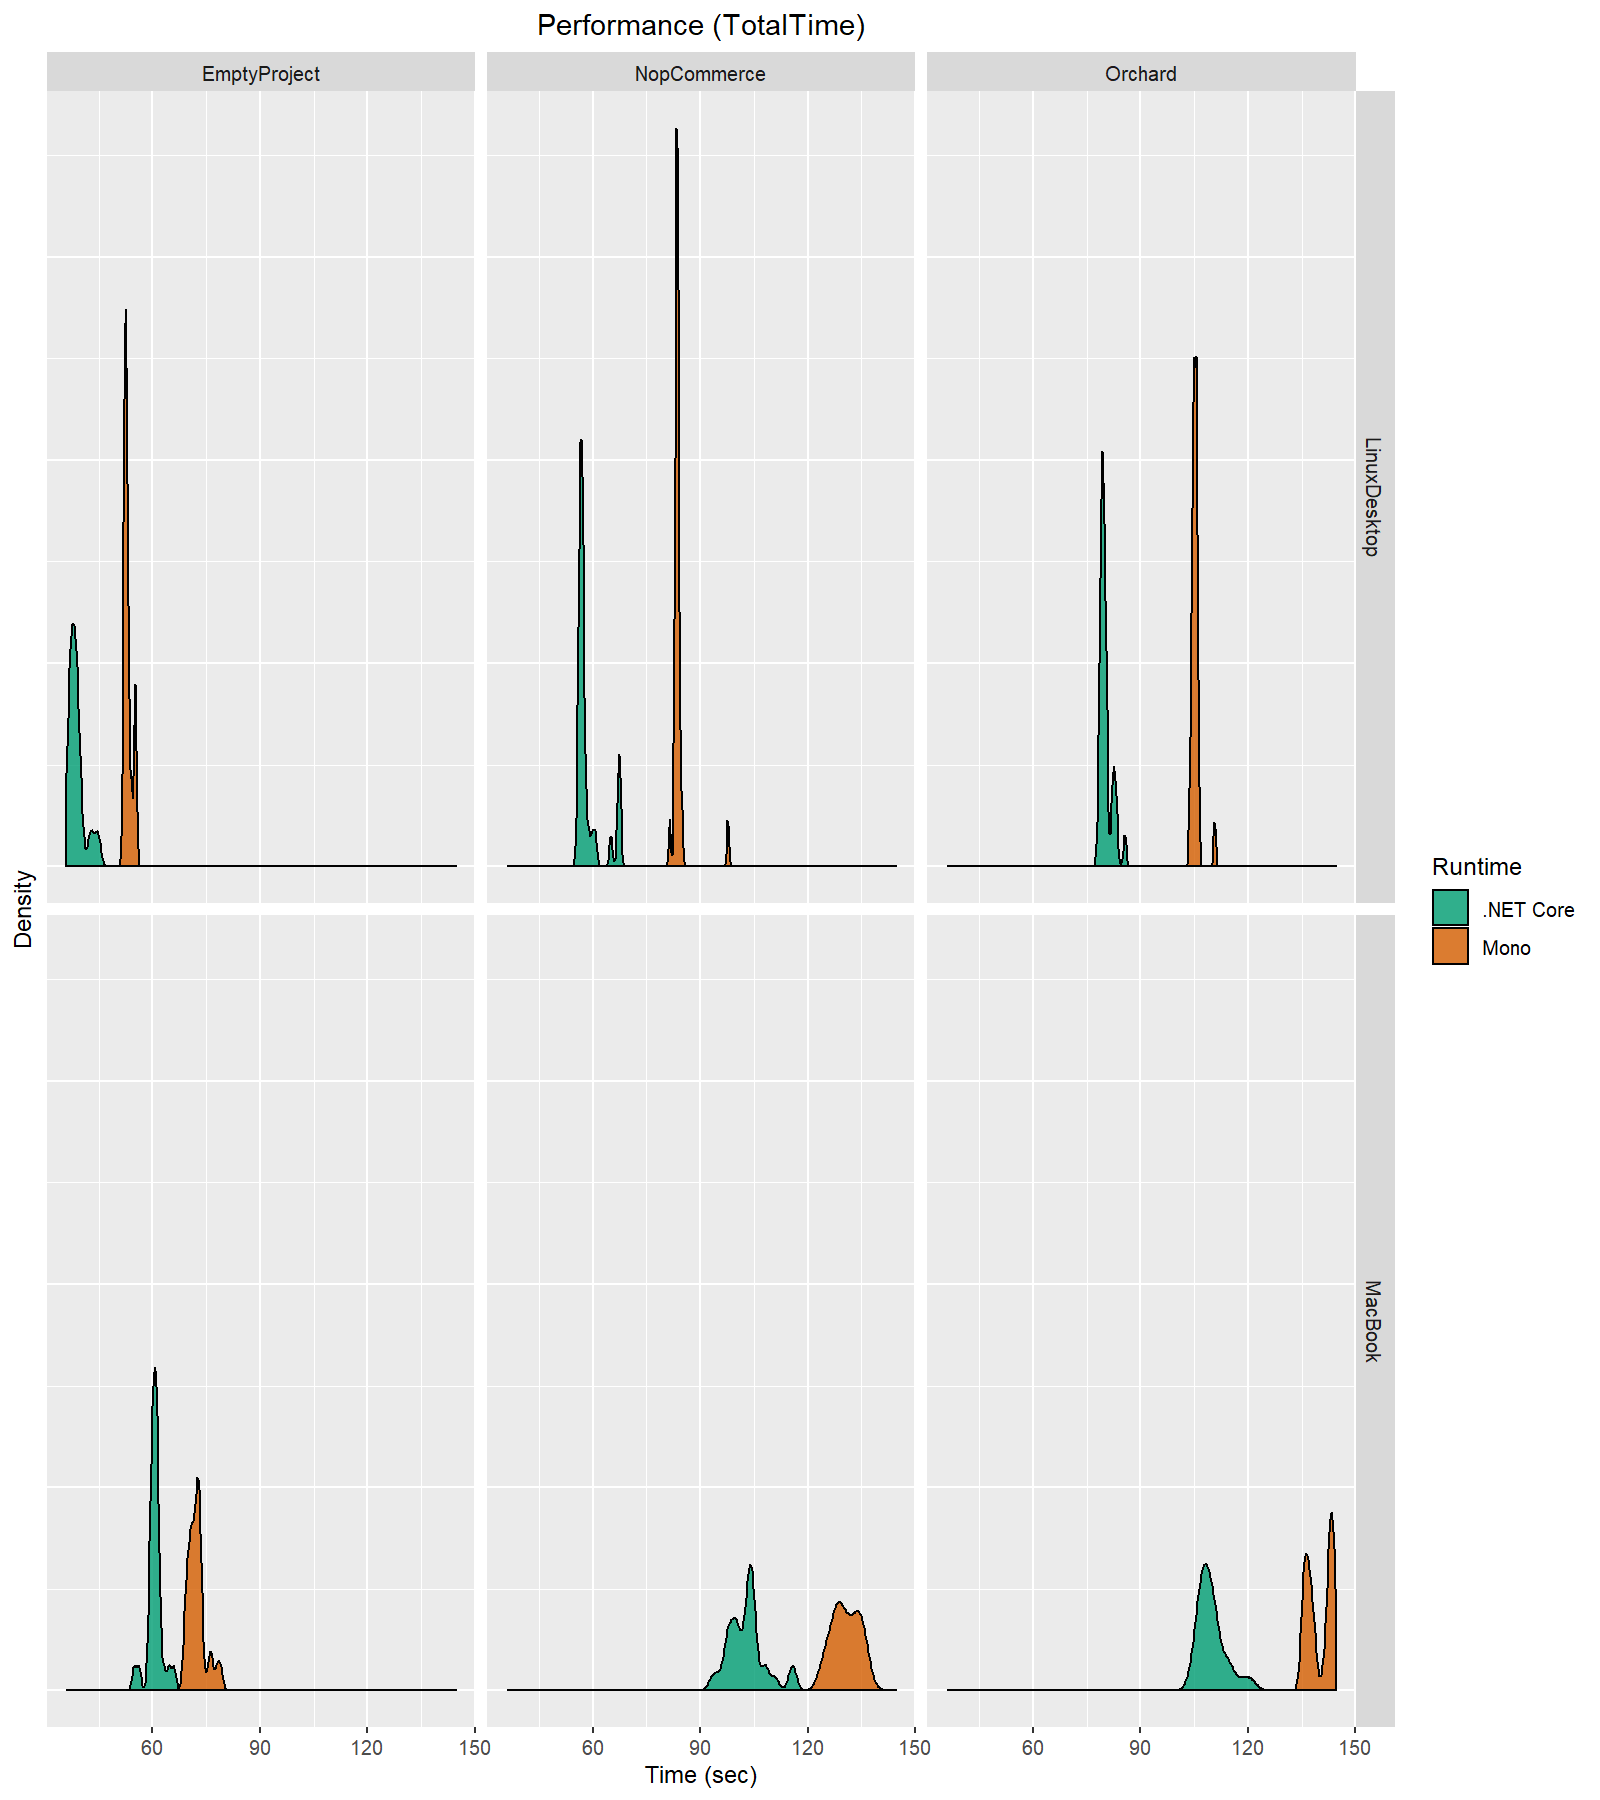
Now let’s check out the same metrics on the MacBook:
In general, the MacBook results look pretty much the same as the Linux results. However, if we look closely at the charts, we can see that the Linux results are actually better:
Does this mean that .NET Core on Linux works faster than the same .NET Core on macOS? Of course not! The conditions of the experiment were inconsistent. The hardware of the Linux machine is more powerful than that of the MacBook.
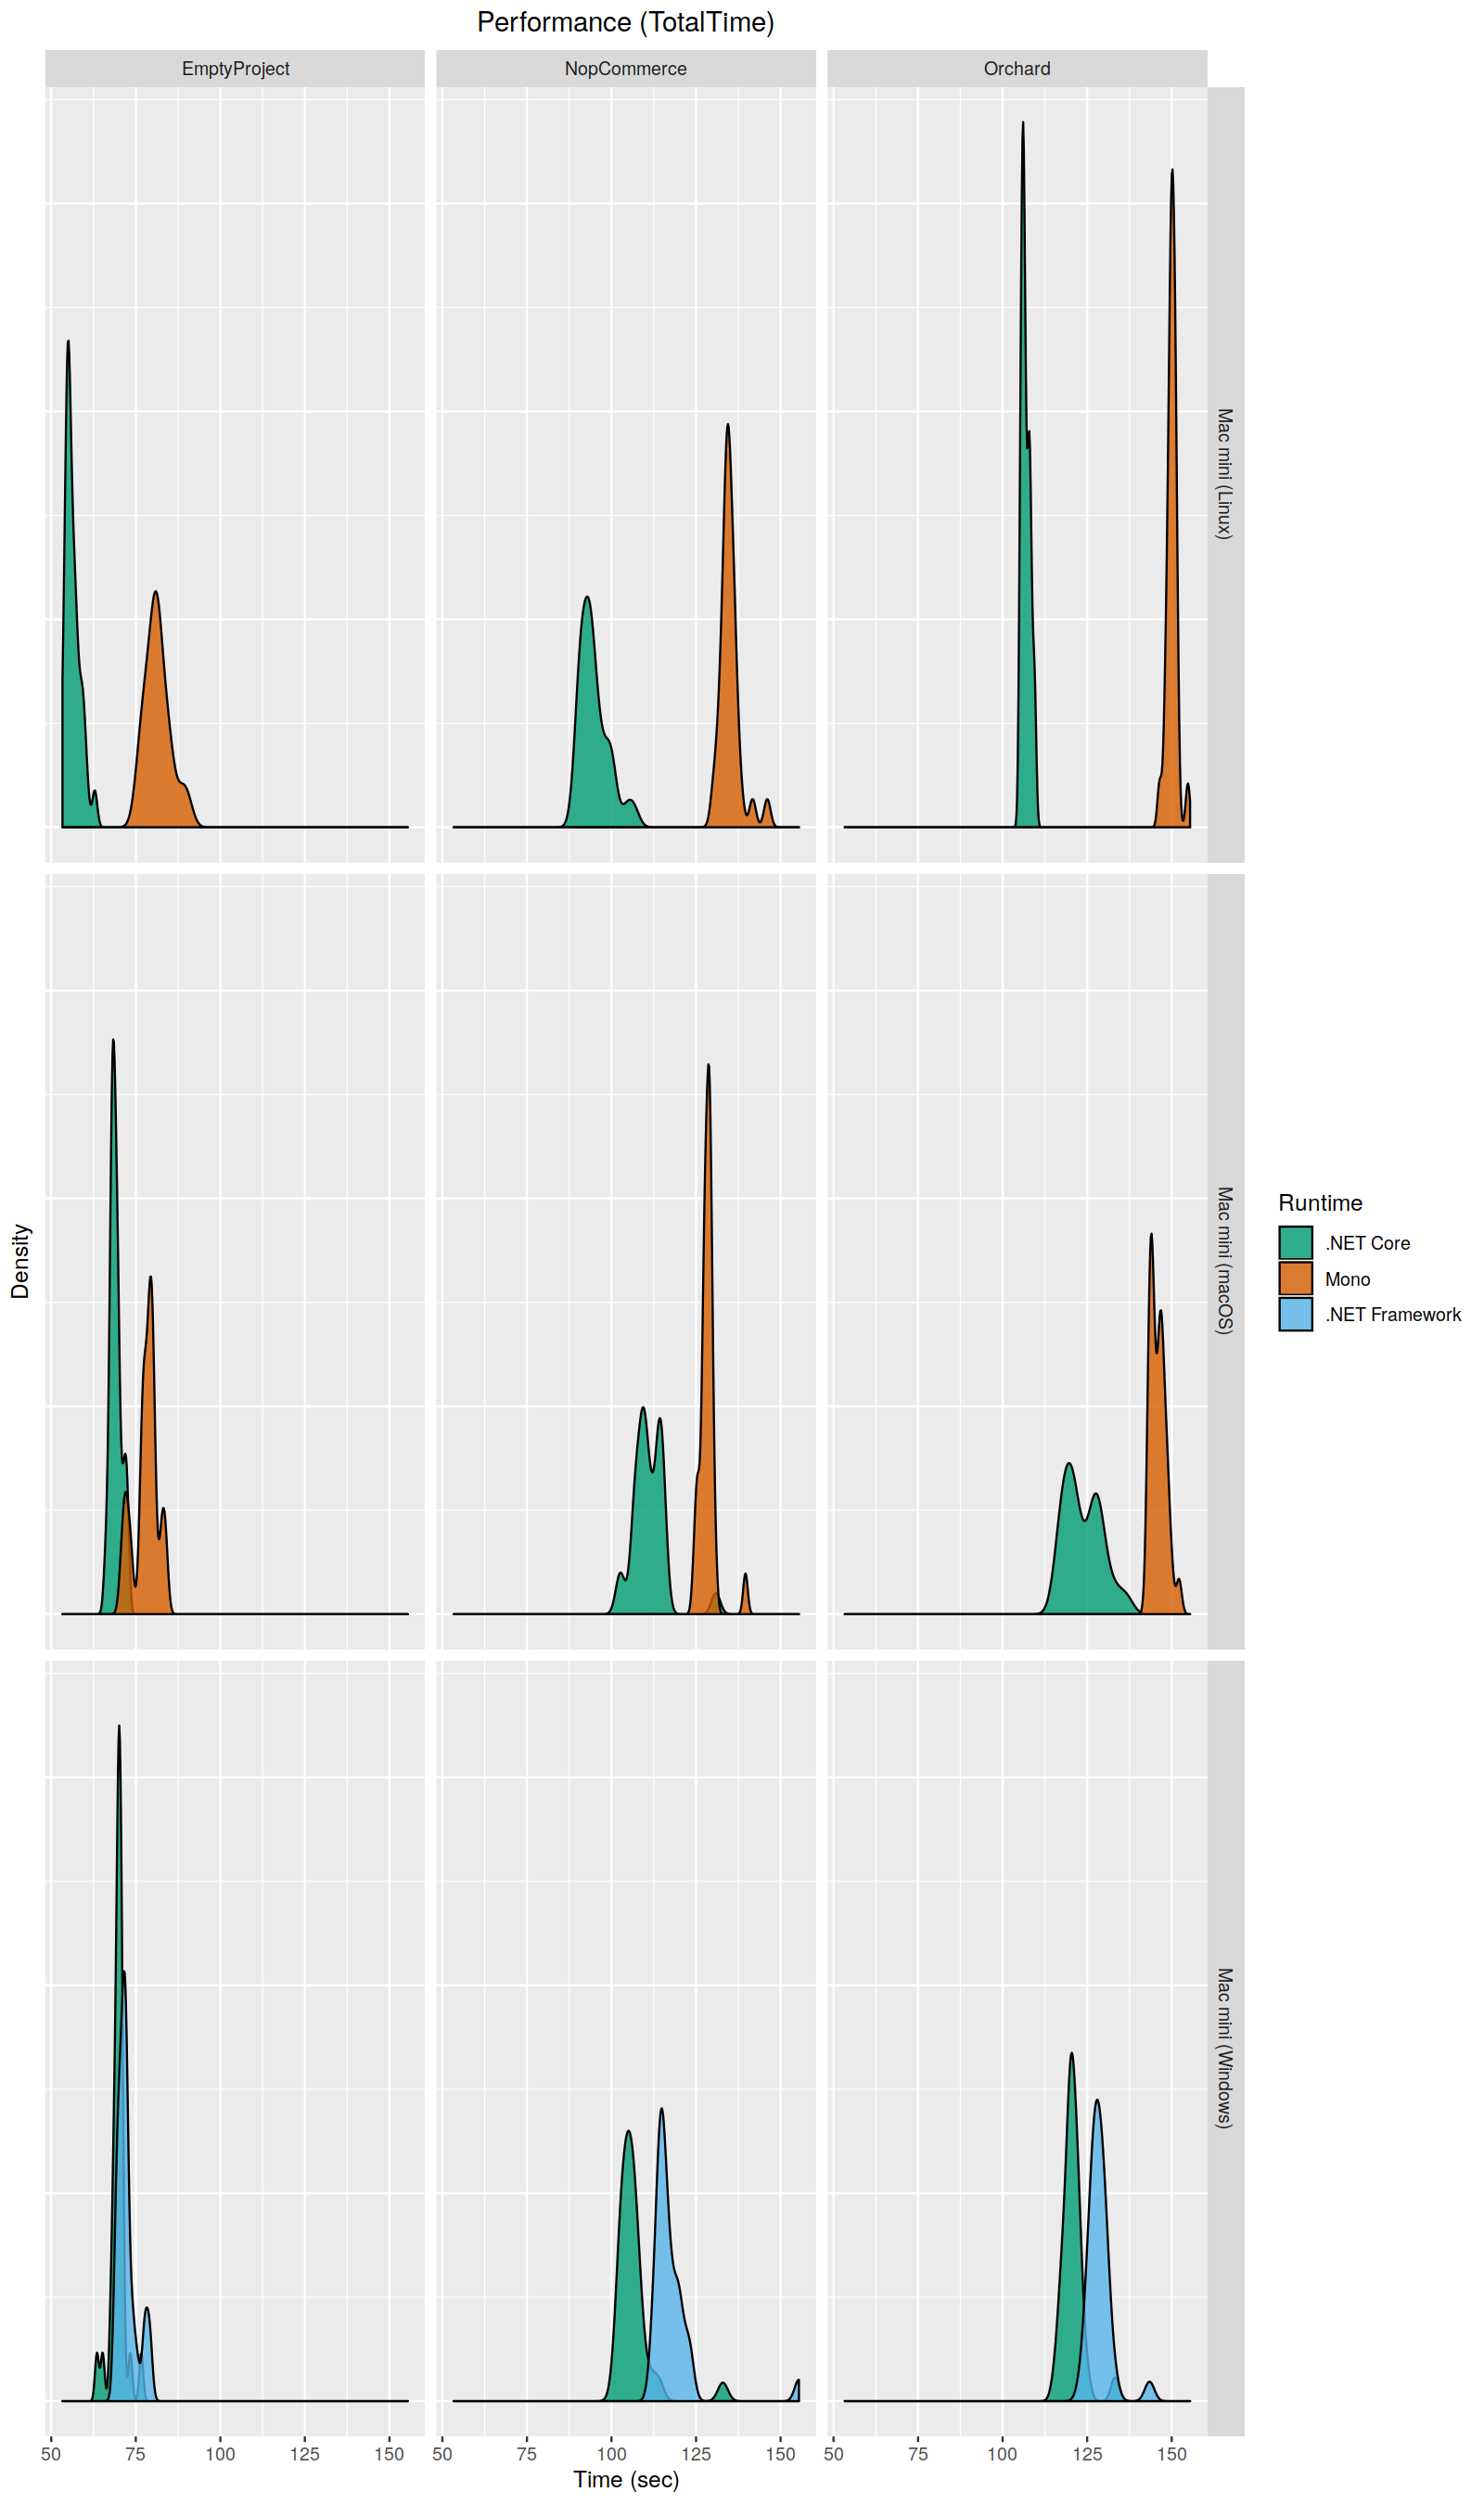
To resolve this problem, we can compare different operating systems using Mac minis! We have three devices with equal hardware characteristics but different operating systems. Out of curiosity, we added Windows with .NET Framework 4.8 to this experiment (we haven’t yet released .NET Core edition for Windows, but we do already have internal experimental support). Let’s repeat our measurements on this mini-farm of Mac mini’s:
Here we can make the following observations:
- The difference between .NET Core and .NET Framework is not so dramatic as the difference between .NET Core and Mono. .NET Core is still a little bit faster, but it may be indistinguishable from .NET Framework in some cases. At least, however, we haven’t seen any regressions. This means that we can continue making the .NET Core edition Windows-compatible.
- If we compare Linux and macOS, the .NET Core edition works faster on Linux, and the Mono edition works faster on macOS. Of course, we can’t draw any general conclusions about runtimes based on a single experiment. However, such analysis is a good starting point for searching for OS-specific bottlenecks. We are definitely going to continue cross-OS benchmarking, which may help us find some interesting places for optimizations.
- Features that work extremely fast on any runtime. When a feature takes less than 50-100ms, minor improvements will not affect user experience. Of course, we are interested in keeping the duration of such features low, but we don't actually care about minor speedups here.
- I/O-bound features. It should come as no surprise that we didn't observe any significant changes in I/O-bound operations. When your main bottleneck is the disk read and write capabilities, it doesn't matter which runtime you use.
- Features that involve external processes. Features like build, run, debug, and unit tests mostly depend on the performance of external processes, so they are not affected by the host runtime.
- Other features. It's very hard to measure the "average" impact on the rest of the features, but it’s typically in the 0-30% range, depending on the scenario.
We decided to measure the restore duration for the BenchmarkDotNet solution, and we took ten measurements on each runtime (the NuGet caches were cleared before each run):
| .NET Core | Mono |
| 16.9 sec | 88.1 sec |
| 18.2 sec | 88.9 sec |
| 17.3 sec | 91.5 sec |
| 17.0 sec | 94.6 sec |
| 15.5 sec | 88.1 sec |
| 15.8 sec | 103.1 sec |
| 15.7 sec | 89.8 sec |
| 17.4 sec | 107.2 sec |
| 16.5 sec | 87.0 sec |
| 16.4 sec | 80.0 sec |
Next, let’s talk about the memory footprint.
Memory Footprint Reduction
One of the biggest complaints from our Linux and macOS users was about the amount of memory that is consumed by the Rider backend processes. For many years, we couldn't help these users, because most of the footprint problems were Mono-specific. It was almost impossible to fix them on our side. Is there a chance that migration to .NET Core has helped with this? Let's find out.It’s pretty hard to evaluate footprint changes in general. There are too many solution-specific issues and corner cases. Instead of a long list of charts, we decided to present measurements only for the five following solutions:
- (1) A solution with a single "Hello World" .NET Core project
- (2) Perfolizer (4 projects)
- (3) BenchmarkDotNet (19 projects)
- (4) A subset of the Rider solution without tests (162 projects) and with solution-wide analysis disabled
- (5) A subset of the Rider solution with tests (250 projects) and with solution-wide analysis enabled
| Project | .NET Core | Mono |
| (1) | 75-80 | 150-160 |
| (2) | 90-100 | 170-180 |
| (3) | 180-190 | 330-340 |
| (4) | 560-640 | 800-840 |
| (5) | 1460-1500 | 1820-1860 |
Conclusion
It's pretty hard to evaluate performance and footprint changes in such a huge project after migration to another runtime. The metrics depend on many factors, such as the hardware used, the structure of a solution, and the use cases tested. If you ask for a short summarized conclusion, we can say that the total performance improvement ranges from 0-30% for solution opening and some general features to 550-650% for some individual features like NuGet restore. The total footprint improvement is roughly 20-50% depending on the solution and the set of enabled features.In case you are interested to know what’s next for us, here is our roadmap for the near future:
- We are going to migrate to .NET Core on Windows (currently we are still using .NET Framework; .NET Core is only enabled for Linux and macOS). It will take some time because not all of our features are ready for .NET Core (e.g., the current implementation of WinForms is not compatible with the new runtime), but we will do our best to finish the migration process this year.
- We are going to investigate cases where we have degradations after switching runtimes. It's a pretty interesting topic, but we just didn't have enough time for a thorough investigation ahead of this release.
- We are going to publish more blog posts about the technical challenges that we’ve resolved, about differences between .NET Core and Mono, and about our approaches to performance analysis. The goal of this post was to provide a high-level overview of the general impact of the migration, so we weren’t able to present a lot of interesting details. We will share those soon, though, so stay tuned!
- You can add a status bar widget that displays the current runtime. Press Ctrl+Shift+A (or Command+Shift+A on macOS), find "Registry...", hit Enter, find rider.enable.statusbar.runtimeIcon, enable it, and restart Rider. After that, you will get a widget that displays the icon of .NET Core or Mono depending on the current runtime. While the .NET Core backend is publicly available, this status widget is not. Hence, it’s hidden in the registry, together with other experimental flags for the IDE. You’re now part of the secret group that wields the power of experimental flags!
- You can switch between runtimes with the Help menu (choose the "Switch IDE Runtime to *" action). Alternatively, you can switch using the runtime icon widget with a left-click.
- You can add a backend memory widget that displays the current amount of memory that is consumed by the backend process. Right-click on the status bar and choose "Backend Memory Indicator".
