Non-normal median sampling distribution
Let’s consider the classic sample median. If a sample is sorted and the number of sample elements is odd, the median is the middle element. In the case of an even number of sample elements, the median is an arithmetic average of the two middle elements.
Now let’s say we randomly take many samples from the same distribution and calculate the median for each of them. Next, we build a sampling distribution based on these median values. There is a well-known fact that this distribution is asymptotically normal with mean $M$ and variance $1/(4nf^2(M))$, where $n$ is the number of elements in samples, $f$ is the probability density function of the original distribution, and $M$ is the true median of the original distribution.
Unfortunately, if we try to build such sampling distributions in practice, we may see that they are not always normal. There are some corner cases that prevent us from using the normal model in general. If you implement general routines that analyze the median behavior, you should keep such cases in mind. In this post, we briefly talk about some of these cases.
Regular case
We start with a regular case when the median sampling distribution actually behaves like a normal one. Let’s consider the standard exponential distribution ($\lambda = 1$):
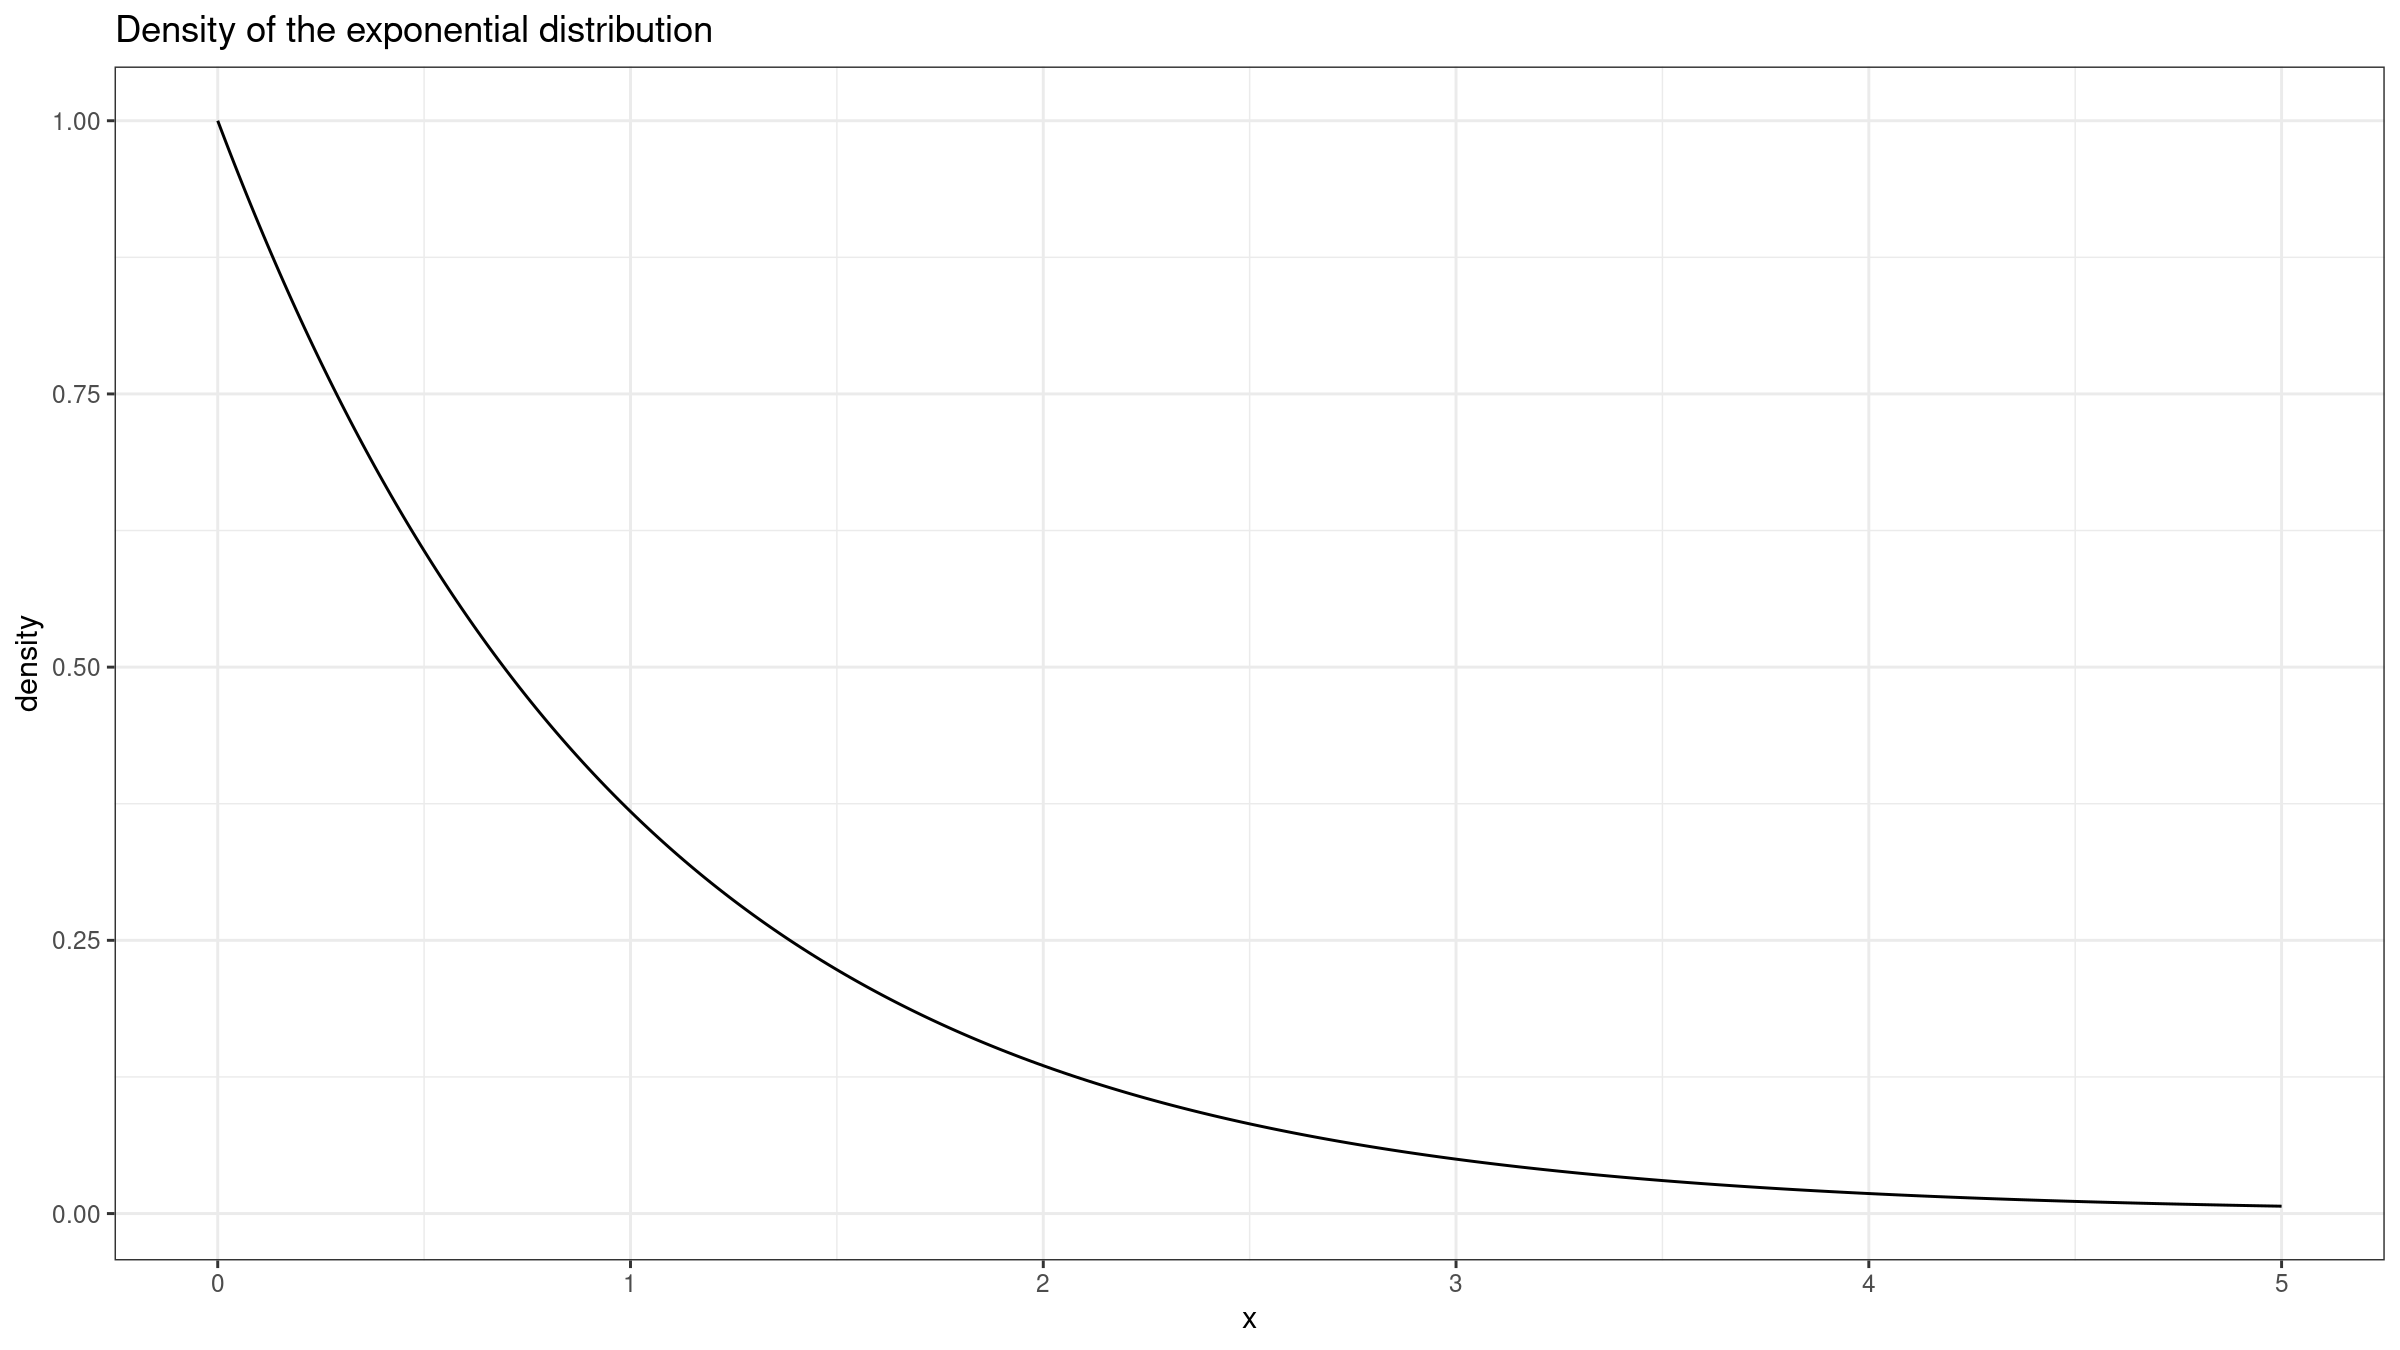
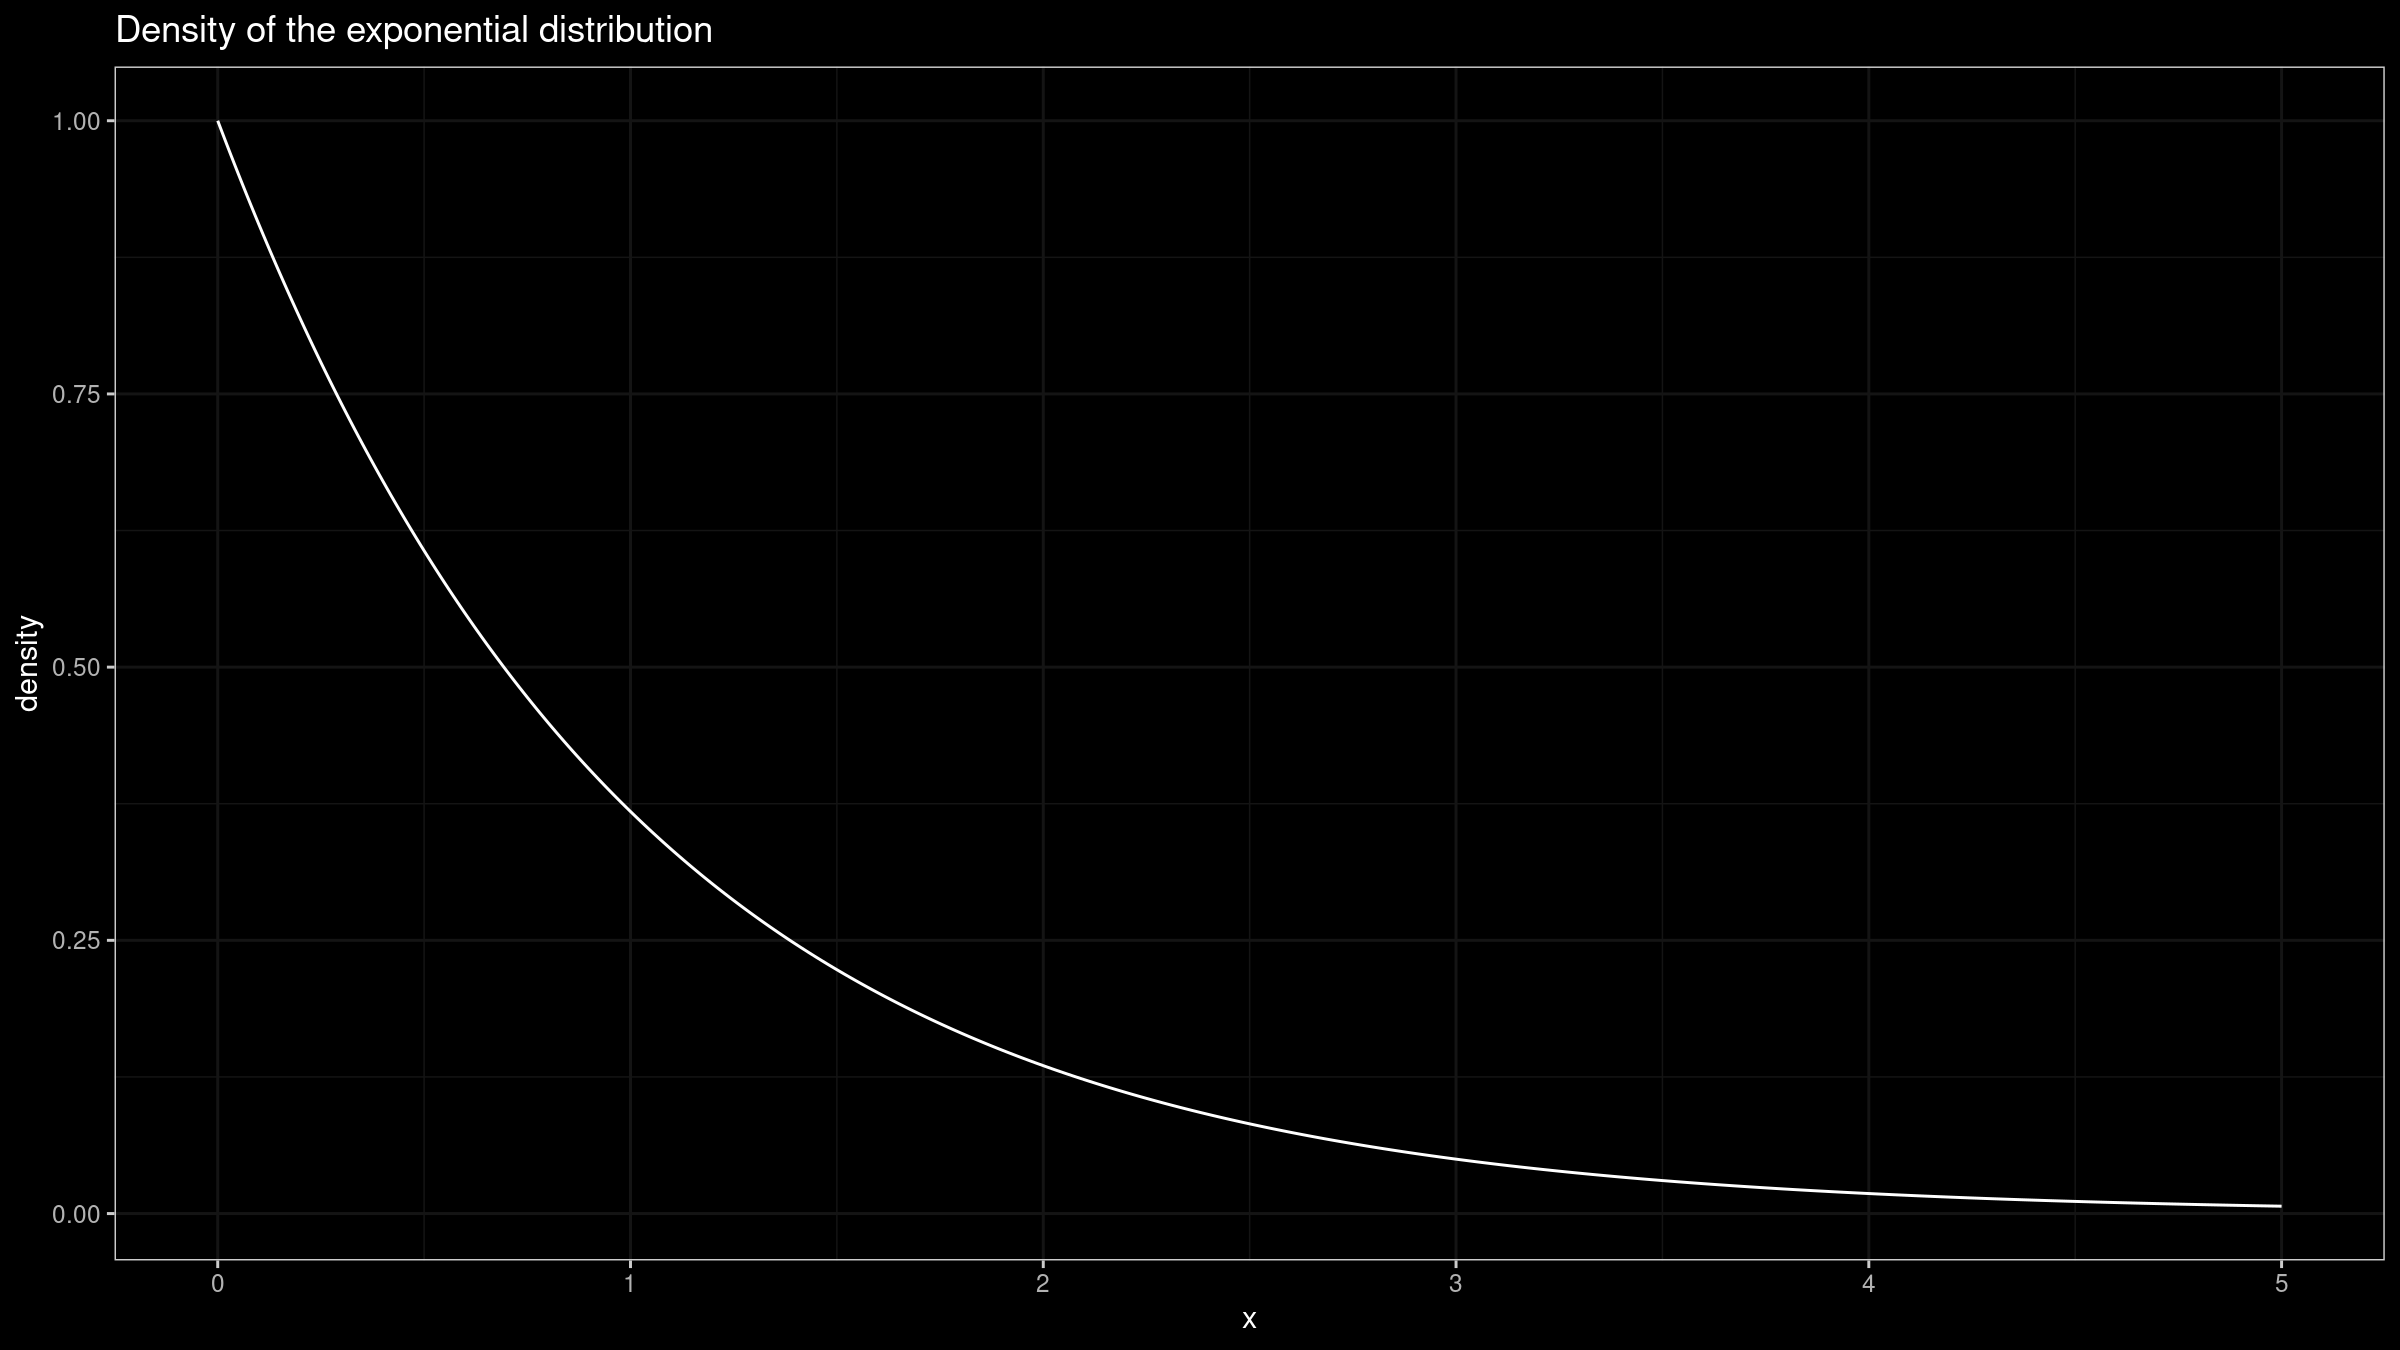
Its median of this distribution is well-known:
$$ M = \frac{\ln 2}{\lambda} $$The corresponding PDF is also known:
$$ f(x) = \lambda e^{-\lambda x} $$Thus, the mean of the sampling distribution is $\mu = M = \ln 2 \approx 0.693$. If we set $n = 50$, the variance is $\sigma^2 = 1/(4nf^2(m)) = 0.02$.
Now let’s generate $10\,000$ samples of size $50$, get the sample median for each of them, and build the kernel density estimation of the sampling distribution using the Sheather & Jones method:
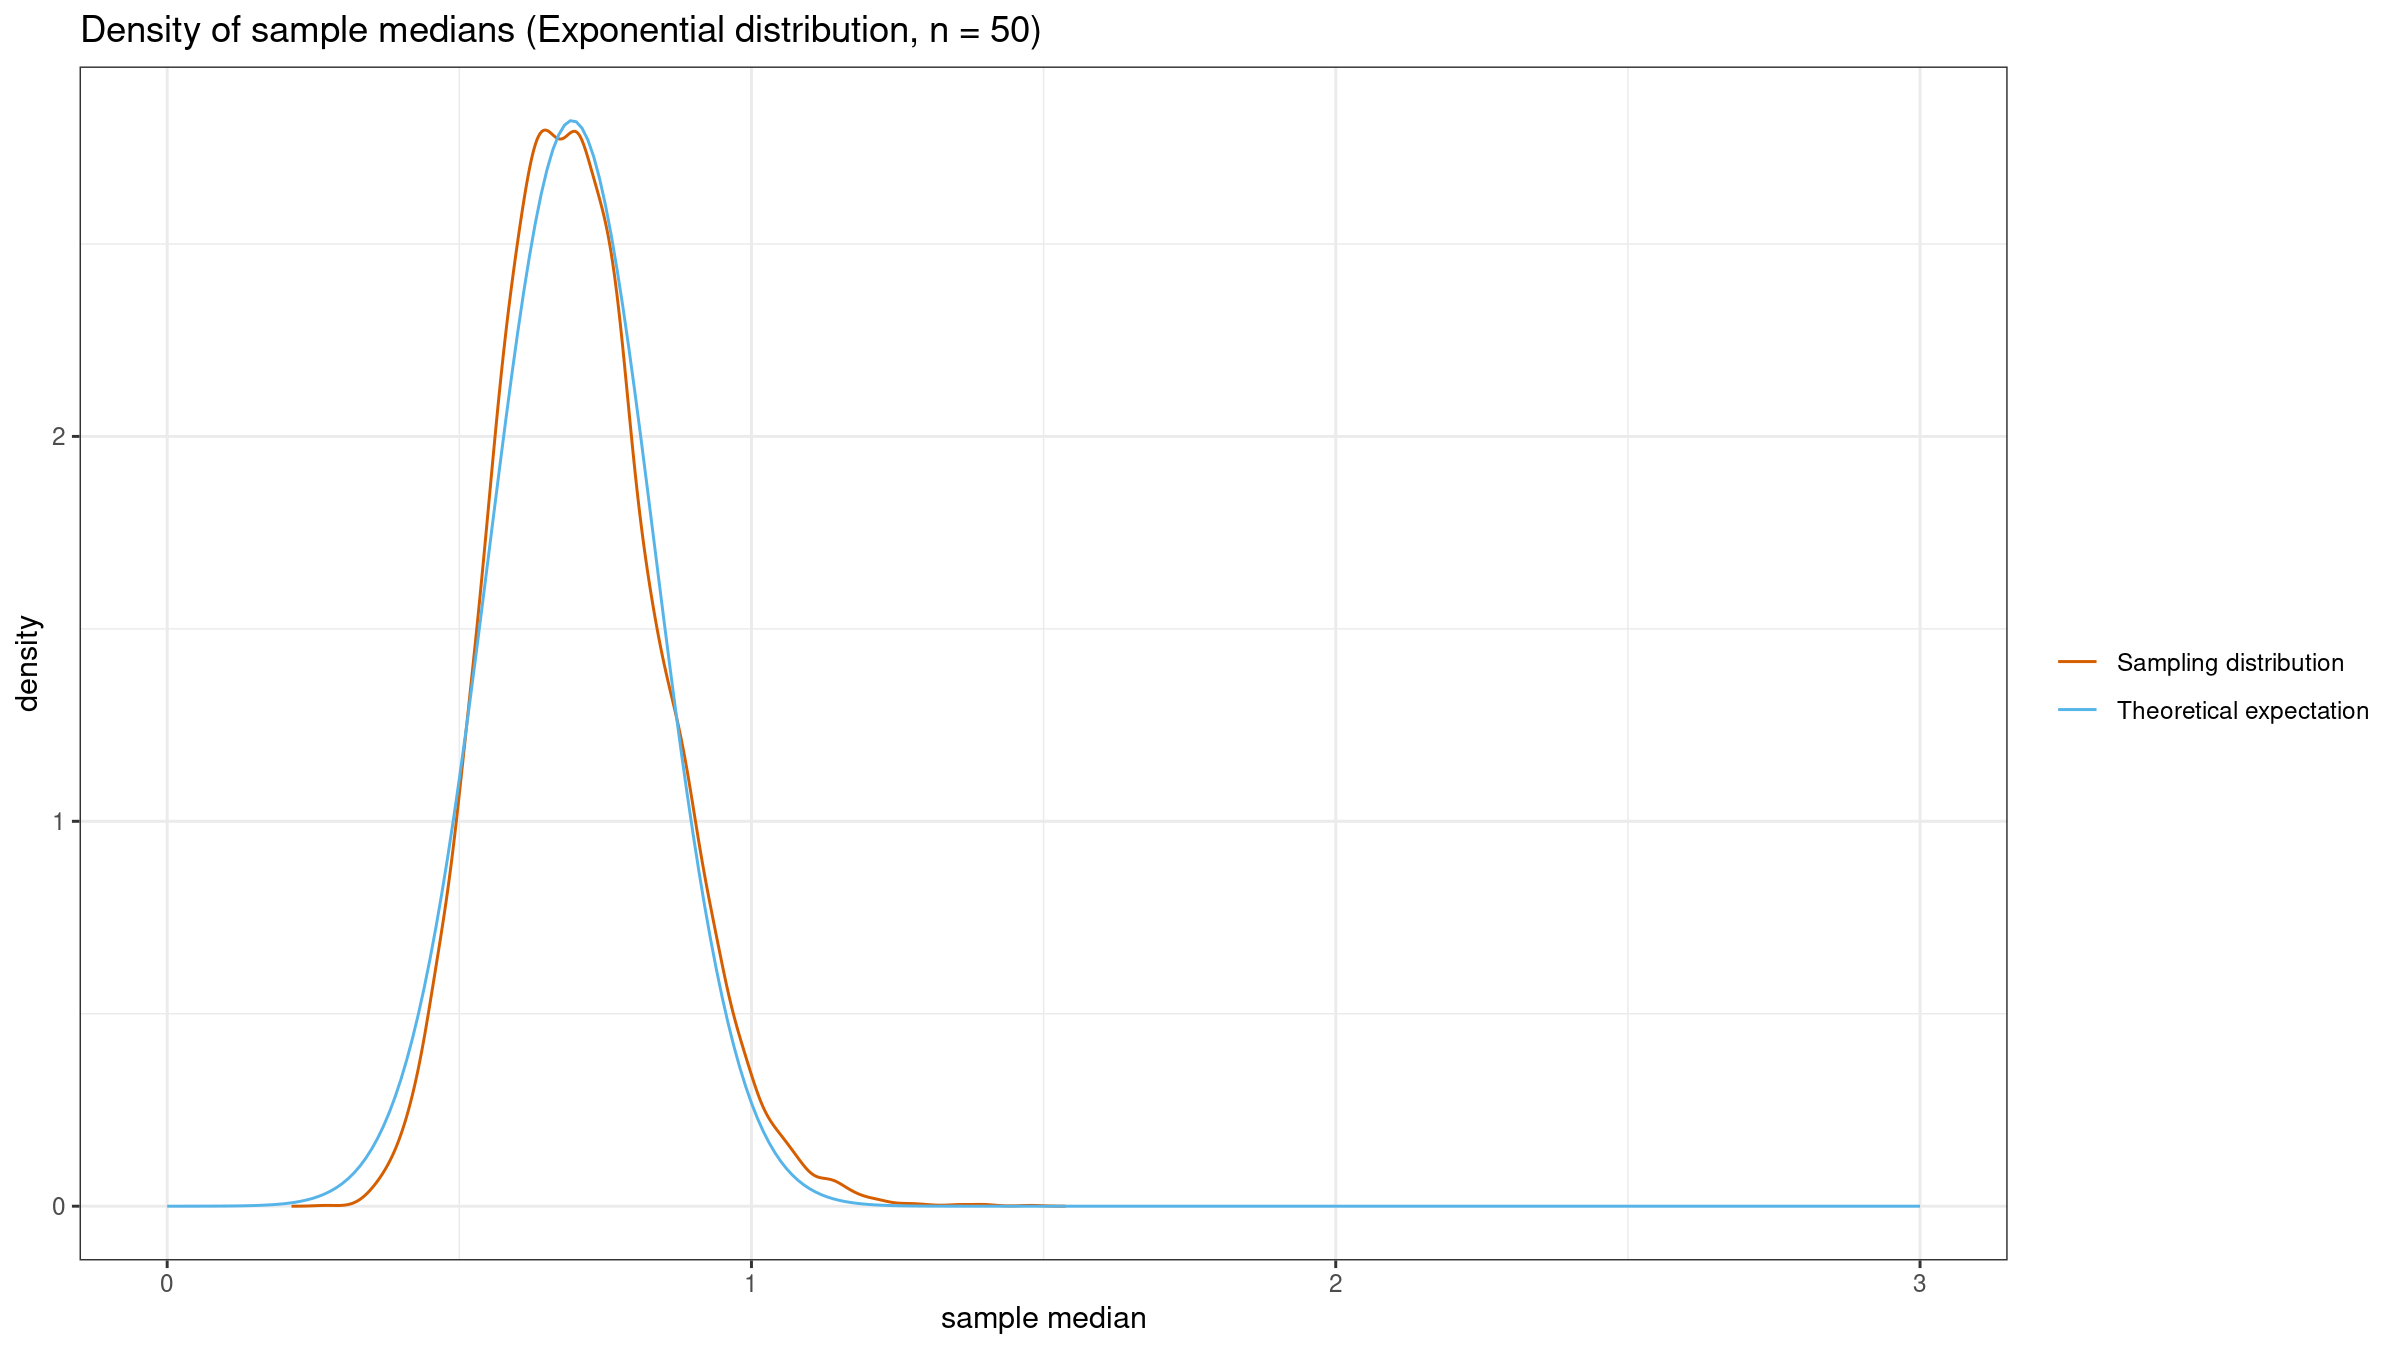
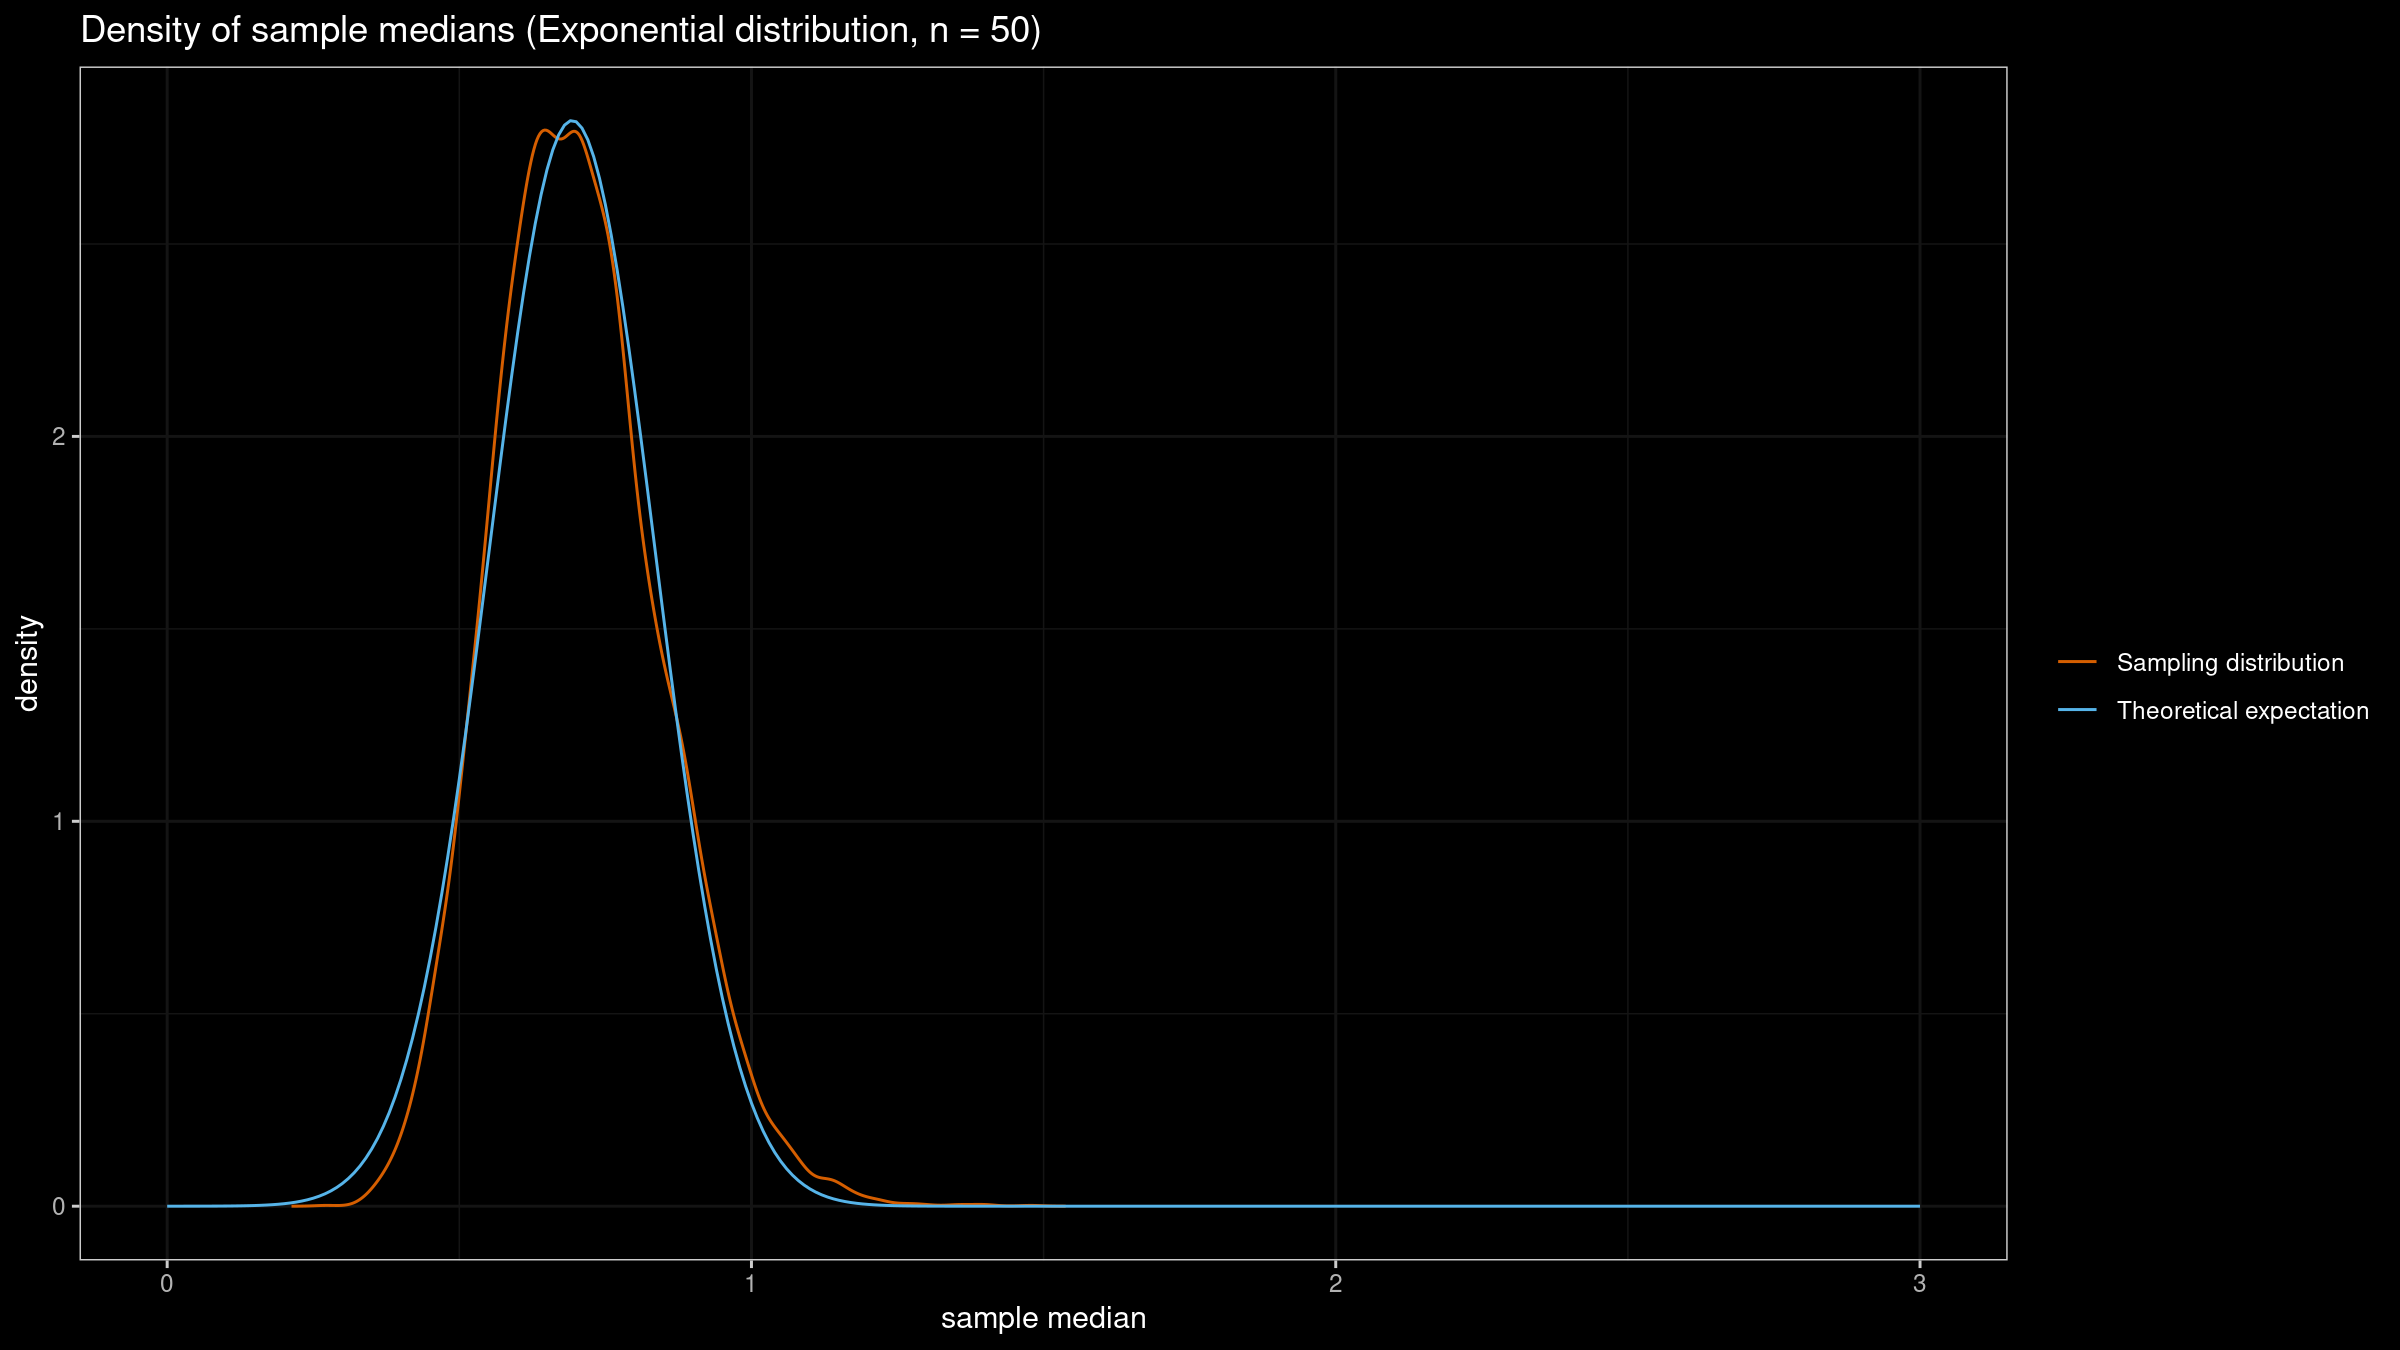
As we can see, the actual sampling distribution is pretty close to the theoretical one. So far, the normality assumption works as expected.
Small samples
Now let’s reduce the sample size to $n=5$ and repeat the experiment. The theoretical model has the same mean, but the variance is $\sigma^2 = 0.2$. Here are the simulation results:
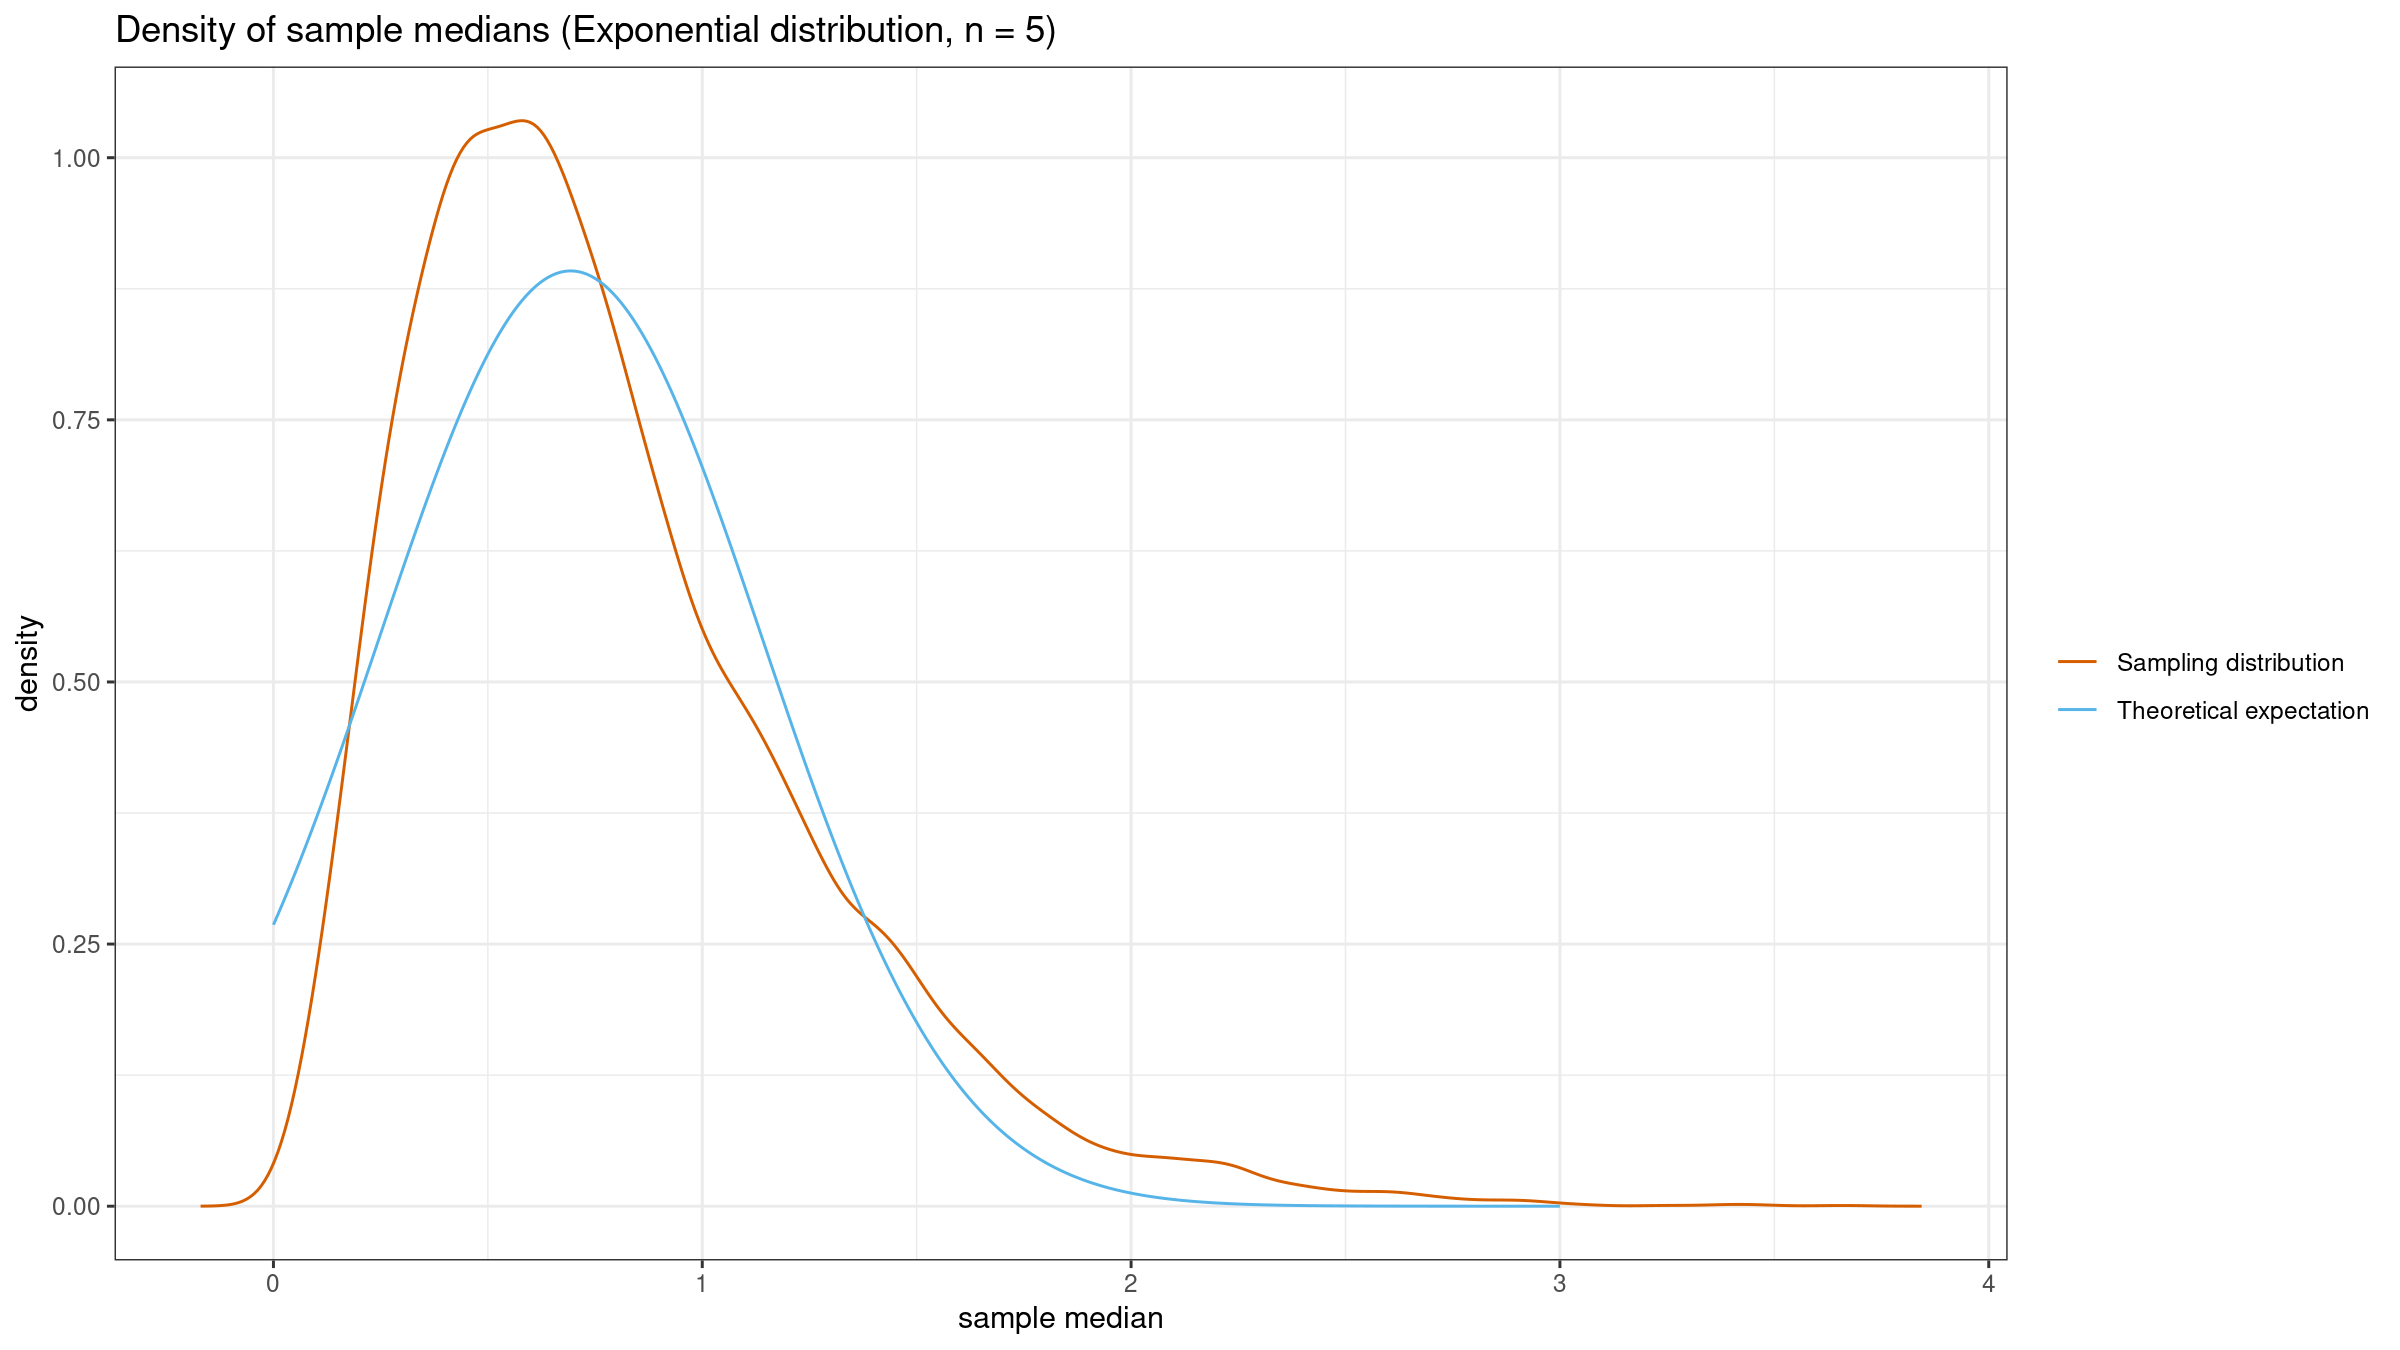

Now the theoretical model is not so close to the empirical one. The median sampling distribution is only asymptotically normal. Thus, we shouldn’t expect the predicted normality on small samples. The “proper” sample size heavily depends on the underlying distributions. In some cases, you may need several hundreds of elements in each sample to achieve the expected normality.
Zero PDF
Now let’s talk about corner cases. The variance of the sampling distribution should be asymptotically equal $1/(4nf^2(M))$. But what if $f(M) = 0$?
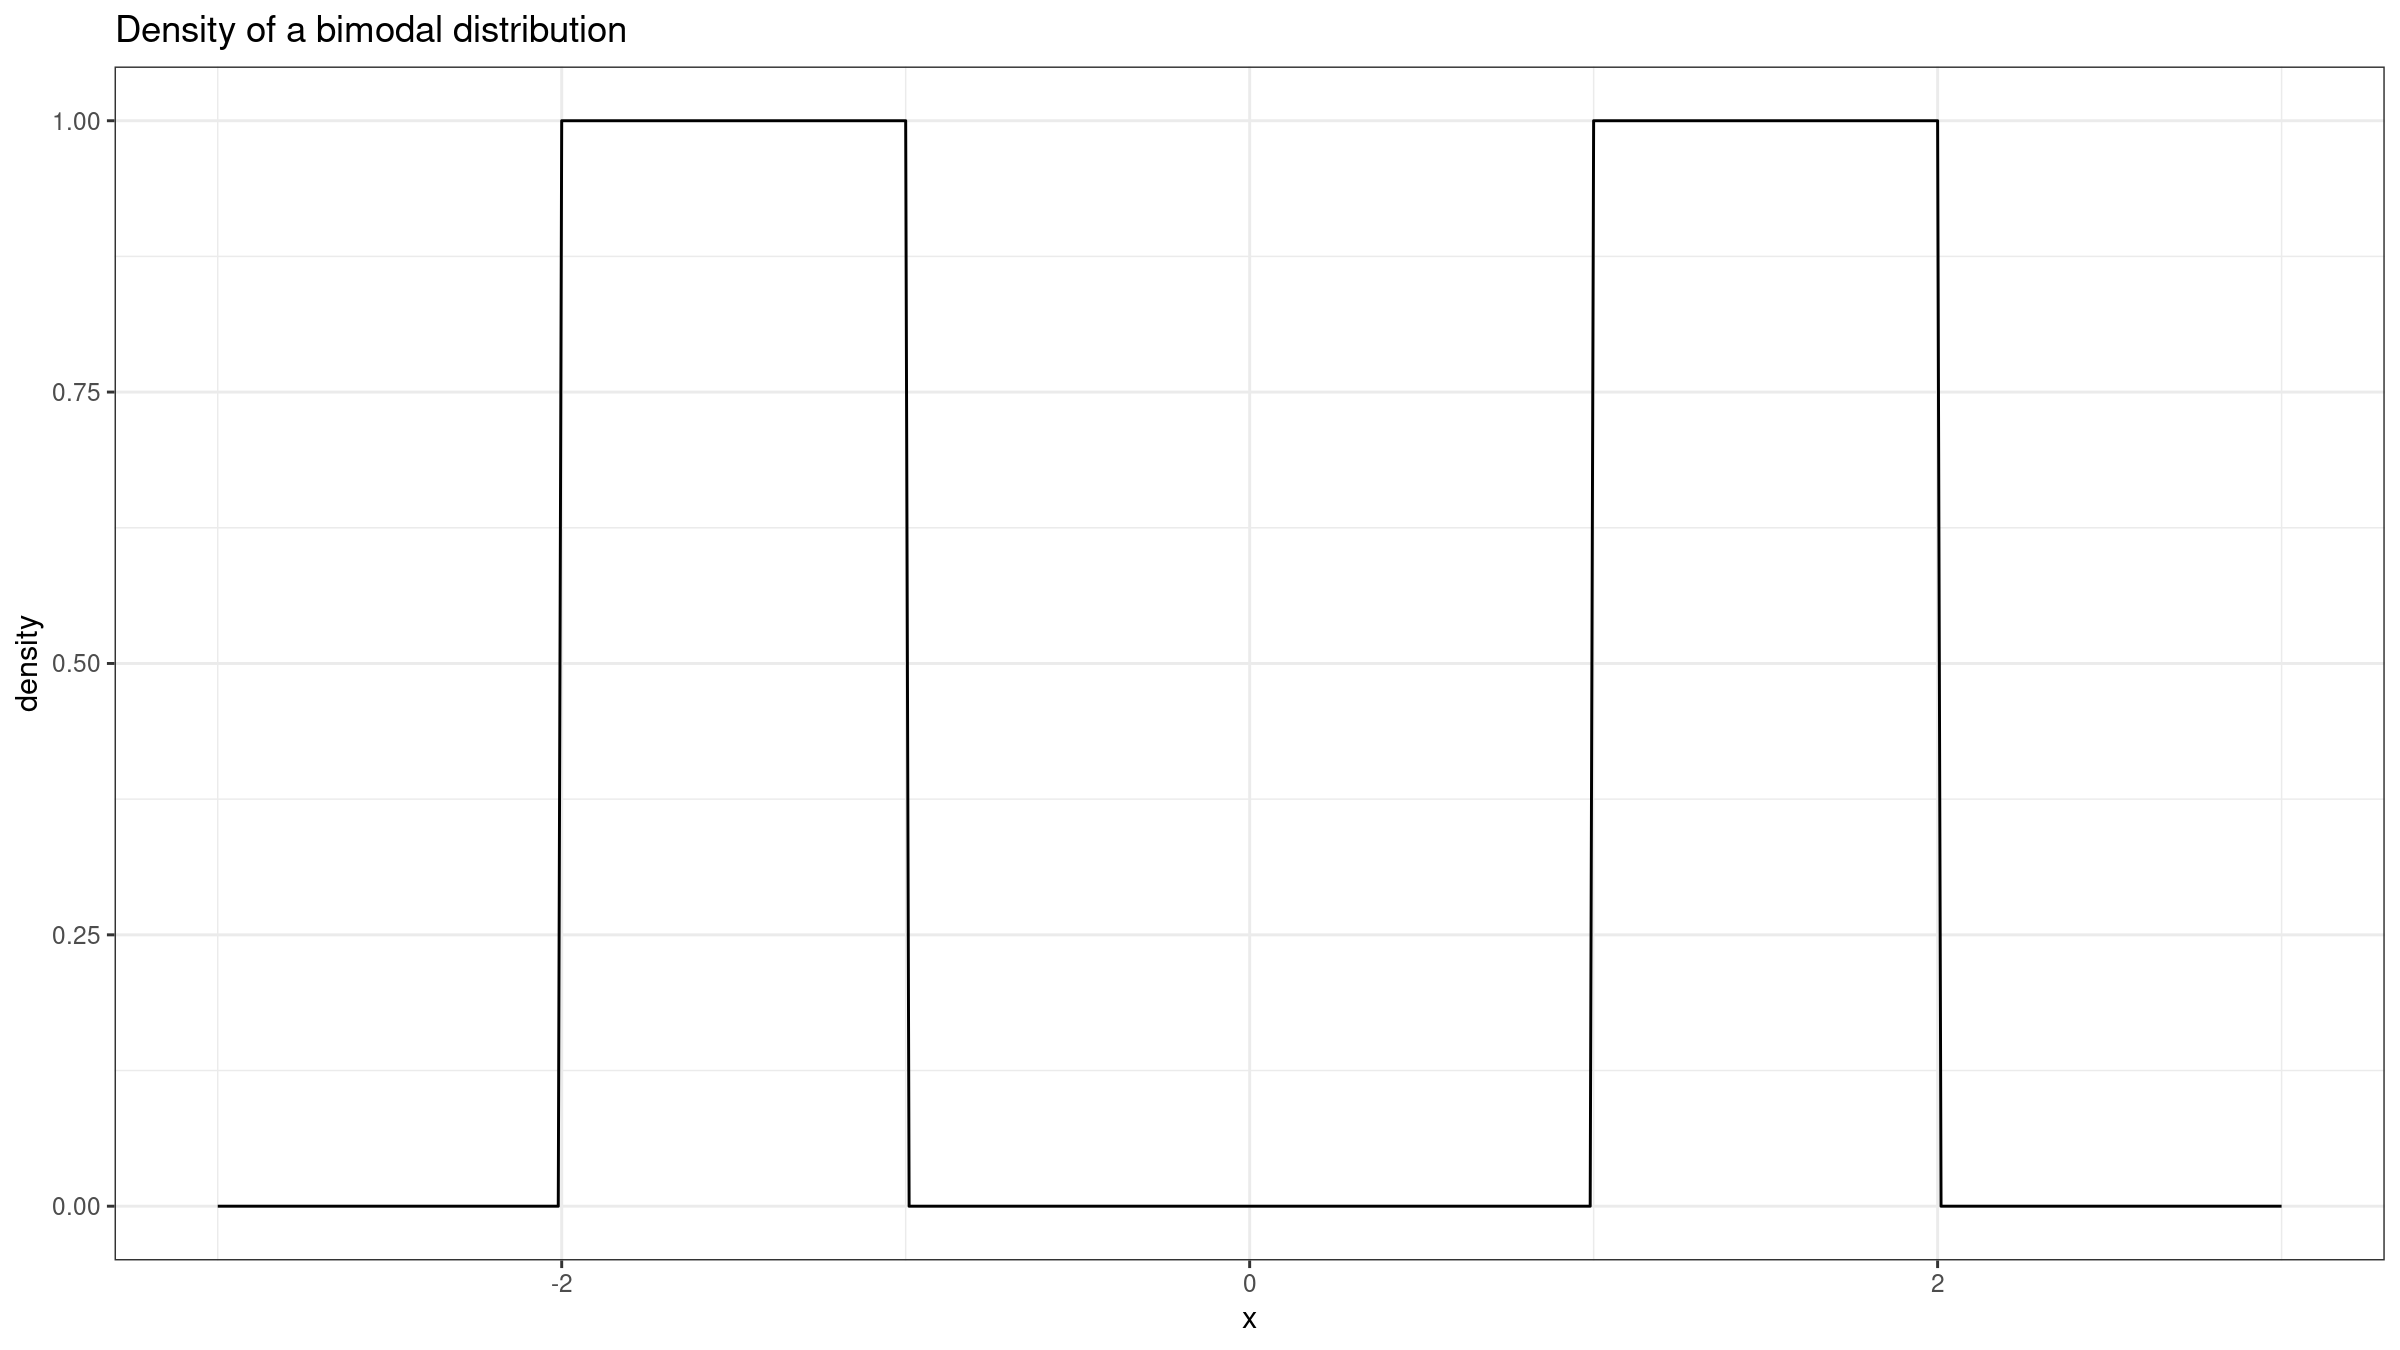
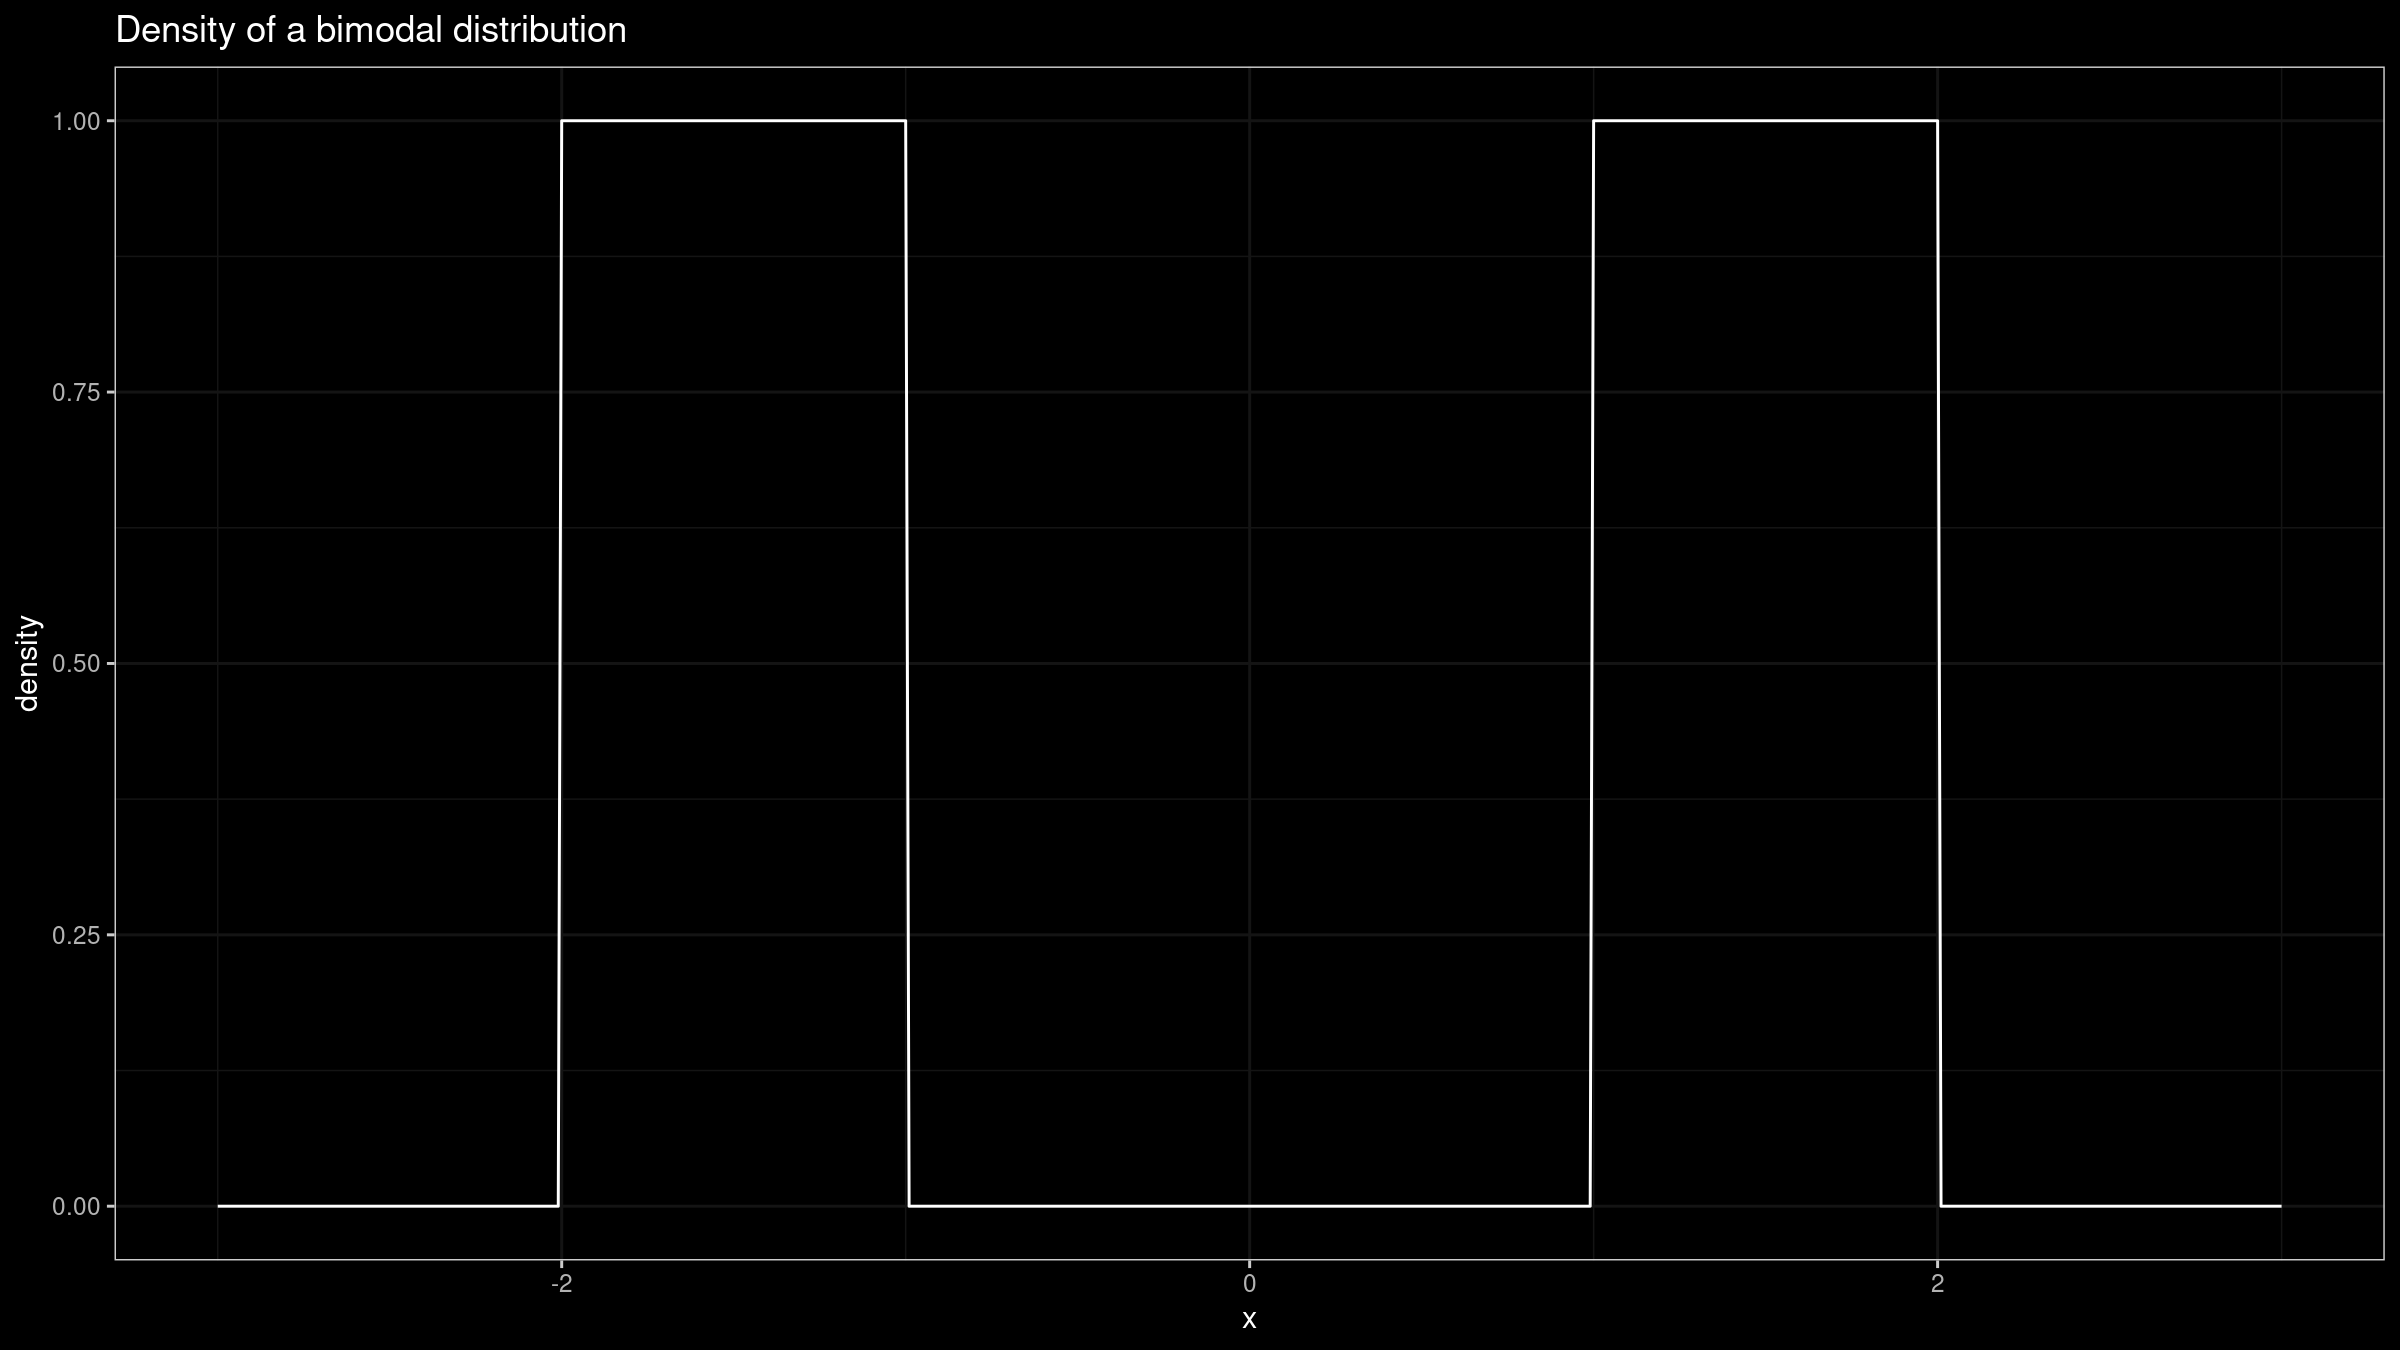
Let’s consider a perfect bimodal distribution formed by two uniform distributions $\mathcal{U}(-2, -1)$ and $\mathcal{U}(1, 2)$:
Here is the corresponding empirical sampling distribution:
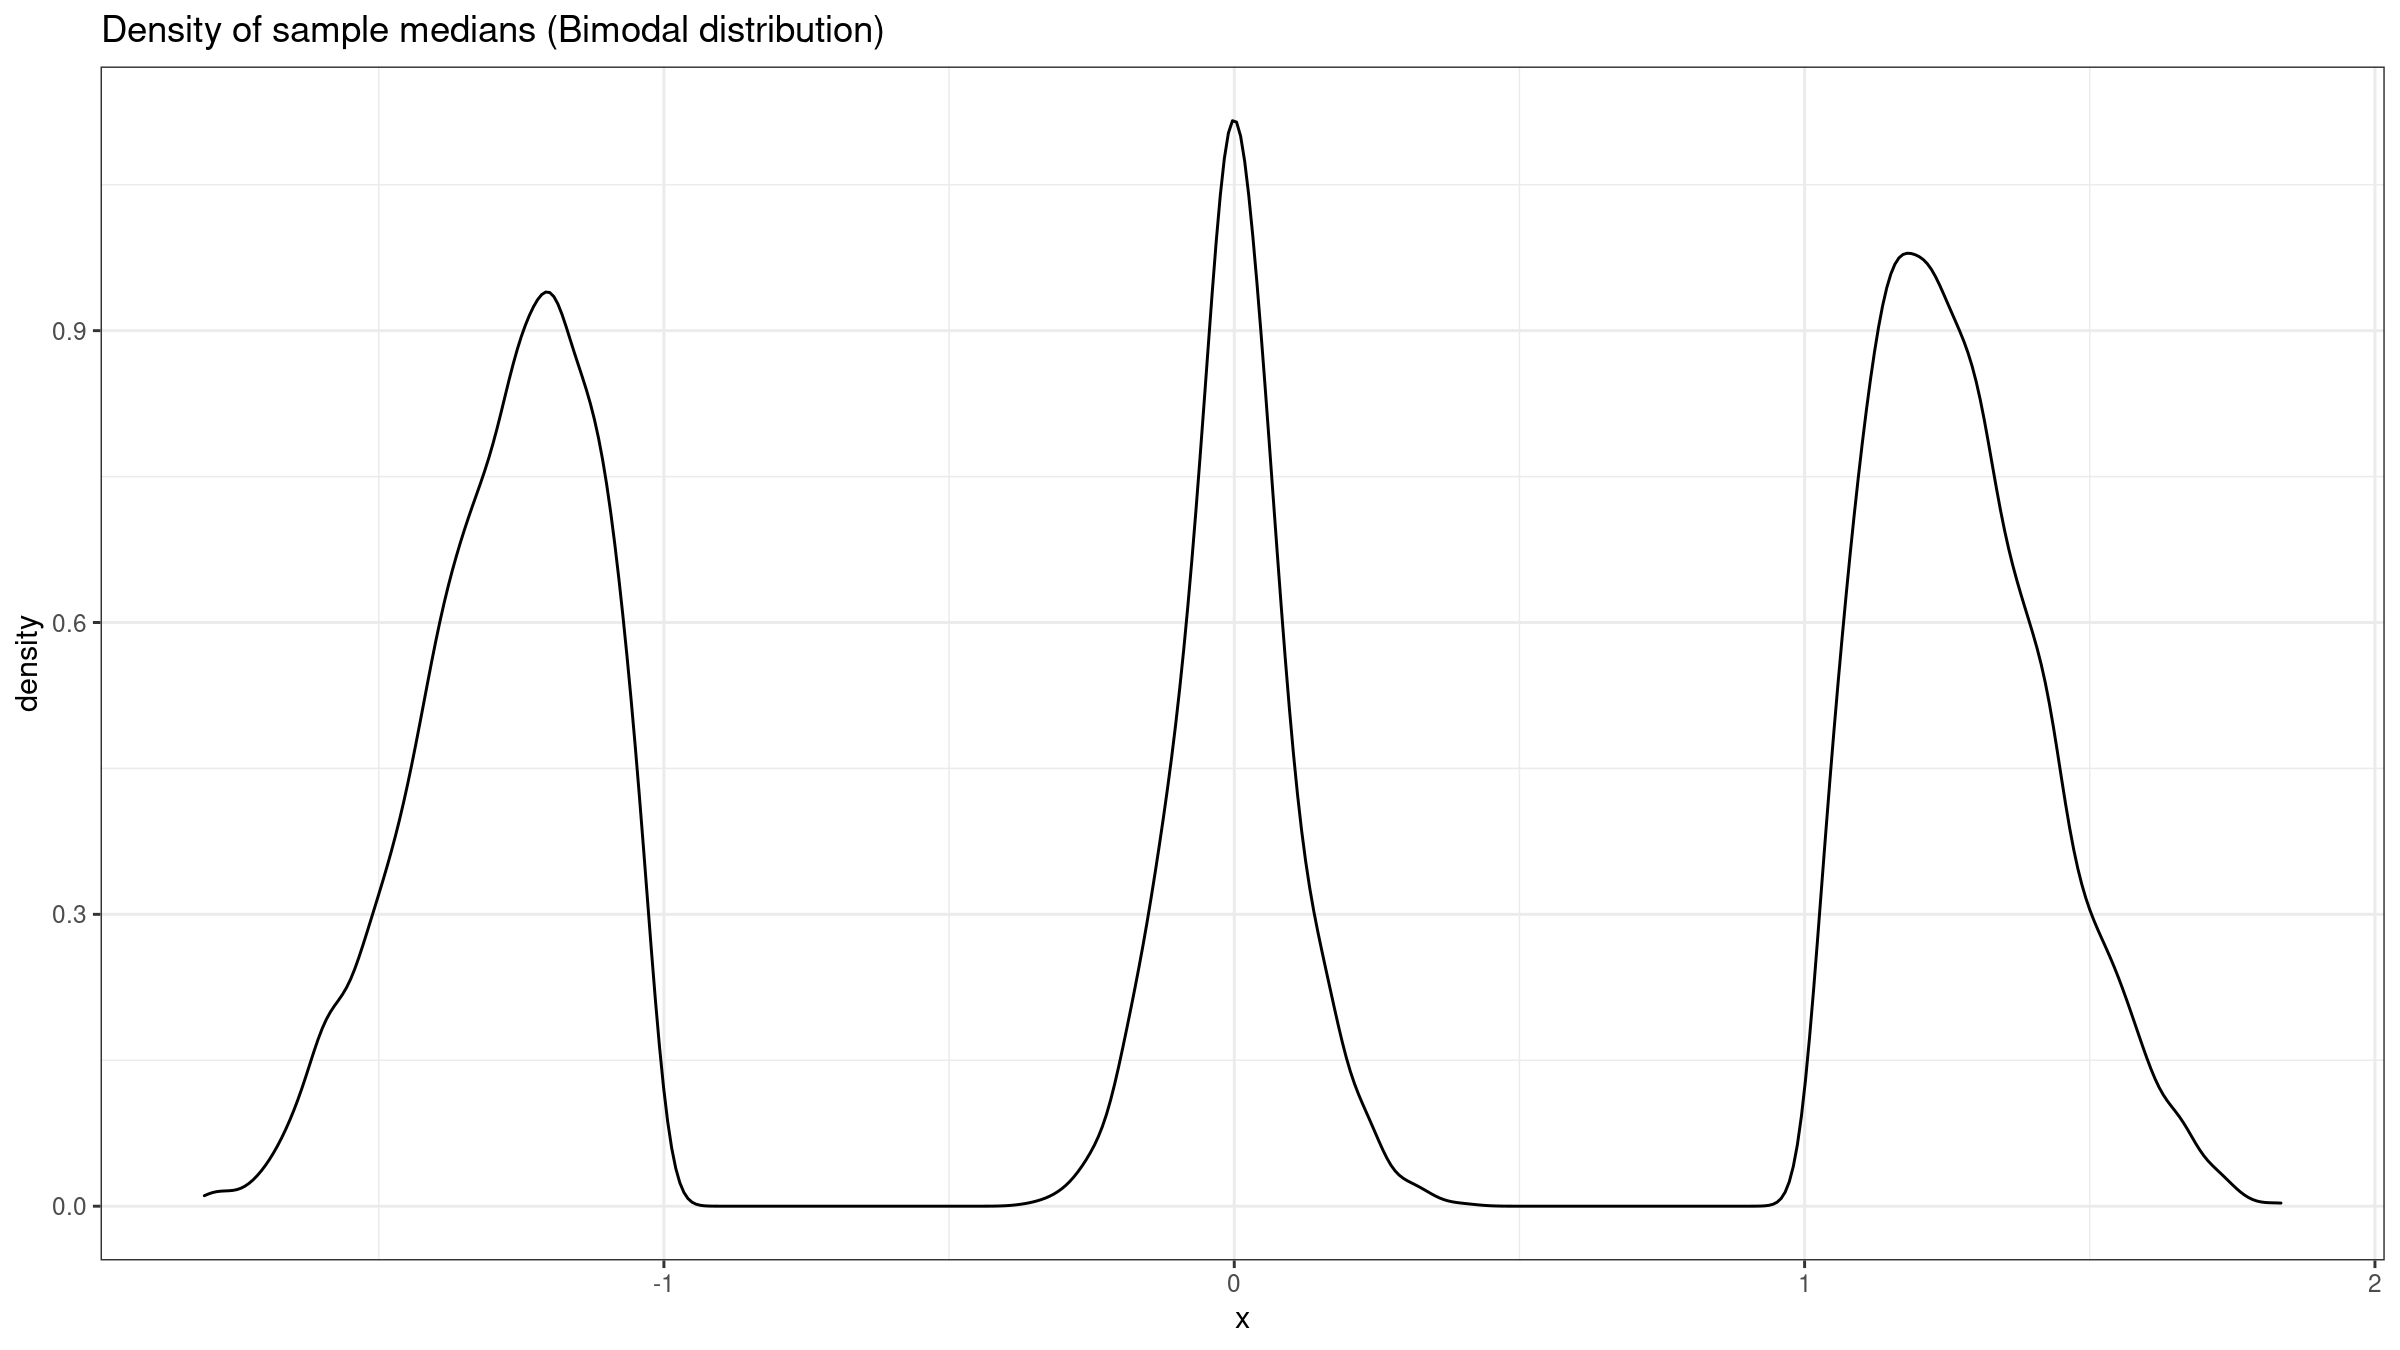
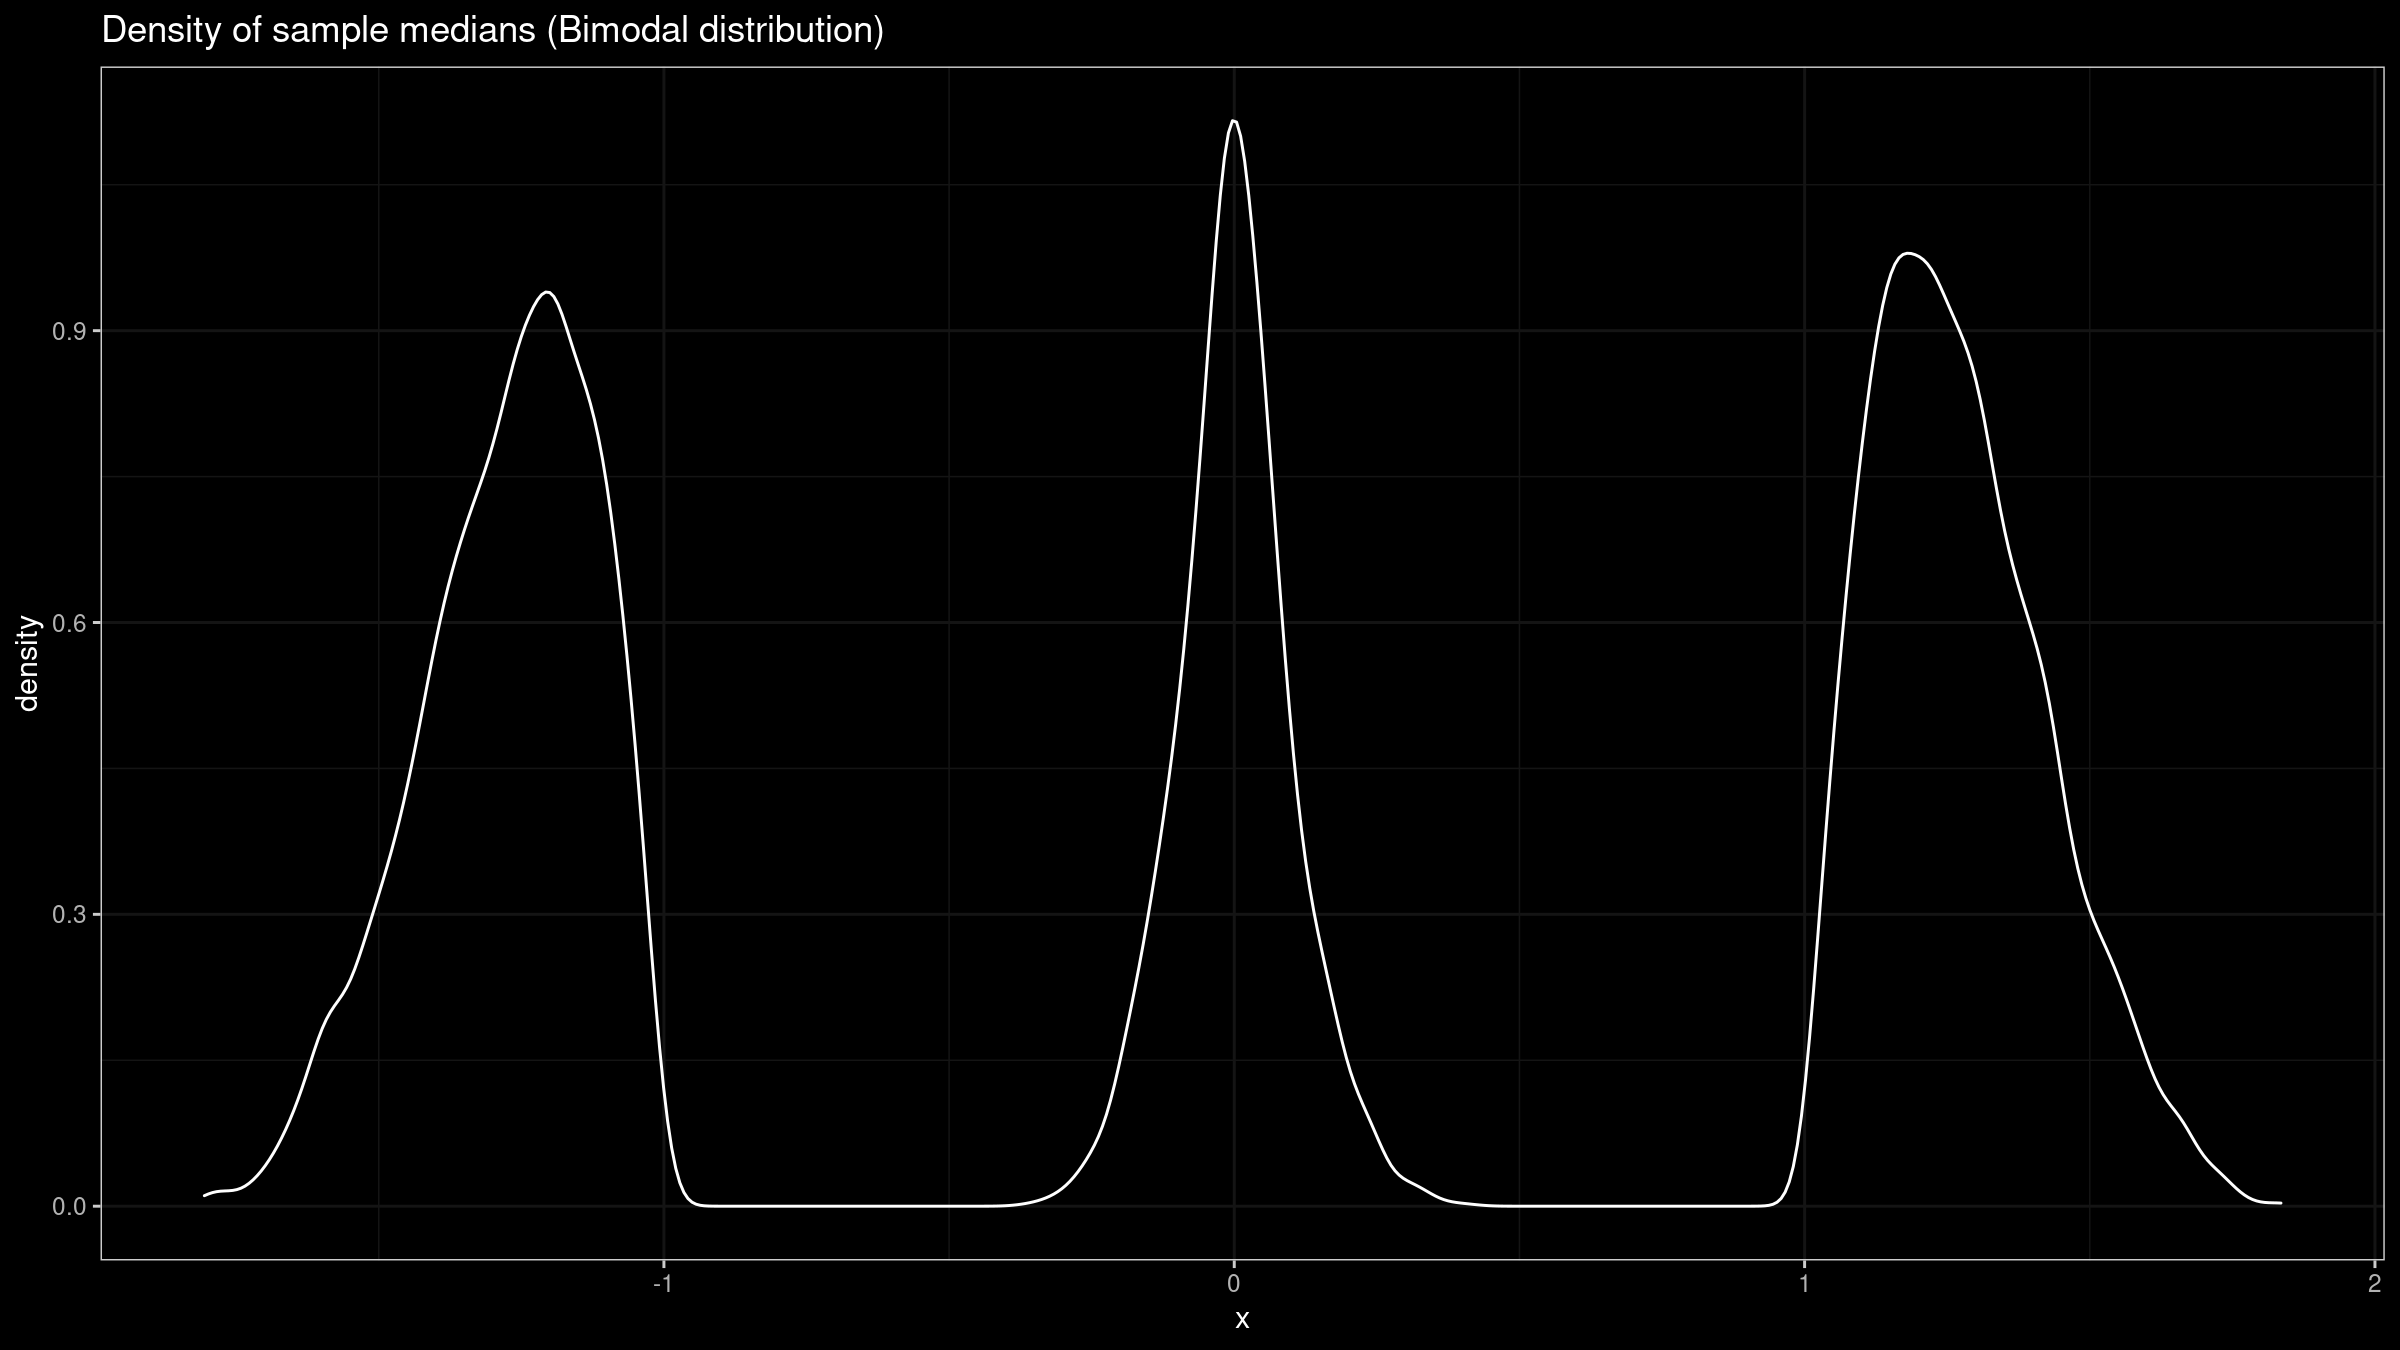
As we can see, it’s trimodal. Doesn’t look like a normal one, does it? Unfortunately, when $f(M) = 0$, we can’t rely on the normal model anymore.
Infinite PDF
Another corner case is $f(M) = \infty$. Let’s consider the rectified Gaussian distribution which could be obtained from the normal distribution by replacing all the negative values with zeros:
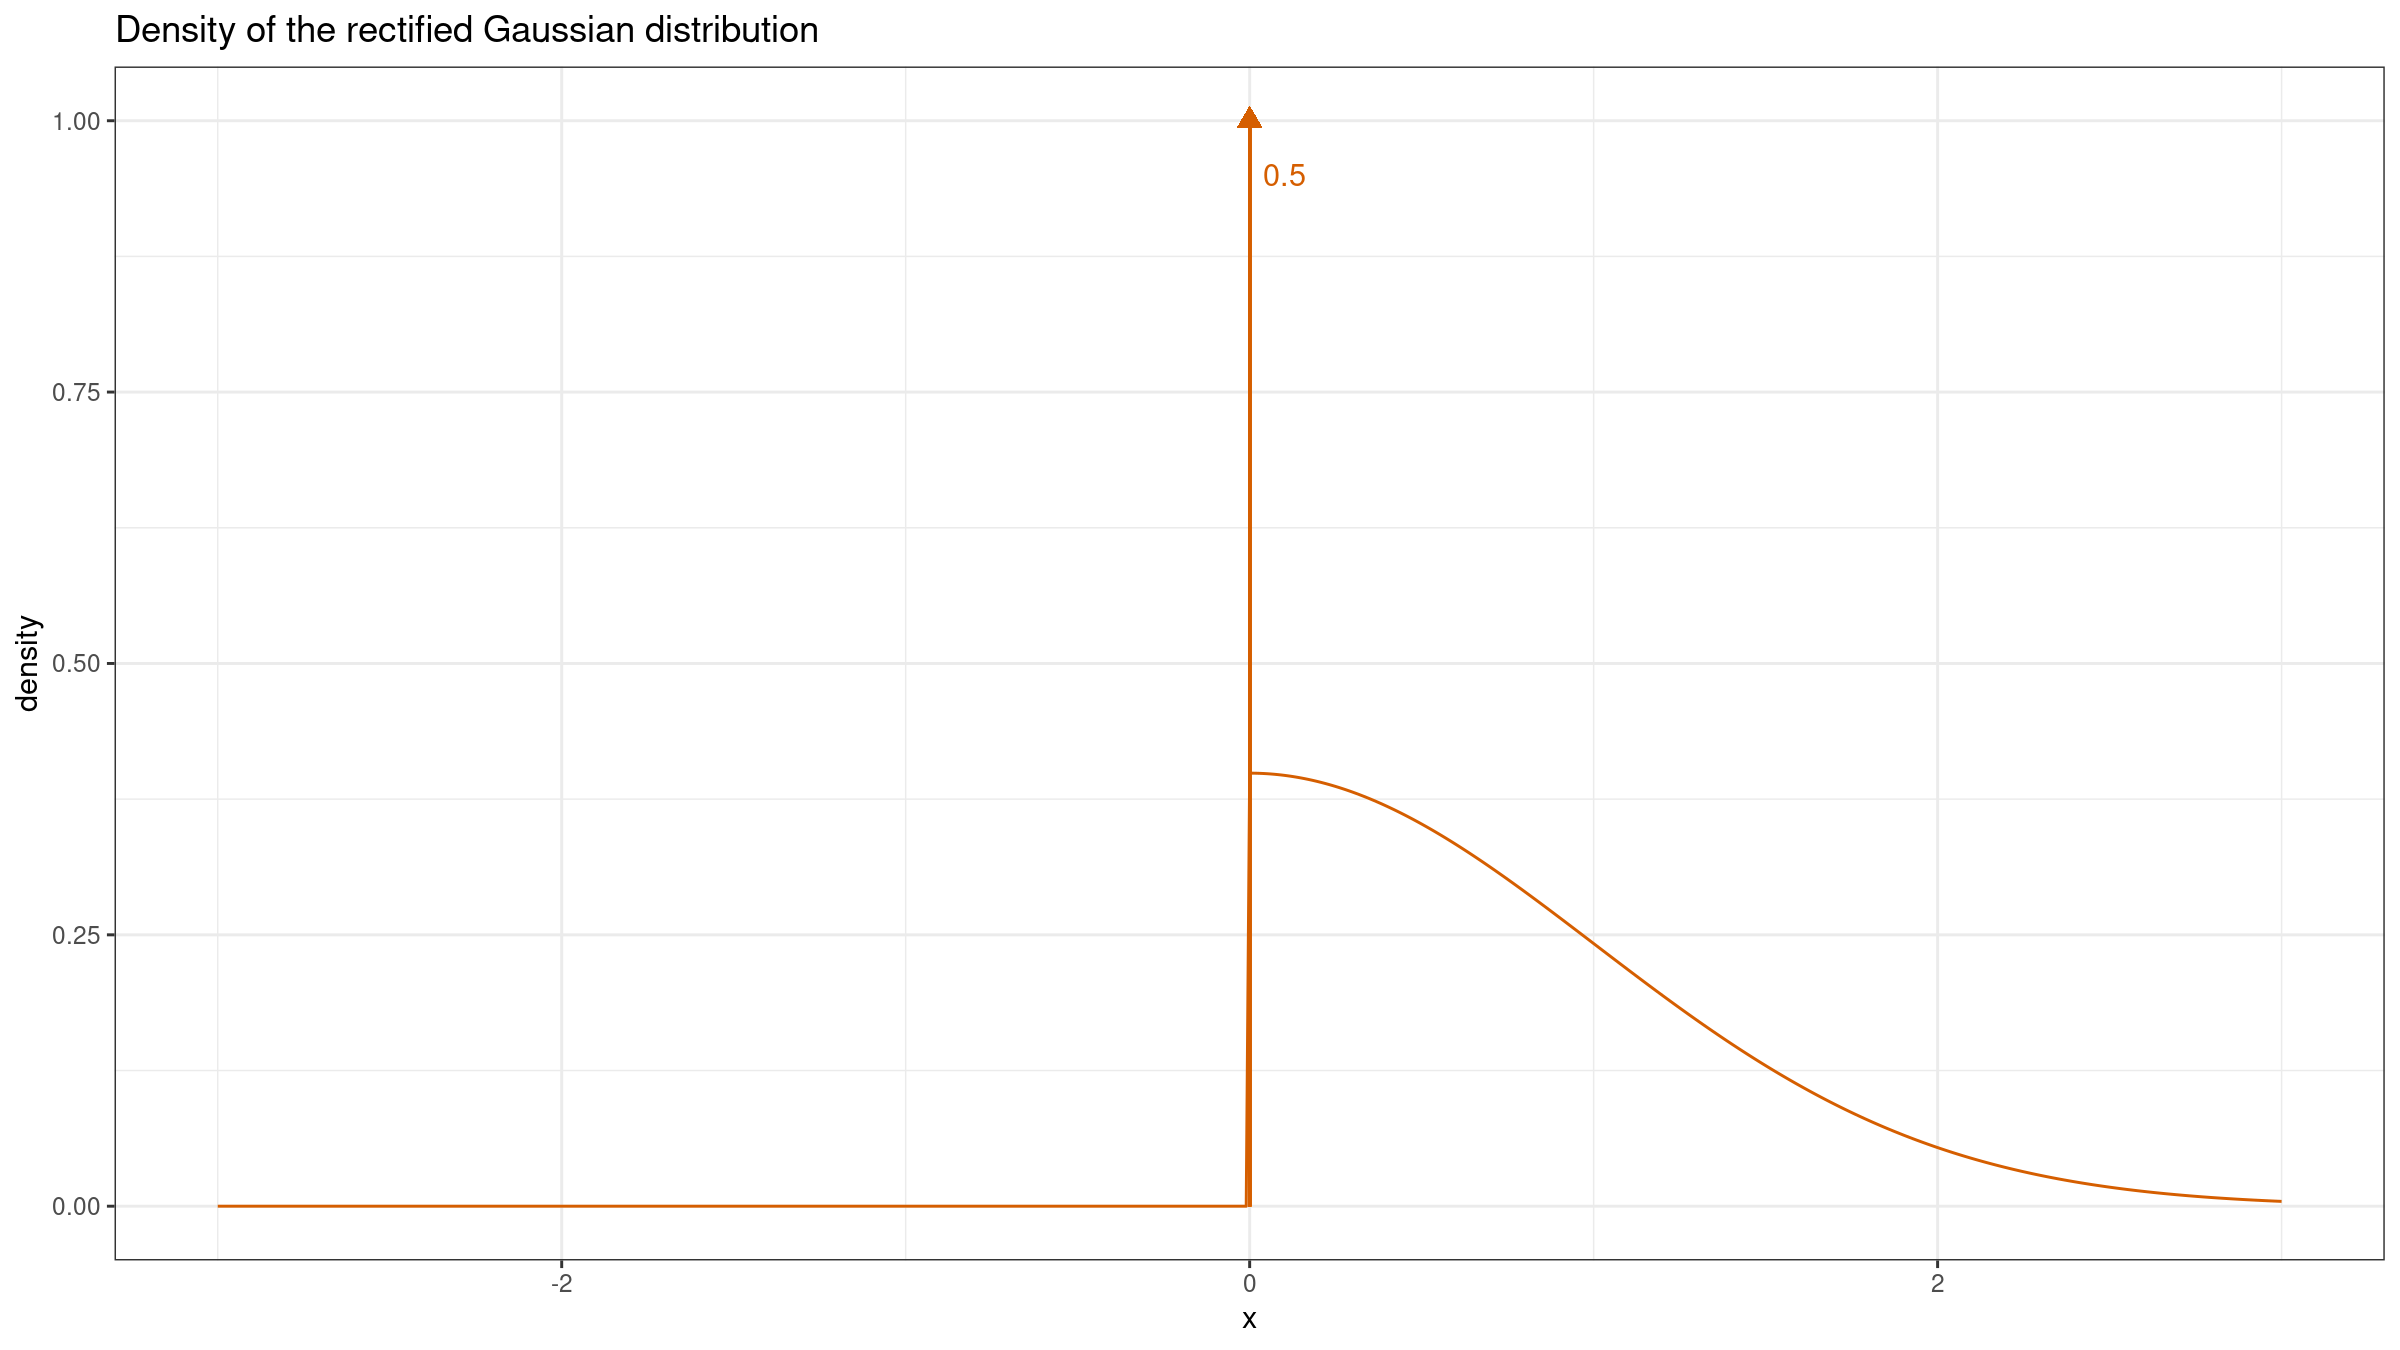
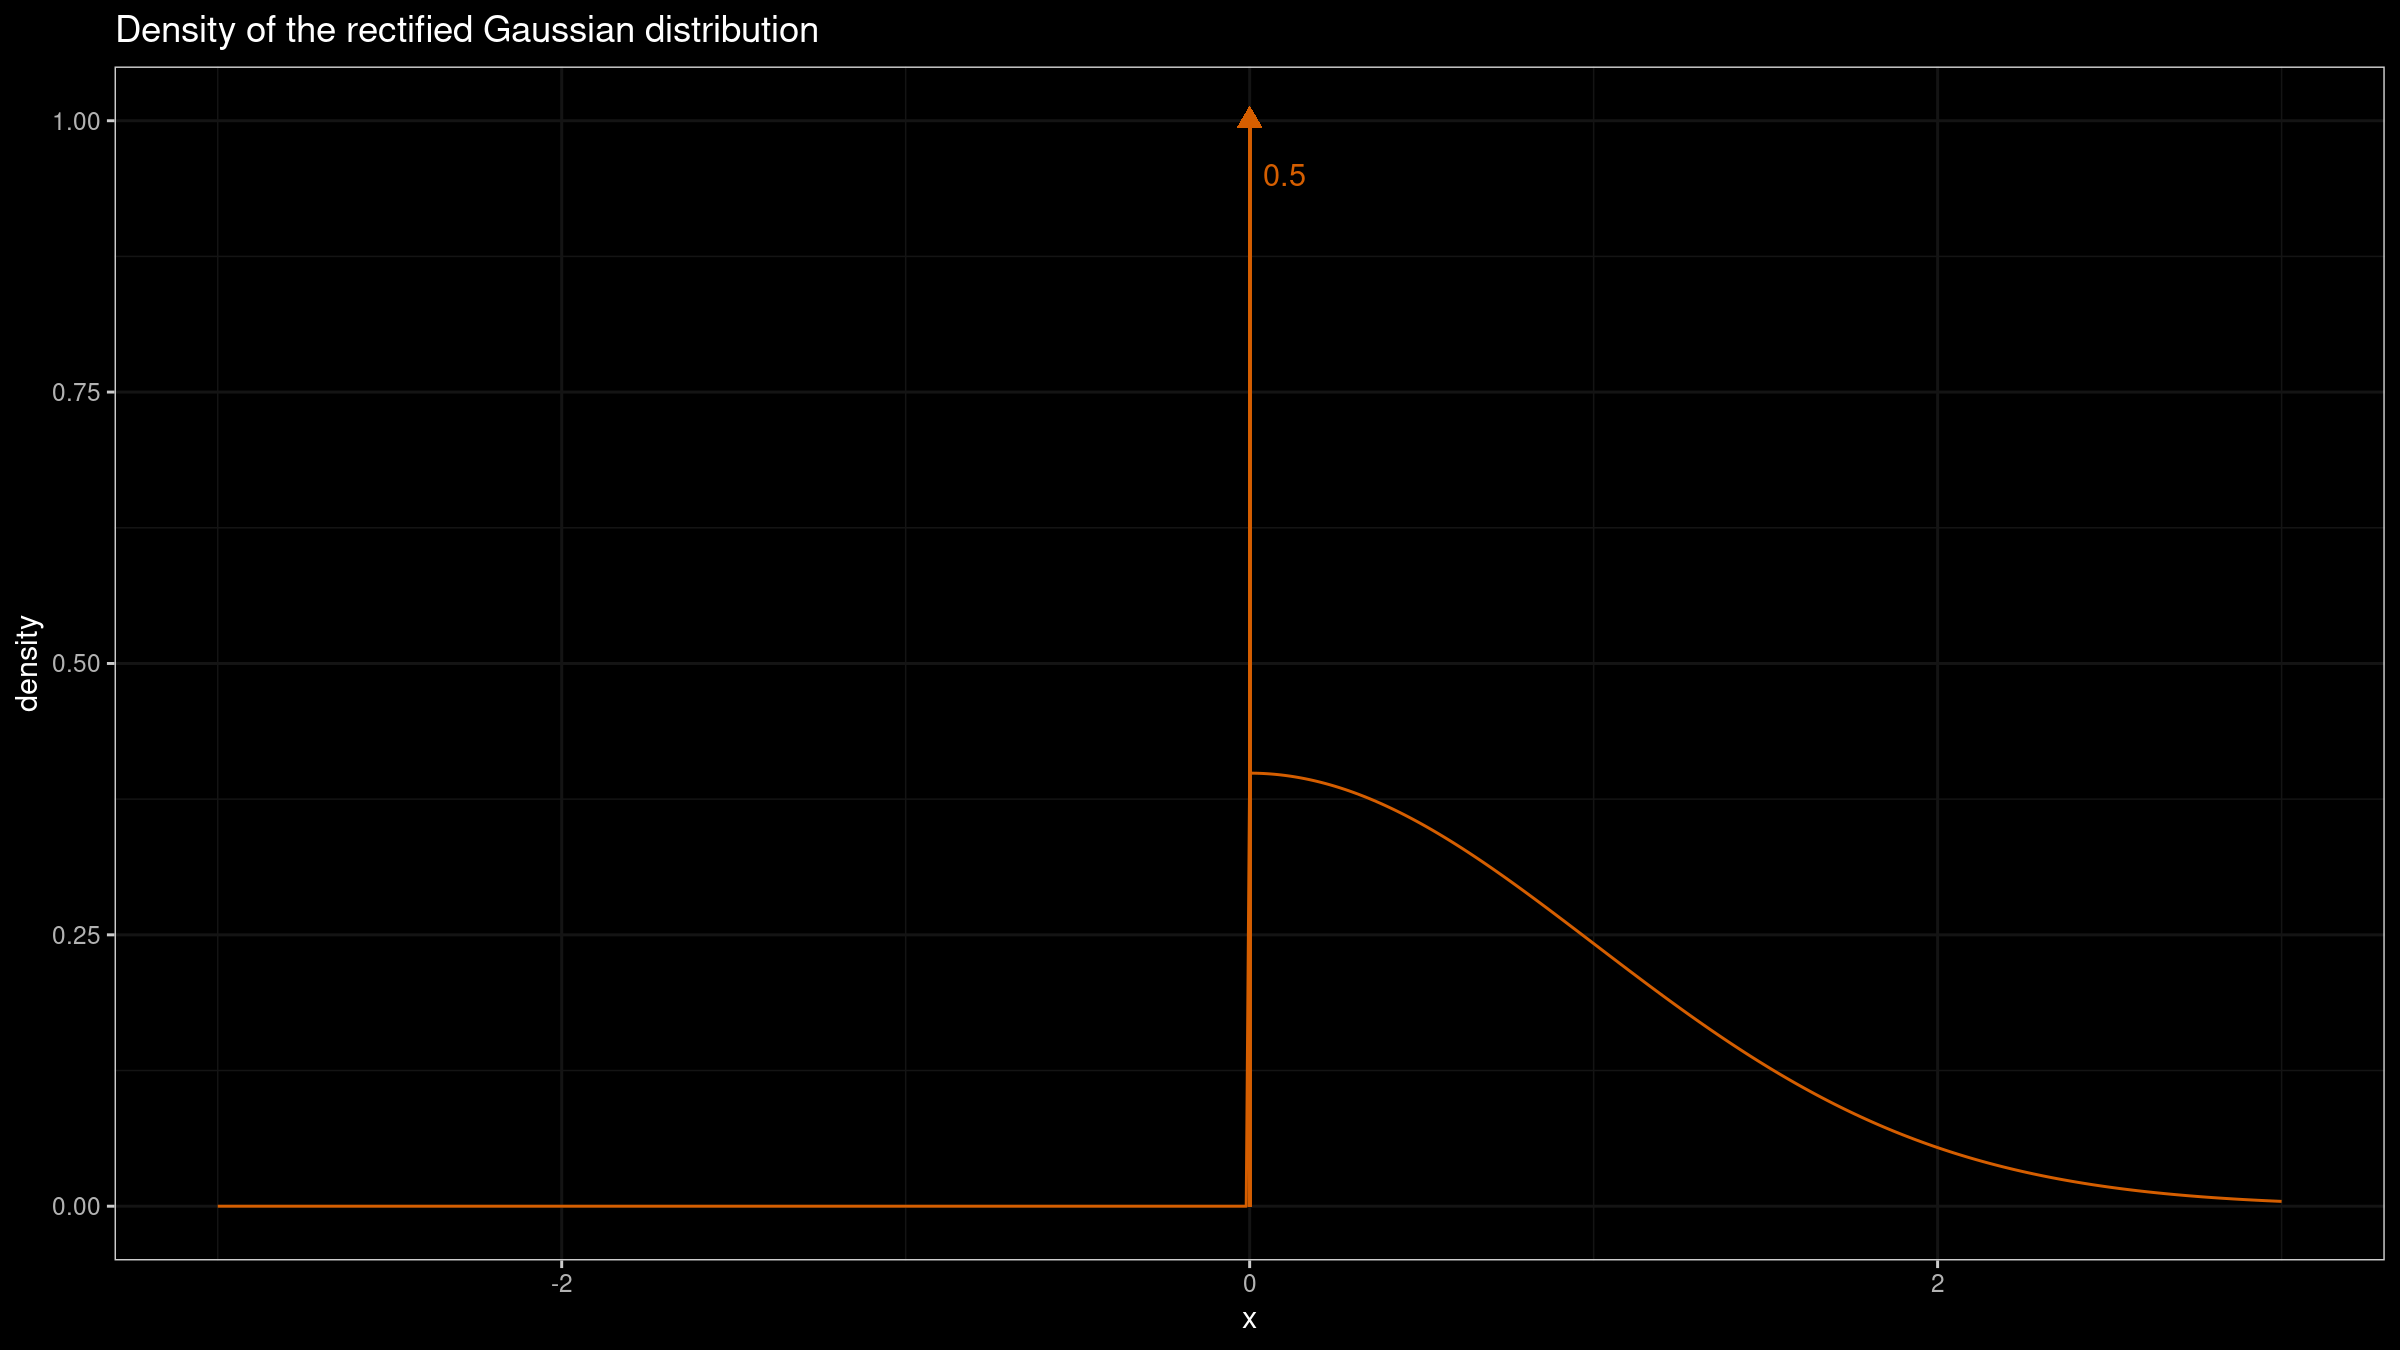
This distribution is a mixture of a discrete one (the Dirac delta function $\delta(0)$) and a continuous one (the “right part” of the normal distribution) with equal weights. Such cases often arise in real life when we have common “border” values across sampling data.
Here is the corresponding sampling distribution:
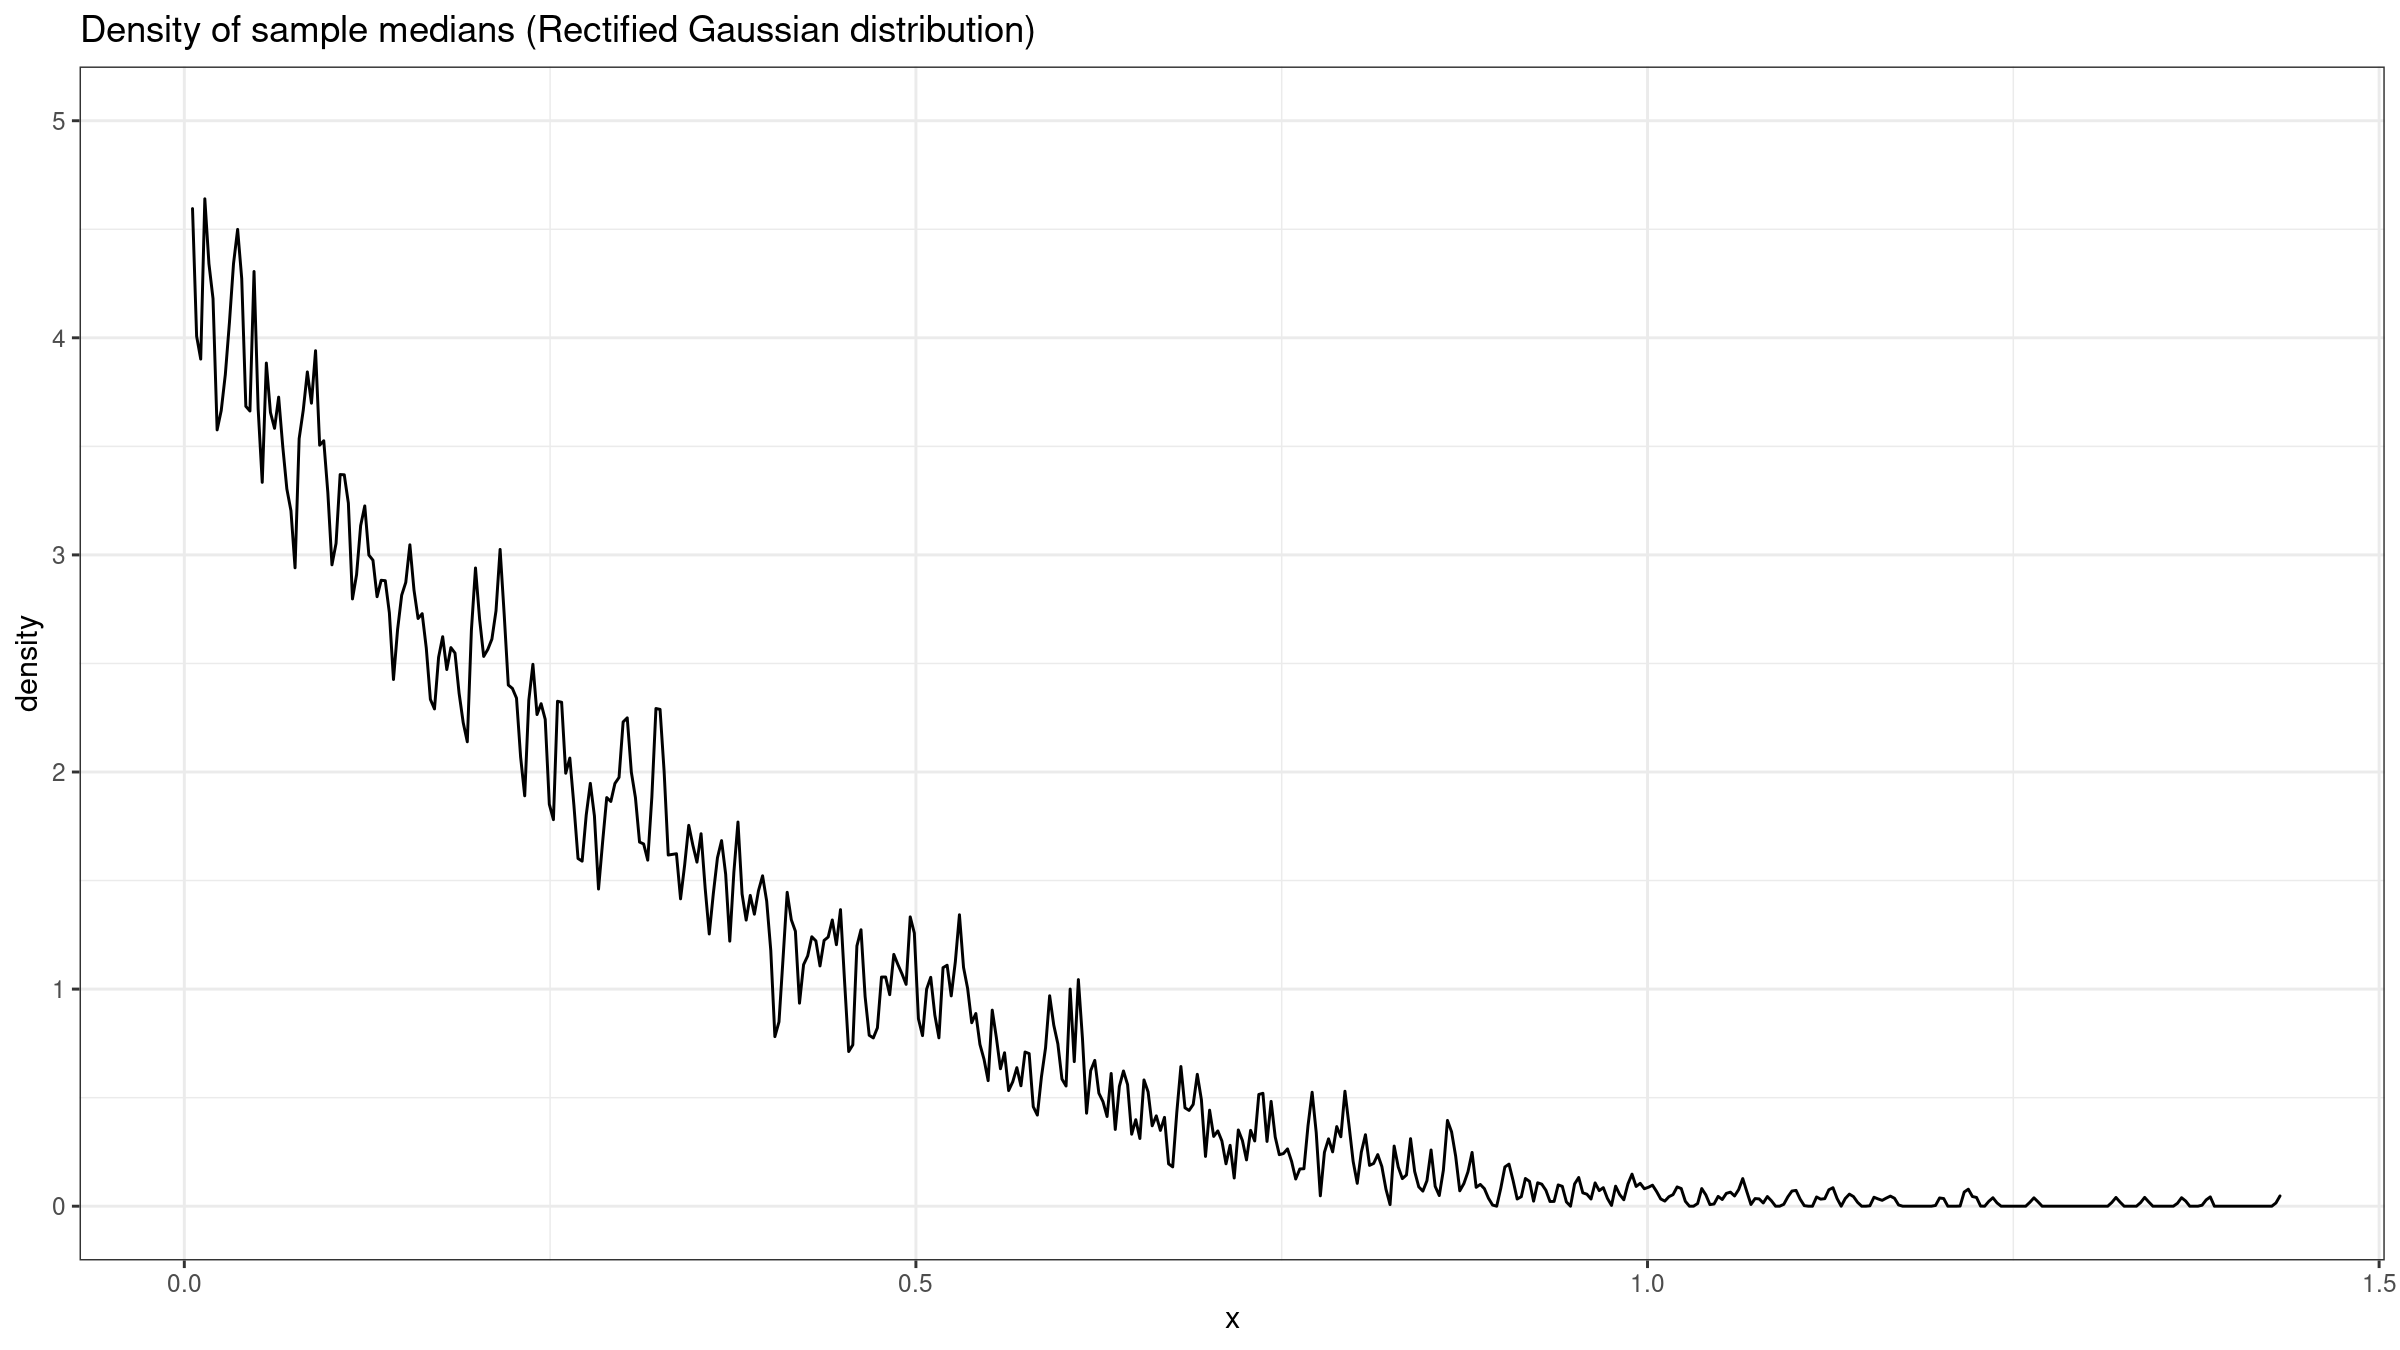
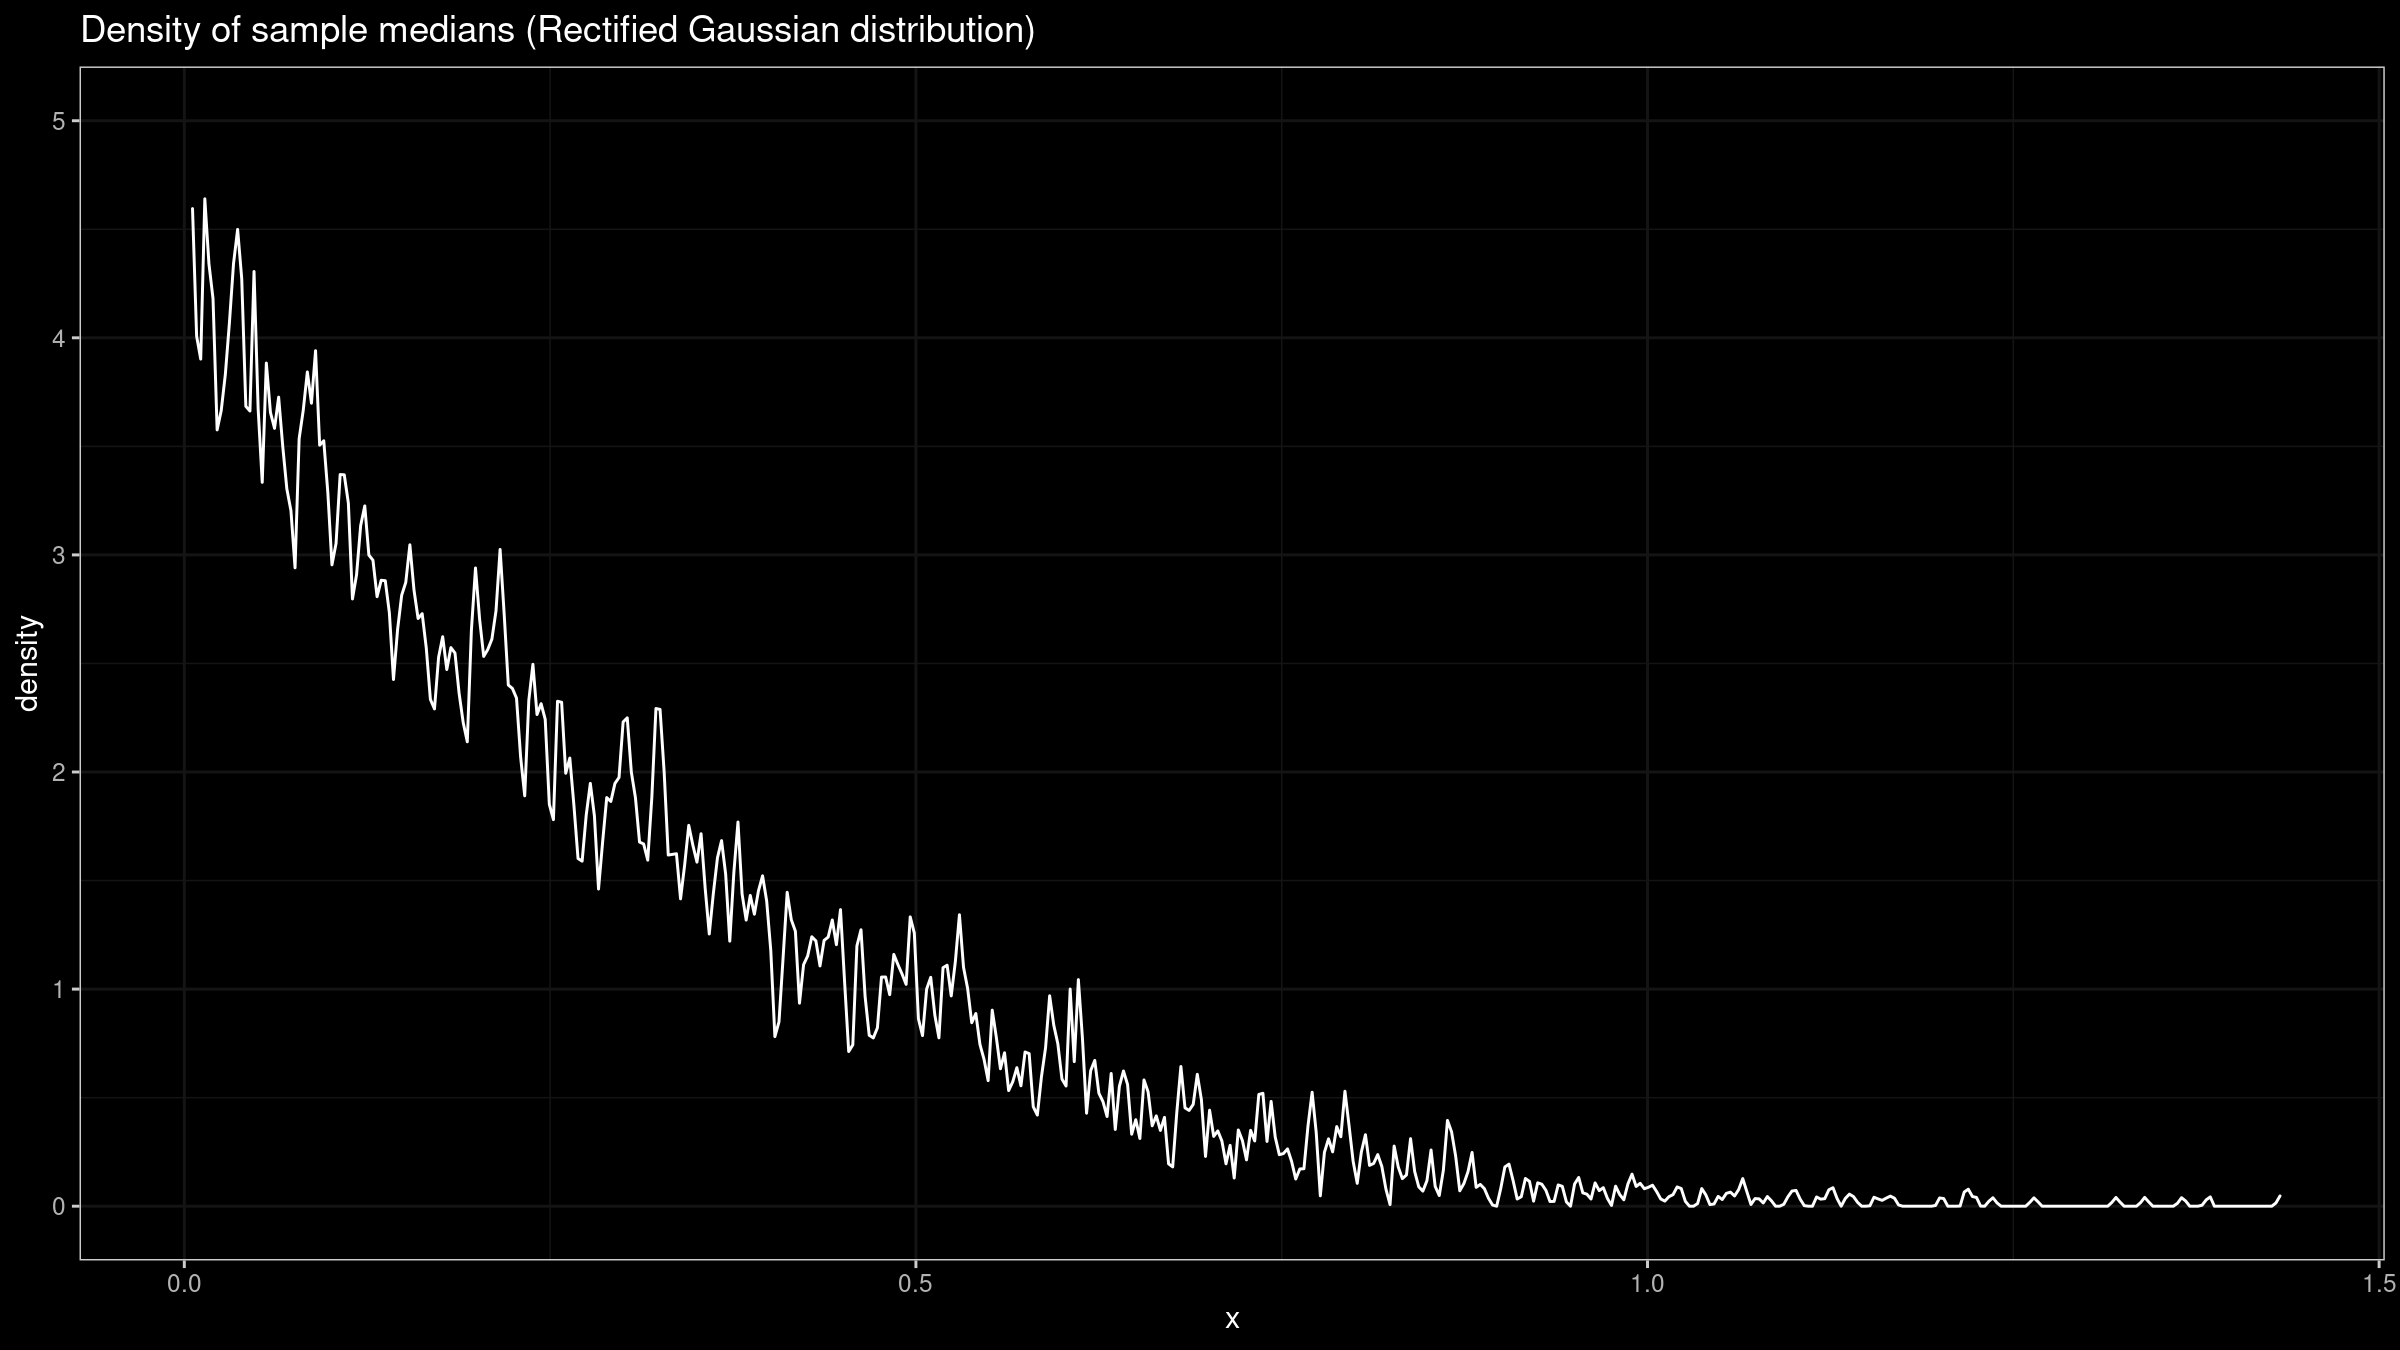
It definitely doesn’t look like a normal one.
Conclusion
Asymptotical models could be useful in statistical analysis when we are sure that external conditions allow getting a picture that is close enough to the theoretical one. Without careful analysis of these conditions, we couldn’t apply the asymptotical model in the general case. As we can see, a mindless usage of the normal model for the median sampling distribution could bring a lot of trouble in corner cases.