Reflecting on performance testing
Performance is an important feature for many projects. Unfortunately, it’s an all too common situation when a developer accidentally spoils the performance adding some new code. After a series of such incidents, people often start to think about performance regression testing.
As developers, we write unit tests all the time. These tests check that our business logic work as designed and that new features don’t break existing code. It looks like a good idea to write some perf tests as well, which will verify that we don’t have any performance regressions.
Turns out this is harder than it sounds. A lot of developers don’t write perf tests at all. Some teams write perf tests, but almost all of them use their own infrastructure for analysis (which is not a bad thing in general because it’s usually designed for specific projects and requirements). There are a lot of books about test-driven development (TDD), but there are no books about performance-driven development (PDD). There are well-known libraries for unit-testing (like xUnit/NUnit/MSTest for .NET), but there are almost no libraries for performance regression testing. Yeah, of course, there are some libraries which you can use. But there are troubles with well-known all recognized libraries, approaches, and tools. Ask your colleagues about it: some of them will give you different answers, the rest of them will start Googling it.
There is no common understanding of what performance testing should look like. This situation exists because it’s really hard to develop a solution which solves all problems for all kind of projects. However, it doesn’t mean that we shouldn’t try. And we should try, we should share our experience and discuss best practices.
Probably some of you know that I’m the maintainer of BenchmarkDotNet (a popular .NET library for benchmarking). It was designed as a library for benchmarking (especially for microbenchmarking), but not for regression testing. However, more and more people ask how they can use it as a part of continues integration systems. And it’s a good idea to have a way to automatically prevent performance degradations. Unfortunately, it’s not enough to just run code several times and collect some statistics (and other typical benchmarking stuff). There are a lot of additional challenges which should be solved before I can recommend this library for perf tests.
At JetBrains, I’m working on Rider. It’s a cool cross-platform .NET IDE which is based on the IntelliJ platform and ReSharper. It’s a huge product with millions of lines of code and a crazy performance space. Rider should be super-responsive and fast on any OS — performance is one of our best features. It’s so easy to write some code which spoils this for some people, and it’s so hard to check it manually every time. We already have some simple performance tests, but we feel like it’s not enough. Right now I’m working on a new workflow for regression analysis and monitoring. This system is not ready yet, but it already helped in finding some interesting performance anomalies. However, I don’t want to write another tool which can be used only for one project. It would be nice to write a tool (and open source it) which can be easily adapted for a wide range of different projects.
I write this post because I want to get some feedback. I’m going to briefly describe some basic problems of performance regression testing and suggest some points of discussion. I would like to hear any kind of information about performance regression testing. Do you practice it? What kind of problems do you have? How you solve it? What kind of tools and approaches do you use?
Ok, let’s start a discussion with a short list of typical issues which can destroy all the fun of performance testing.
Problems
Let’s say we write a program which prints a number which somehow describes performance of our system. It doesn’t matter whether it is a super-reliable benchmark with many repetitions or a simple “let’s take a few timestamps” approach. The main point here is we have a program which provides a perf number (or a set of numbers), and we are completely satisfied with it. Is our performance test ready when we have such number? No! We even didn’t start to talk about testing.
Type I and Type II errors
The main point of performance testing (and any other kind of testing) is that it should be automatic. We should be automatically notified if we have any kind of performance degradation. The question then is: how should we define a performance degradation? At this point, many developers start to read about confidence intervals, statistics tests, p-values, and so on. Sometimes I hear sentences like “The probability of performance degradation is 80%.” This doesn’t make any sense! You have a degradation, or you don’t have a degradation. Otherwise, you have problems with your definition of a degradation. You can’t say to a developer something like “you must investigate this problem with 80% probability.” The outcome of your checking system should be binary. And here we should talk about Type I and type II errors. Sometimes you will be notified about problems, but there aren’t any problems. When developers get a lot of such false alarms, they start to ignore it, and the whole idea stops making sense and loses value. Sometimes, there are some critical performance problems, but you will not be notified. In this case, you can miss the degradation and deploy a slow version of your software (the whole idea does not work).
We should implement such checking system which minimizes both kinds of errors. Very often this a project-specific and a team-specific problem. It’s impossible to write one set of conditions which makes everyone happy. But we can try to create presets which help to quickly choose a good solution for your business requirements.
Small amount of data
In theory, we can do as many iterations as we like. It allows getting a huge data sets, apply some statistical magic, calculate all possible statistical characteristics, and answer all our question include the ultimate question of life, the universe, and everything. In practice, performance data is expensive. We pay for it by the time of our CI server and the time of developers which should wait for the results. Some of the performance tests (especially integration tests) could take minutes or even hours. It would be nice to get the sample size N=1000, but sometimes our N is 3..5 or even 1. A single measurement (+plus some historical data), no information about the distribution, but we still have to answer: do we have a performance degradation or not?
Tricky distributions
Even if we have enough data about the performance distributions, this distribution usually looks strange. Don’t expect to see a lot of normal distributions, when you are working with performance. Here are typical problems which you can get:
- Huge standard deviation: the difference between sequential measurements (for the same codebase) can be huge
- Outliers: sometimes you get extremely high durations because of some unknown reasons (especially if you have many I/O or network operation; or just have another heavy processes on the same build agent).
- Multimodal distribution: a distribution can have several local maximums and you can’t control which mode will be “activated” in each measurement
Here is some historical data about duration of a single test from Rider:
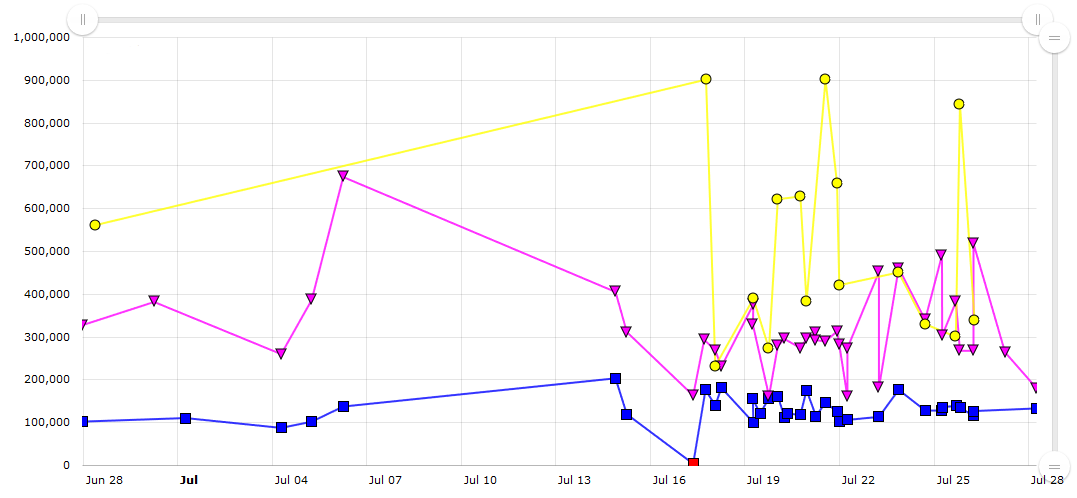
The blue points denote Windows, the purple denote Linux, the yellow denote MacOS.
On the Y axis, you can see the amount of milliseconds.
Yes, two sequential measurements can be 100 seconds and 900 seconds.
It’s a normal situation for an integration test.
(To be honest, it’s one of the worst our tests, everything is not so bad in general.)
And yes, I know that’s it’s not a good performance test, I know what should be improved here, and so on.
I don’t want to discuss how it happens (it’s a topic for another post), I just want to show what real performance data can look like.
What happens if we make a mistake and wrote Thread.Sleep(20 * 1000) somewhere?
Nothing!
No one will notice it (on this test at least).
So, we should understand what our performance data looks like and understand what kind of checks we can apply in each situation.
Different hardware and many environments
As you probably noticed on the previous image, the performance on different operating systems is different. The easiest thing to say here is something like “Well, nothing special in this picture, .NET works well only on Windows”. Here is another image for you:
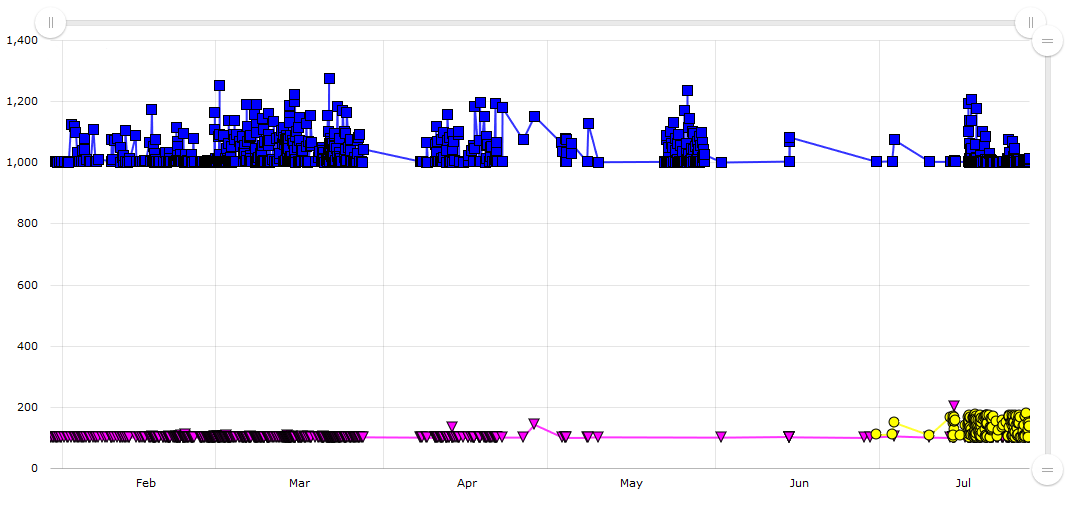
In this test, Linux takes around 100ms all the time, MacOS takes 100—200ms, Windows takes 1000-1200ms. Why? That’s also a topic for another post (a hint: this test is socket-related). The point here is we have different performance configurations on different tests. And we can’t mix measurements from different operation systems (in general). There are a lot of other parameters which can be considered. For example, some of the build agents have an HDD, and some of them have an SSD which definitely affects all I/O bound tests. Some of the build agents can have a small amount of RAM which can affect tests with massive memory traffic. In general, we can’t compare absolute numbers from different machines if there are any differences in hardware configuration. Even minor differences in the CPU model can play a vital role. Sometimes, it’s possible to analyze relative performance, but it’s not always an option.
It’s great if you can buy several dedicated machines which will execute performance tests 24/7. (And if you can replace broken perf machines with machines that have exactly the same configuration.) However, it’s another trade-off question: how many tests do you want to run, how many times do you want to repeat them, how long does it take, how many performance machines can you afford?
Microbenchmarks vs. integration benchmarks
As I mentioned before, BenchmarkDotNet is designed for microbenchmarks. It can measure a method even if it takes a few nanoseconds. It not easy, but BenchmarkDotNet protects you from even super-tiny performance deviations. For this purpose, it generates a separate project where it invokes the method billions of times.
But here is another situation.
Let’s say we write Rider, and we want to measure how much does it take to debug a unit-test in a .NET Core project.
How many processes do we need?
Let’s count.
We need a process for the IntelliJ IDEA platform (aka frontend), a process for the ReSharper host (aka backend).
Because of some infrastructure reasons,
we start tests on the frontend (we write it on Kotlin and run it on JVM),
but the benchmarking logic which should control the experiment is written in C#.
So, we have to add a process for the BenchmarkDotNet host (yeah, I want to support some kind of distributed benchmarks).
Next, we should load the project model with the help of MSBuild (another process for MSBuild),
discover tests with one dotnet process,
run tests with another dotnet process,
and attach to it from a DebuggerWorker process.
Thus, our small integration benchmark involves 7 processes.
There now are huge amount of cases where we can’t get super-precision
(because of cross-process interaction, 3rd logic, etc.),
so standard deviation will be huge.
The total duration is several dozens of seconds, so we can’t repeat it a billion times.
Because we are limited in time and have large variance,
we can’t get a tiny confidence interval,
and it’s hard to detect a small performance regression.
Another important point: if we write a tool for performance testing, we should keep in mind that there are too many different cases and we can’t cover all of them with a single approach. At a minum, we need different approaches for microbenchmarsk and for macrobenchmarks, for single methods and for complicated integrated scenarios.
Perfect place for performance analysis
How, where, and when we should do the performance analysis? It’s also a hard question, and it depends on the situation. I can share my experience in Rider. We have 3 places for performance analysis:
- Each build. A small set of tests which are running on each build. Pros: commits with perf problems will not be merged into the master branch. Cons: We should run all the tests quickly, so we can’t run a lot of them. We can’t do many iterations, so data is small. Only huge degradation can be detected (like 1 second -> 15 seconds, it happens).
- Daily tests. A big set of tests which are running one time per day on dedicated machines. Pros: we can do a lot of iterations, we can analyze historical data, we can detect even small performance problems. Cons: we will know about a problem only after it’s merged into master.
- Retrospective analysis. A special system which analyzes all collected performance data from all build agents. Pros: we have a huge data set, we can run a lot of cool analysis, we can detect problems which were not detected by first two options. Cons: we will not know about a problem, unless it’s too late (sometimes a week after a bad commit).
We continue to develop these ways and think about what else we can do. Of course, you may have own way to analyze the performance (and I will be happy to hear about it).
One big degradation vs. many small degradations.
Ok, let’s say we solved all of the previous problems. Let’s also say that our test takes 10–15 seconds and the build is green if the total time is less than 20 seconds. We are interested only in huge performance degradation (5 seconds or more), so it should work well, and the big variance is not a problem for us anymore. Next, Developer1 adds a new feature which takes 1 second. It’s a very good feature, the test takes 11–16 seconds which is fine, the build is green, everyone is happy. Next, Developer2 adds another awesome feature which also takes 1 second. Now test takes 12–17 seconds which also is fine.
After another 4 iterations, the test will take 16–21 seconds and become flaky: it will fail the build sometimes. After another iteration, the test will take 17–22 seconds and become more flaky. Developers will be angry because even a very simple typo fix can’t be merged because some tests with strange names are suddenly red.
Technical issues vs. management issues
Here we meet another problem: what should we do if our super-system has detected some performance problems? Especially if there are 10 developers, who are responsible for problems with performance. Especially if all the implemented features are super useful, you can’t drop it, you don’t know how to optimize it, but you want to keep the good level of performance. While you are thinking, the developers suffer because tests are flaky and it slows down the development process.
One day you decided that you are ready for this trade-off and you increase the timeout. Then someone asks you: “So, we can change timeouts in such situations, yeah?” Next, you will get a situation where every performance problem will be solved via increased timeouts without further investigation.
Even if you have a perfect performance regression tests, they can be useless, if you don’t have the performance culture in your company. You should solve it somehow: find very responsible developers, assign special people for performance investigation, and so on. If you are going to write performance tests, you should think about such things in advance.
Points of discussion
I named only a few main problems, there are too many of them. I know how to solve some of them, but I don’t know what I can do with others. I’m going to continue my research, implement best practices in BenchmarkDotNet, and share final results. I would be really happy to hear any feedback from you. How do you analyze performance? How do you avoid performance degradation? How do you solve management issues and find trade-offs between new features and performance? What kind of other problems do you have which should be solved in a good performance testing library?