Finite-sample efficiency of the Rousseeuw-Croux estimators
The Rousseeuw-Croux $S_n$ and $Q_n$ estimators are robust and efficient measures of scale. Their breakdown points are equal to $0.5$ which is also the breakdown point of the median absolute deviation (MAD). However, their statistical efficiency values are much better than the efficiency of MAD. To be specific, the MAD asymptotic relative Gaussian efficiency against the standard deviation is about $37\%$, whereas the corresponding values for $S_n$ and $Q_n$ are $58\%$ and $82\%$ respectively. Although these numbers are quite impressive, they are only asymptotic values. In practice, we work with finite samples. And the finite-sample efficiency could be much lower than the asymptotic one. In this post, we perform a simulation study in order to obtain the actual finite-sample efficiency values for these two estimators.
Introduction
The $S_n$ and $Q_n$ estimators are presented in Alternatives to the Median Absolute Deviation
By Peter J Rousseeuw, Christophe Croux
·
1993rousseeuw1993.
For a sample $x = \{ x_1, x_2, \ldots, x_n \}$, they are defined as follows:
where
- $\operatorname{lowmed}$ is the $\lfloor (n+1) / 2 \rfloor^\textrm{th}$ order statistic out of $n$ numbers,
- $\operatorname{highmed}$ is the $(\lfloor n / 2 \rfloor + 1)^\textrm{th}$ order statistic out of $n$ numbers,
- $c_n$, $d_n$ are bias-correction factors for finite samples (some approximation can be found in [Rousseeuw1993]),
- $k = \binom{\lfloor n / 2 \rfloor + 1}{2}$,
- ${}_{(k)}$ is the $k^\textrm{th}$ order statistic.
In this post, we also use the unbiased standard deviation which is defined as follows:
$$ s_n = \sqrt{\frac{1}{n} \sum_{i=1}^n (x_i - \bar{x})^2} \bigg/ c_4(n), \quad c_4(n) = \sqrt{\frac{2}{n-1}}\frac{\Gamma(\frac{n}{2})}{\Gamma(\frac{n-1}{2})}. $$The median absolute deviation uses the bias-correction factors presented in [Akinshin2022].
Relative efficiency
In order to evaluate the relative statistical efficiency against the standard deviation under normality, we perform the following simulation study:
- Enumerate various sample sizes $n$ between $3$ and $200$.
- For each sample size $n$, generate $300\,000$ random samples from the standard normal distribution.
- For each sample, estimate $s_n$, $\operatorname{MAD}_n$, $S_n$, $Q_n$.
- For each $n$, calculate the relative statistical efficiency of $\operatorname{MAD}_n$, $S_n$, $Q_n$ against $s_n$ as $e(T_n) = \mathbb{V}(s_n) / \mathbb{V}(T_n)$.
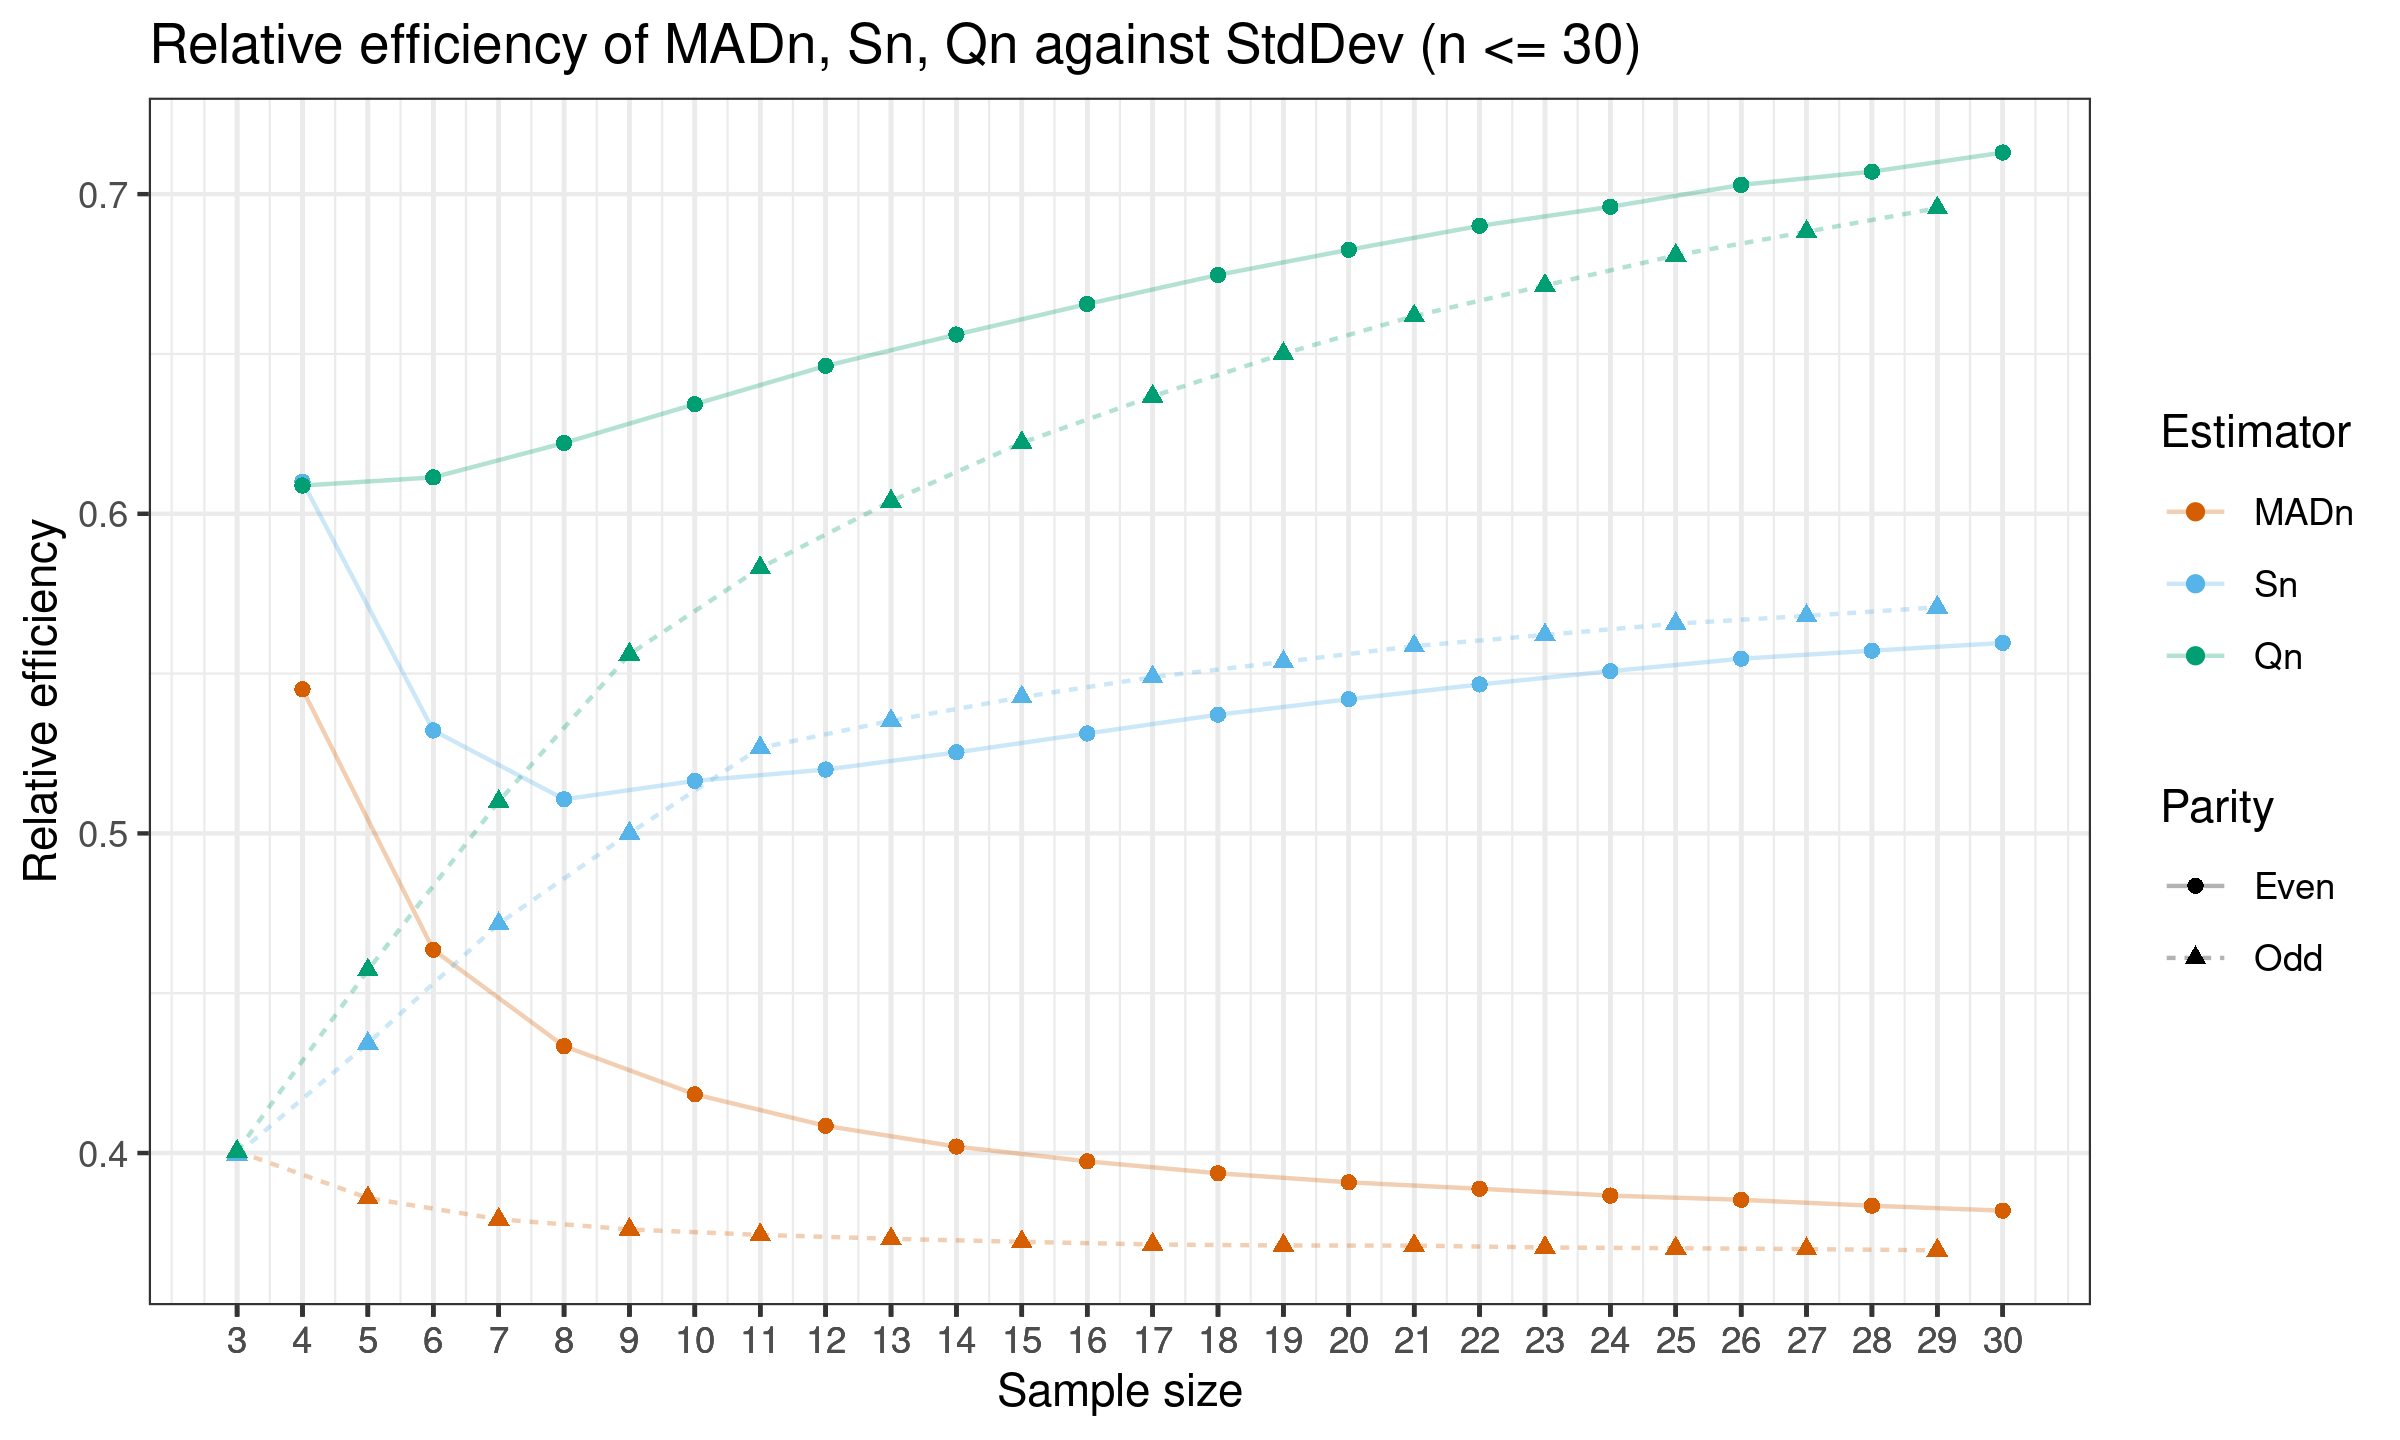
Here is the plot with results for $n \leq 30$:
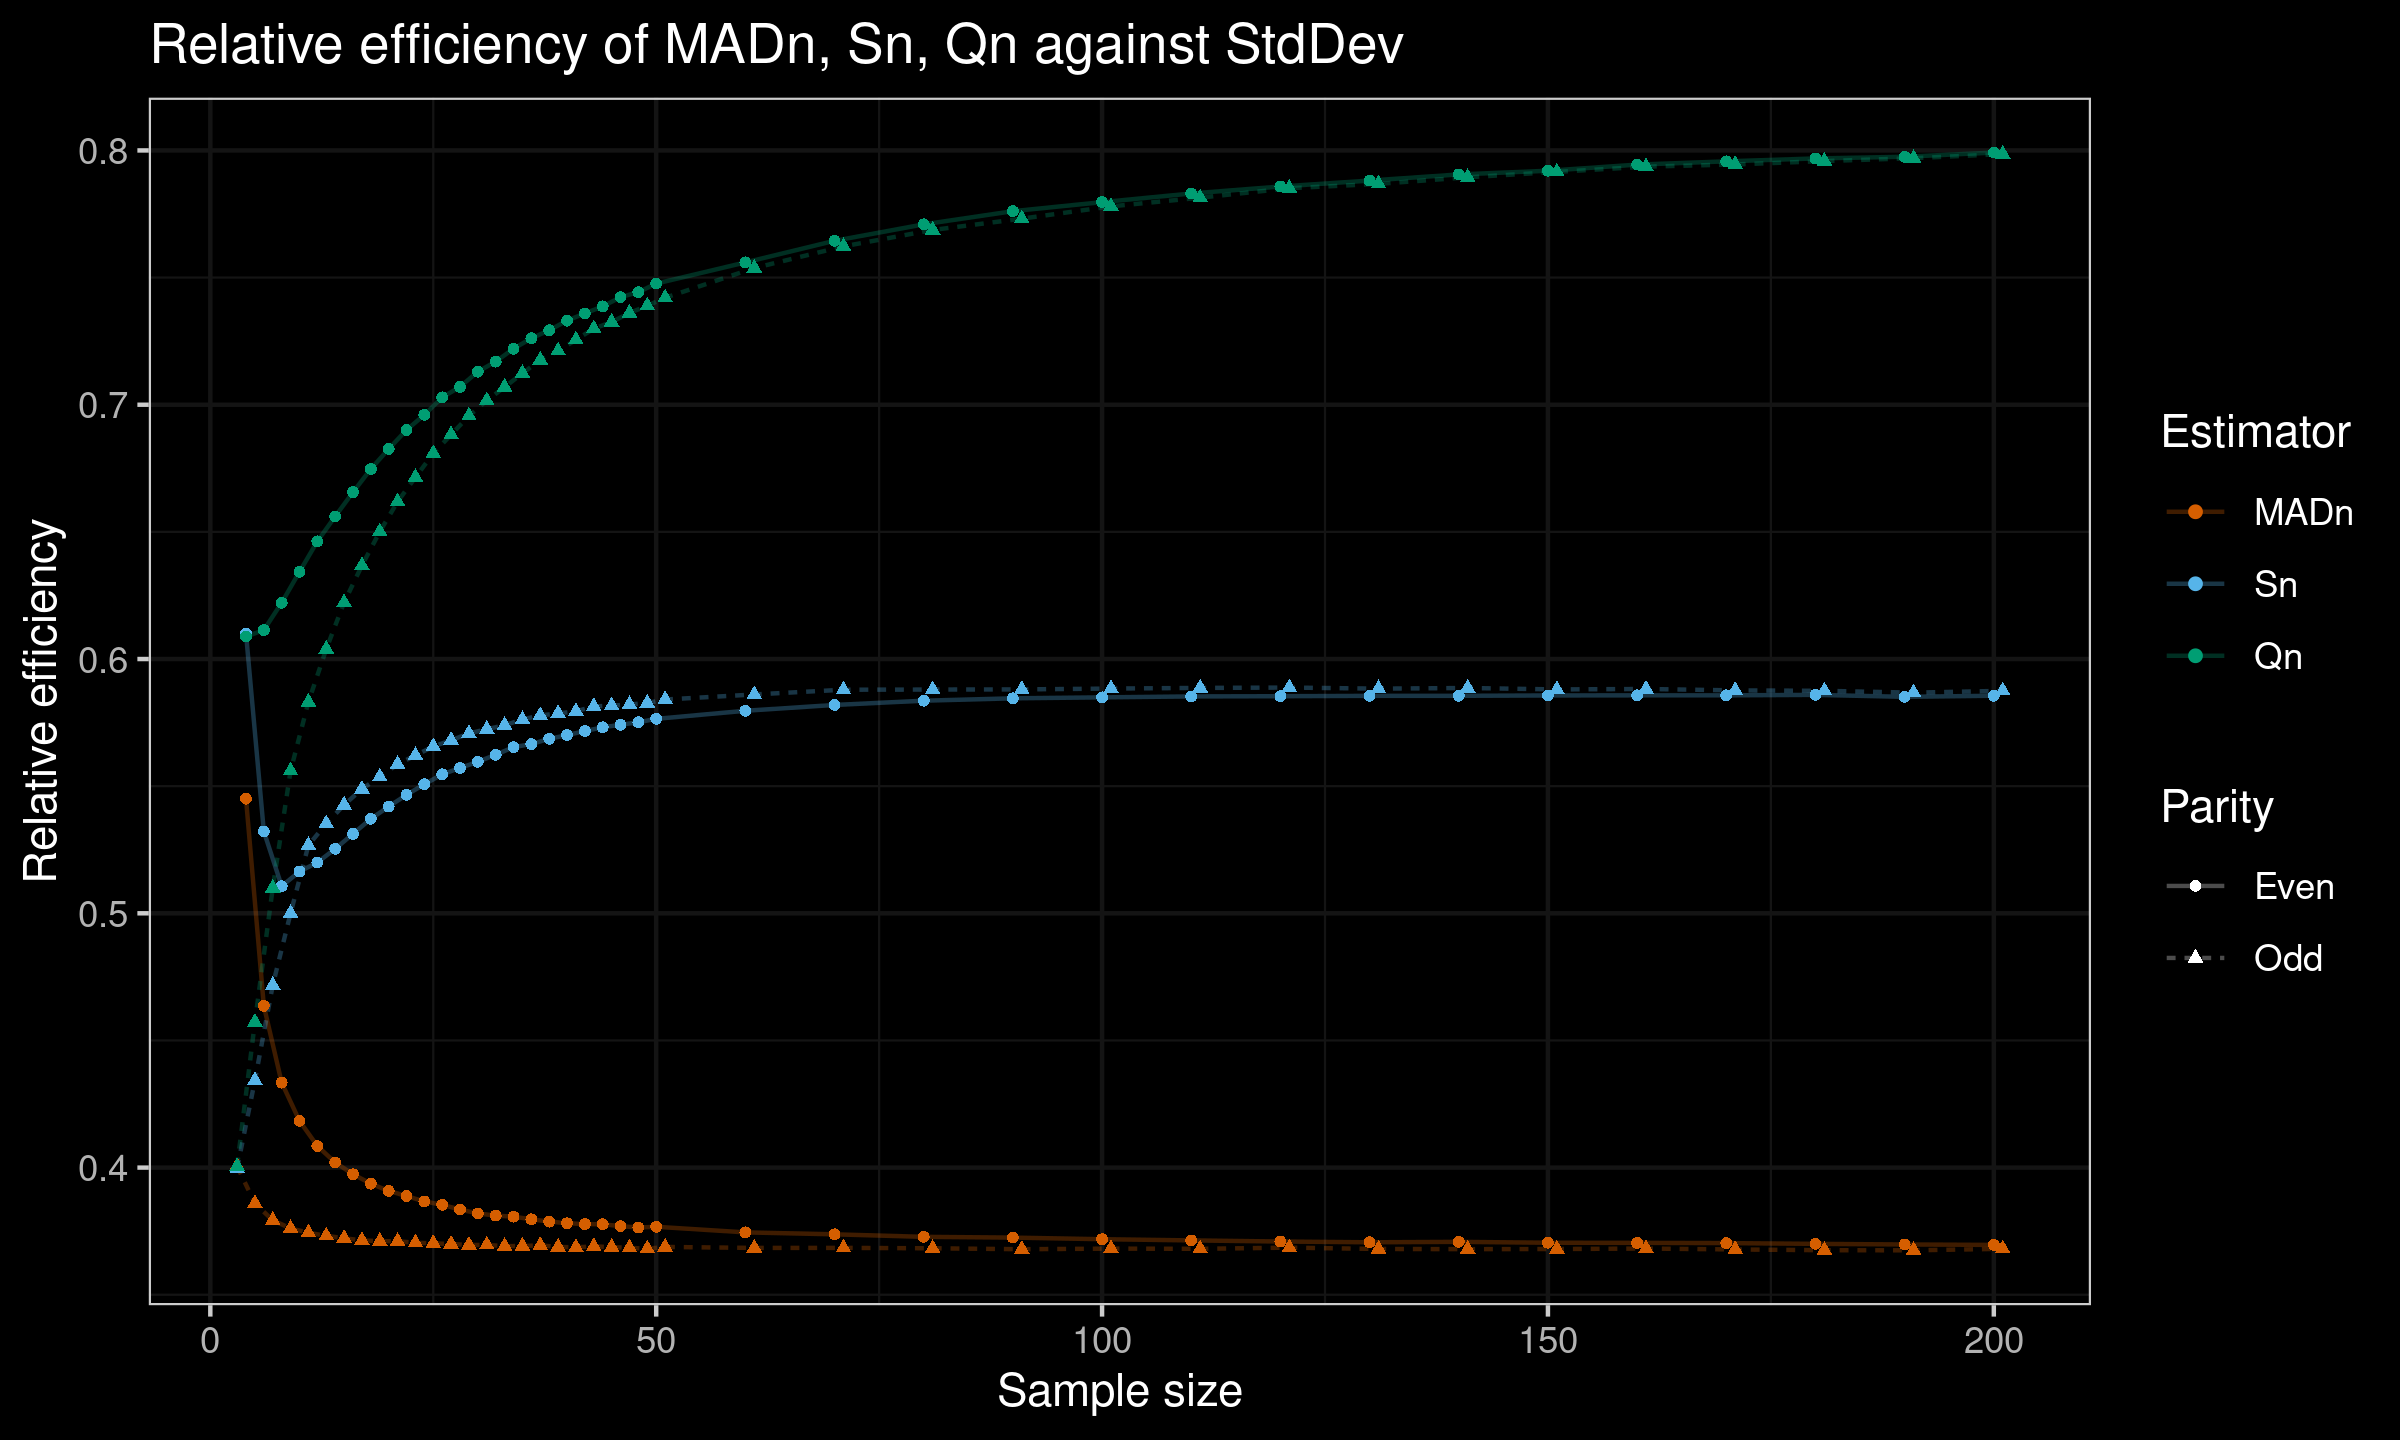
Here is the plot with all the results:

And here is a table with raw results:
| n | MADn | Sn | Qn |
|---|---|---|---|
| 3 | 0.40056 | 0.39961 | 0.40050 |
| 4 | 0.54508 | 0.61005 | 0.60883 |
| 5 | 0.38591 | 0.43430 | 0.45723 |
| 6 | 0.46360 | 0.53221 | 0.61139 |
| 7 | 0.37928 | 0.47172 | 0.50996 |
| 8 | 0.43342 | 0.51068 | 0.62214 |
| 9 | 0.37609 | 0.50004 | 0.55606 |
| 10 | 0.41836 | 0.51644 | 0.63429 |
| 11 | 0.37439 | 0.52677 | 0.58308 |
| 12 | 0.40849 | 0.51998 | 0.64626 |
| 13 | 0.37316 | 0.53525 | 0.60392 |
| 14 | 0.40201 | 0.52536 | 0.65607 |
| 15 | 0.37222 | 0.54263 | 0.62221 |
| 16 | 0.39739 | 0.53126 | 0.66562 |
| 17 | 0.37139 | 0.54889 | 0.63675 |
| 18 | 0.39366 | 0.53715 | 0.67473 |
| 19 | 0.37107 | 0.55365 | 0.65006 |
| 20 | 0.39082 | 0.54198 | 0.68261 |
| 21 | 0.37103 | 0.55860 | 0.66187 |
| 22 | 0.38881 | 0.54660 | 0.69007 |
| 23 | 0.37045 | 0.56210 | 0.67145 |
| 24 | 0.38668 | 0.55075 | 0.69604 |
| 25 | 0.37021 | 0.56561 | 0.68085 |
| 26 | 0.38536 | 0.55466 | 0.70290 |
| 27 | 0.36995 | 0.56805 | 0.68823 |
| 28 | 0.38350 | 0.55716 | 0.70705 |
| 29 | 0.36956 | 0.57074 | 0.69561 |
| 30 | 0.38197 | 0.55959 | 0.71301 |
| 31 | 0.36961 | 0.57241 | 0.70165 |
| 32 | 0.38113 | 0.56236 | 0.71696 |
| 33 | 0.36911 | 0.57396 | 0.70695 |
| 34 | 0.38071 | 0.56534 | 0.72204 |
| 35 | 0.36918 | 0.57624 | 0.71234 |
| 36 | 0.37966 | 0.56656 | 0.72613 |
| 37 | 0.36942 | 0.57783 | 0.71760 |
| 38 | 0.37876 | 0.56863 | 0.72929 |
| 39 | 0.36880 | 0.57860 | 0.72118 |
| 40 | 0.37813 | 0.57007 | 0.73307 |
| 41 | 0.36864 | 0.57944 | 0.72553 |
| 42 | 0.37778 | 0.57167 | 0.73592 |
| 43 | 0.36902 | 0.58136 | 0.72991 |
| 44 | 0.37771 | 0.57314 | 0.73867 |
| 45 | 0.36872 | 0.58165 | 0.73254 |
| 46 | 0.37698 | 0.57415 | 0.74231 |
| 47 | 0.36845 | 0.58213 | 0.73608 |
| 48 | 0.37643 | 0.57513 | 0.74428 |
| 49 | 0.36810 | 0.58270 | 0.73894 |
| 50 | 0.37673 | 0.57648 | 0.74764 |
| 51 | 0.36879 | 0.58407 | 0.74207 |
| 60 | 0.37452 | 0.57965 | 0.75597 |
| 61 | 0.36842 | 0.58606 | 0.75376 |
| 70 | 0.37376 | 0.58194 | 0.76447 |
| 71 | 0.36843 | 0.58793 | 0.76228 |
| 80 | 0.37277 | 0.58361 | 0.77094 |
| 81 | 0.36827 | 0.58799 | 0.76872 |
| 90 | 0.37247 | 0.58455 | 0.77612 |
| 91 | 0.36790 | 0.58805 | 0.77317 |
| 100 | 0.37184 | 0.58492 | 0.77968 |
| 101 | 0.36814 | 0.58838 | 0.77800 |
| 110 | 0.37137 | 0.58529 | 0.78308 |
| 111 | 0.36806 | 0.58864 | 0.78142 |
| 120 | 0.37093 | 0.58538 | 0.78582 |
| 121 | 0.36853 | 0.58878 | 0.78514 |
| 130 | 0.37063 | 0.58551 | 0.78816 |
| 131 | 0.36800 | 0.58835 | 0.78685 |
| 140 | 0.37080 | 0.58553 | 0.79057 |
| 141 | 0.36793 | 0.58861 | 0.78943 |
| 150 | 0.37045 | 0.58567 | 0.79202 |
| 151 | 0.36798 | 0.58804 | 0.79157 |
| 160 | 0.37040 | 0.58572 | 0.79443 |
| 161 | 0.36817 | 0.58822 | 0.79363 |
| 170 | 0.37031 | 0.58572 | 0.79571 |
| 171 | 0.36781 | 0.58766 | 0.79449 |
| 180 | 0.37001 | 0.58590 | 0.79686 |
| 181 | 0.36751 | 0.58749 | 0.79582 |
| 190 | 0.36977 | 0.58513 | 0.79752 |
| 191 | 0.36747 | 0.58678 | 0.79695 |
| 200 | 0.36960 | 0.58556 | 0.79917 |
| 201 | 0.36806 | 0.58749 | 0.79857 |
Conclusion
As we can see, on small samples relative efficiency of $S_n$ and $Q_n$ are still better than the efficiency of $\operatorname{MAD}_n$, but it is much lower than the asymptotic values.
References
- [Rousseeuw1992]
Croux, Christophe, and Peter J. Rousseeuw. “Time-Efficient Algorithms for Two Highly Robust Estimators of Scale.” In Computational Statistics, edited by Yadolah Dodge and Joe Whittaker, 411–28. Heidelberg: Physica-Verlag HD, 1992.
https://doi.org/10.1007/978-3-662-26811-7_58 - [Rousseeuw1993]
Rousseeuw, Peter J., and Christophe Croux. “Alternatives to the Median Absolute Deviation.” Journal of the American Statistical Association 88, no. 424 (December 1, 1993): 1273–83.
https://doi.org/10.1080/01621459.1993.10476408 - [Akinshin2022]
Andrey Akinshin (2022) “Finite-sample bias-correction factors for the median absolute deviation based on the Harrell-Davis quantile estimator and its trimmed modification,” arXiv:2207.12005