Distribution comparison via the shift and ratio functions
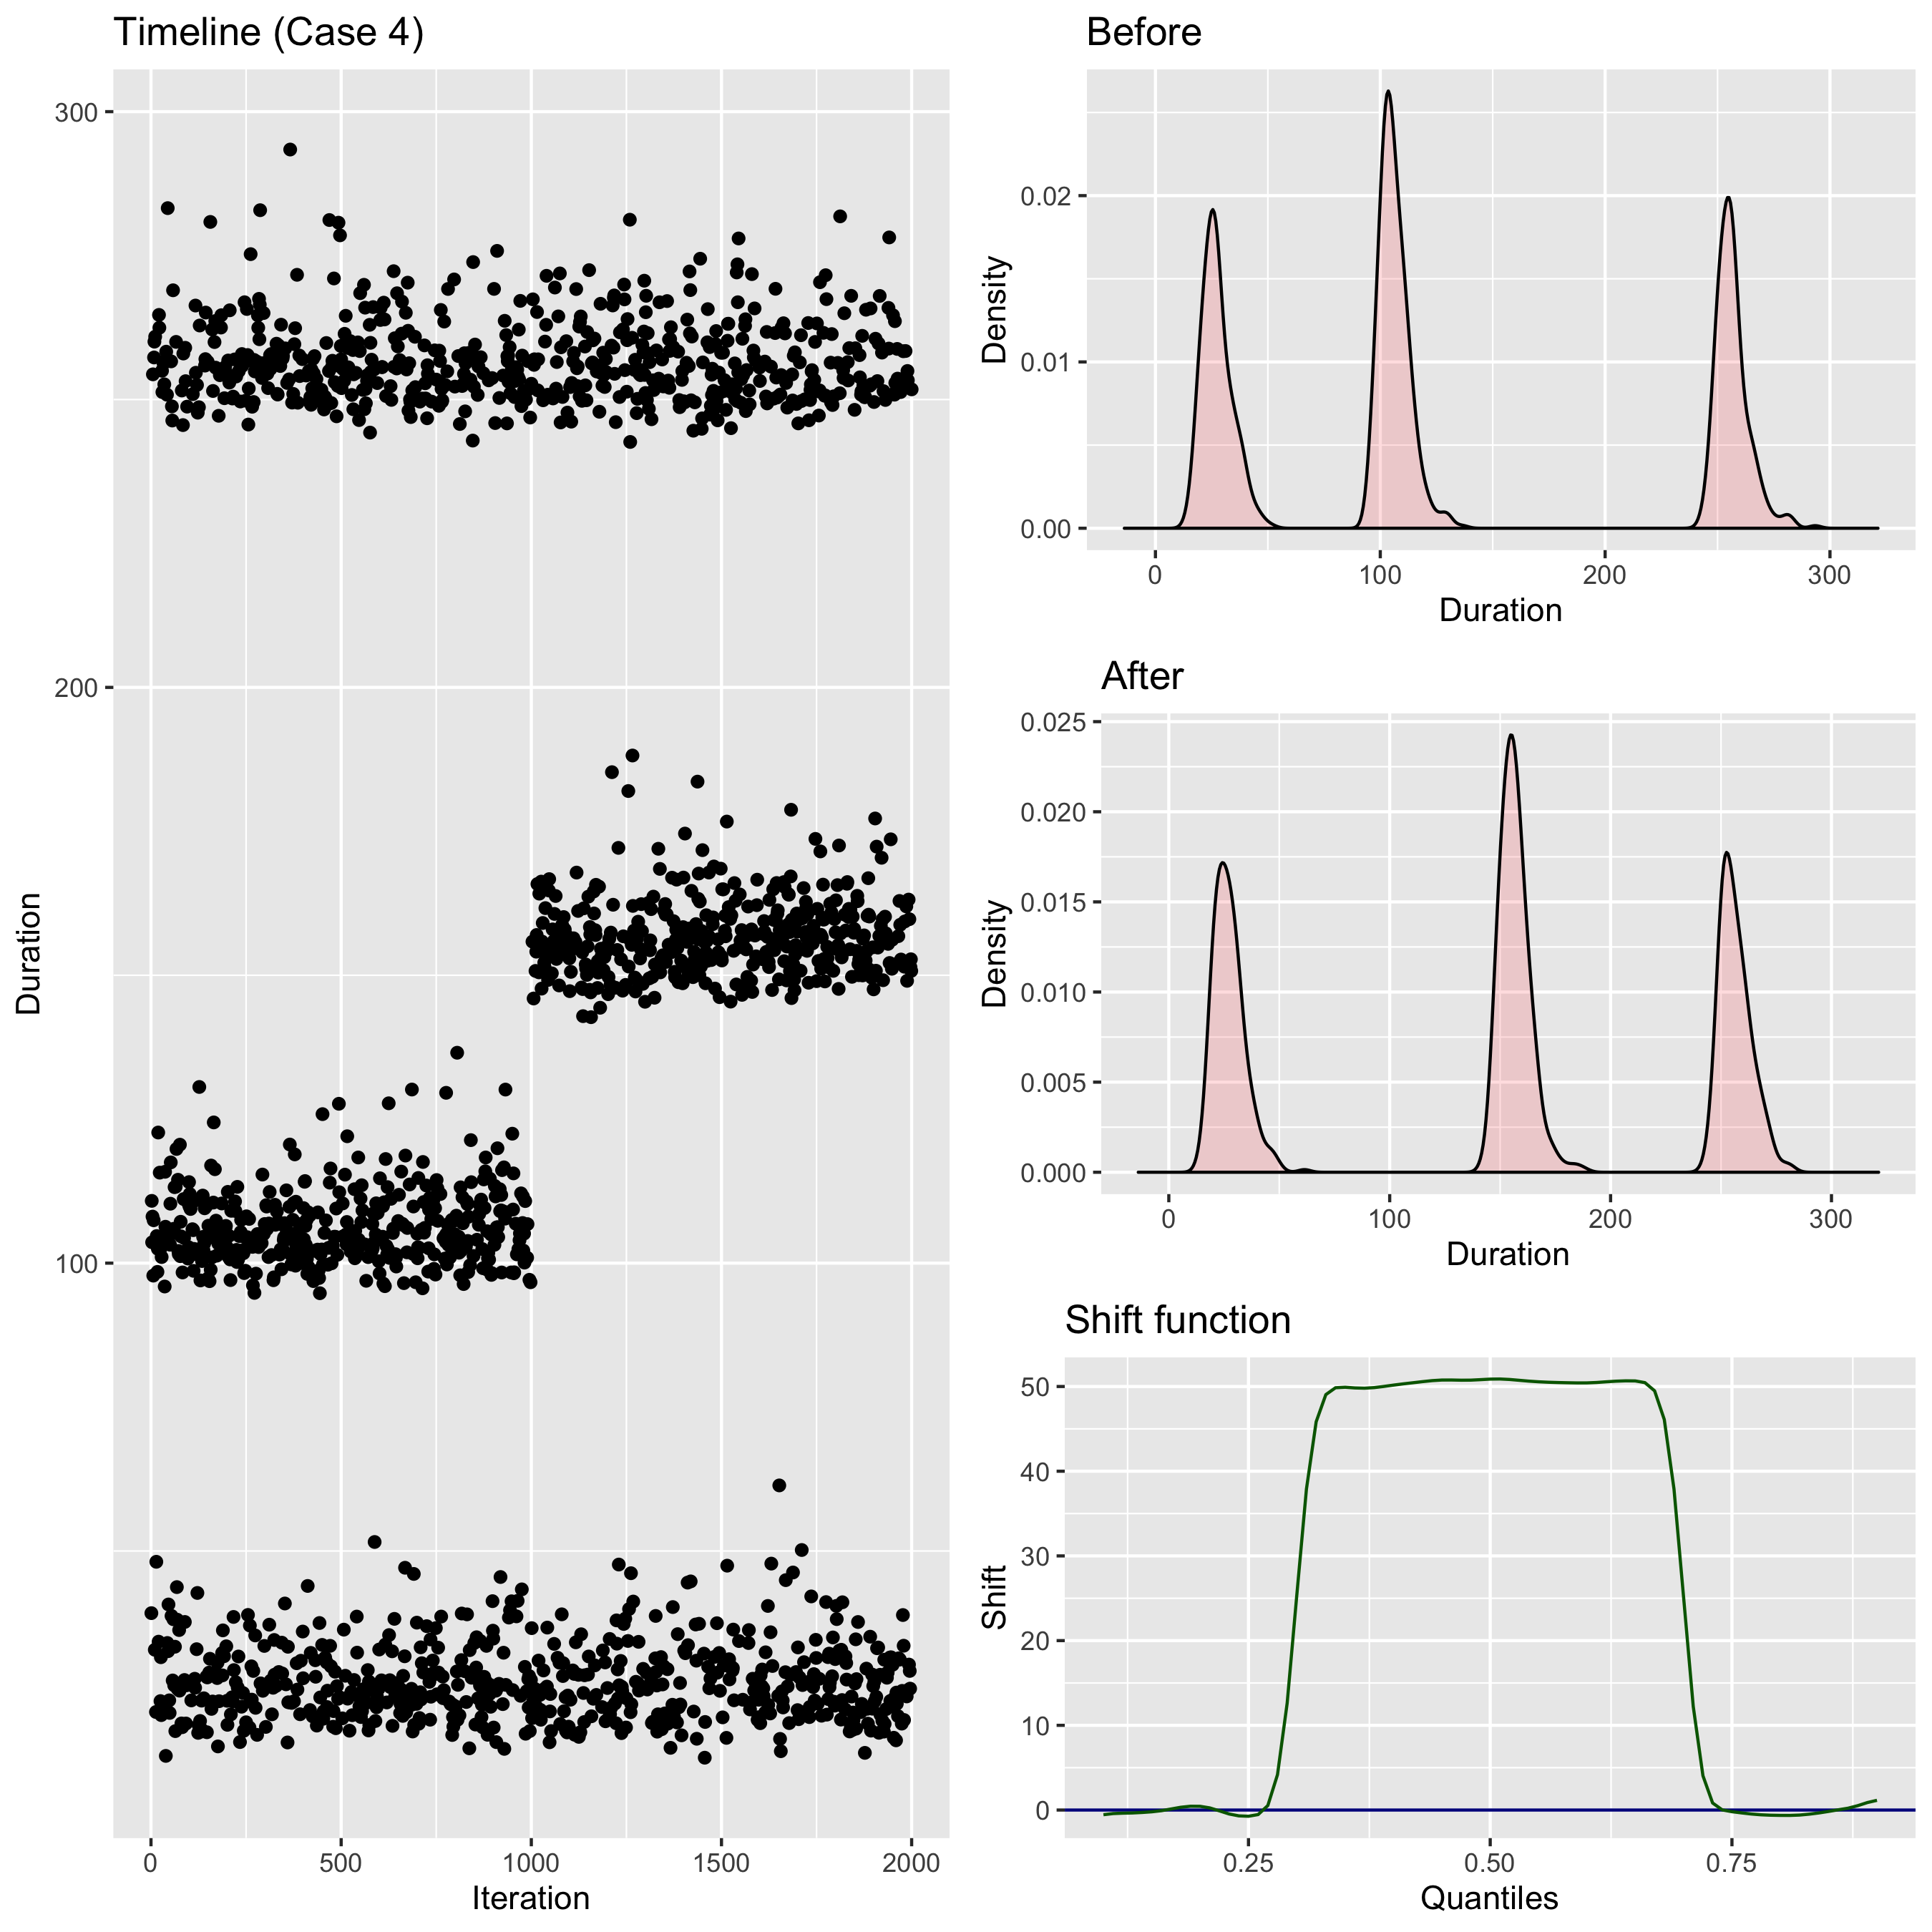
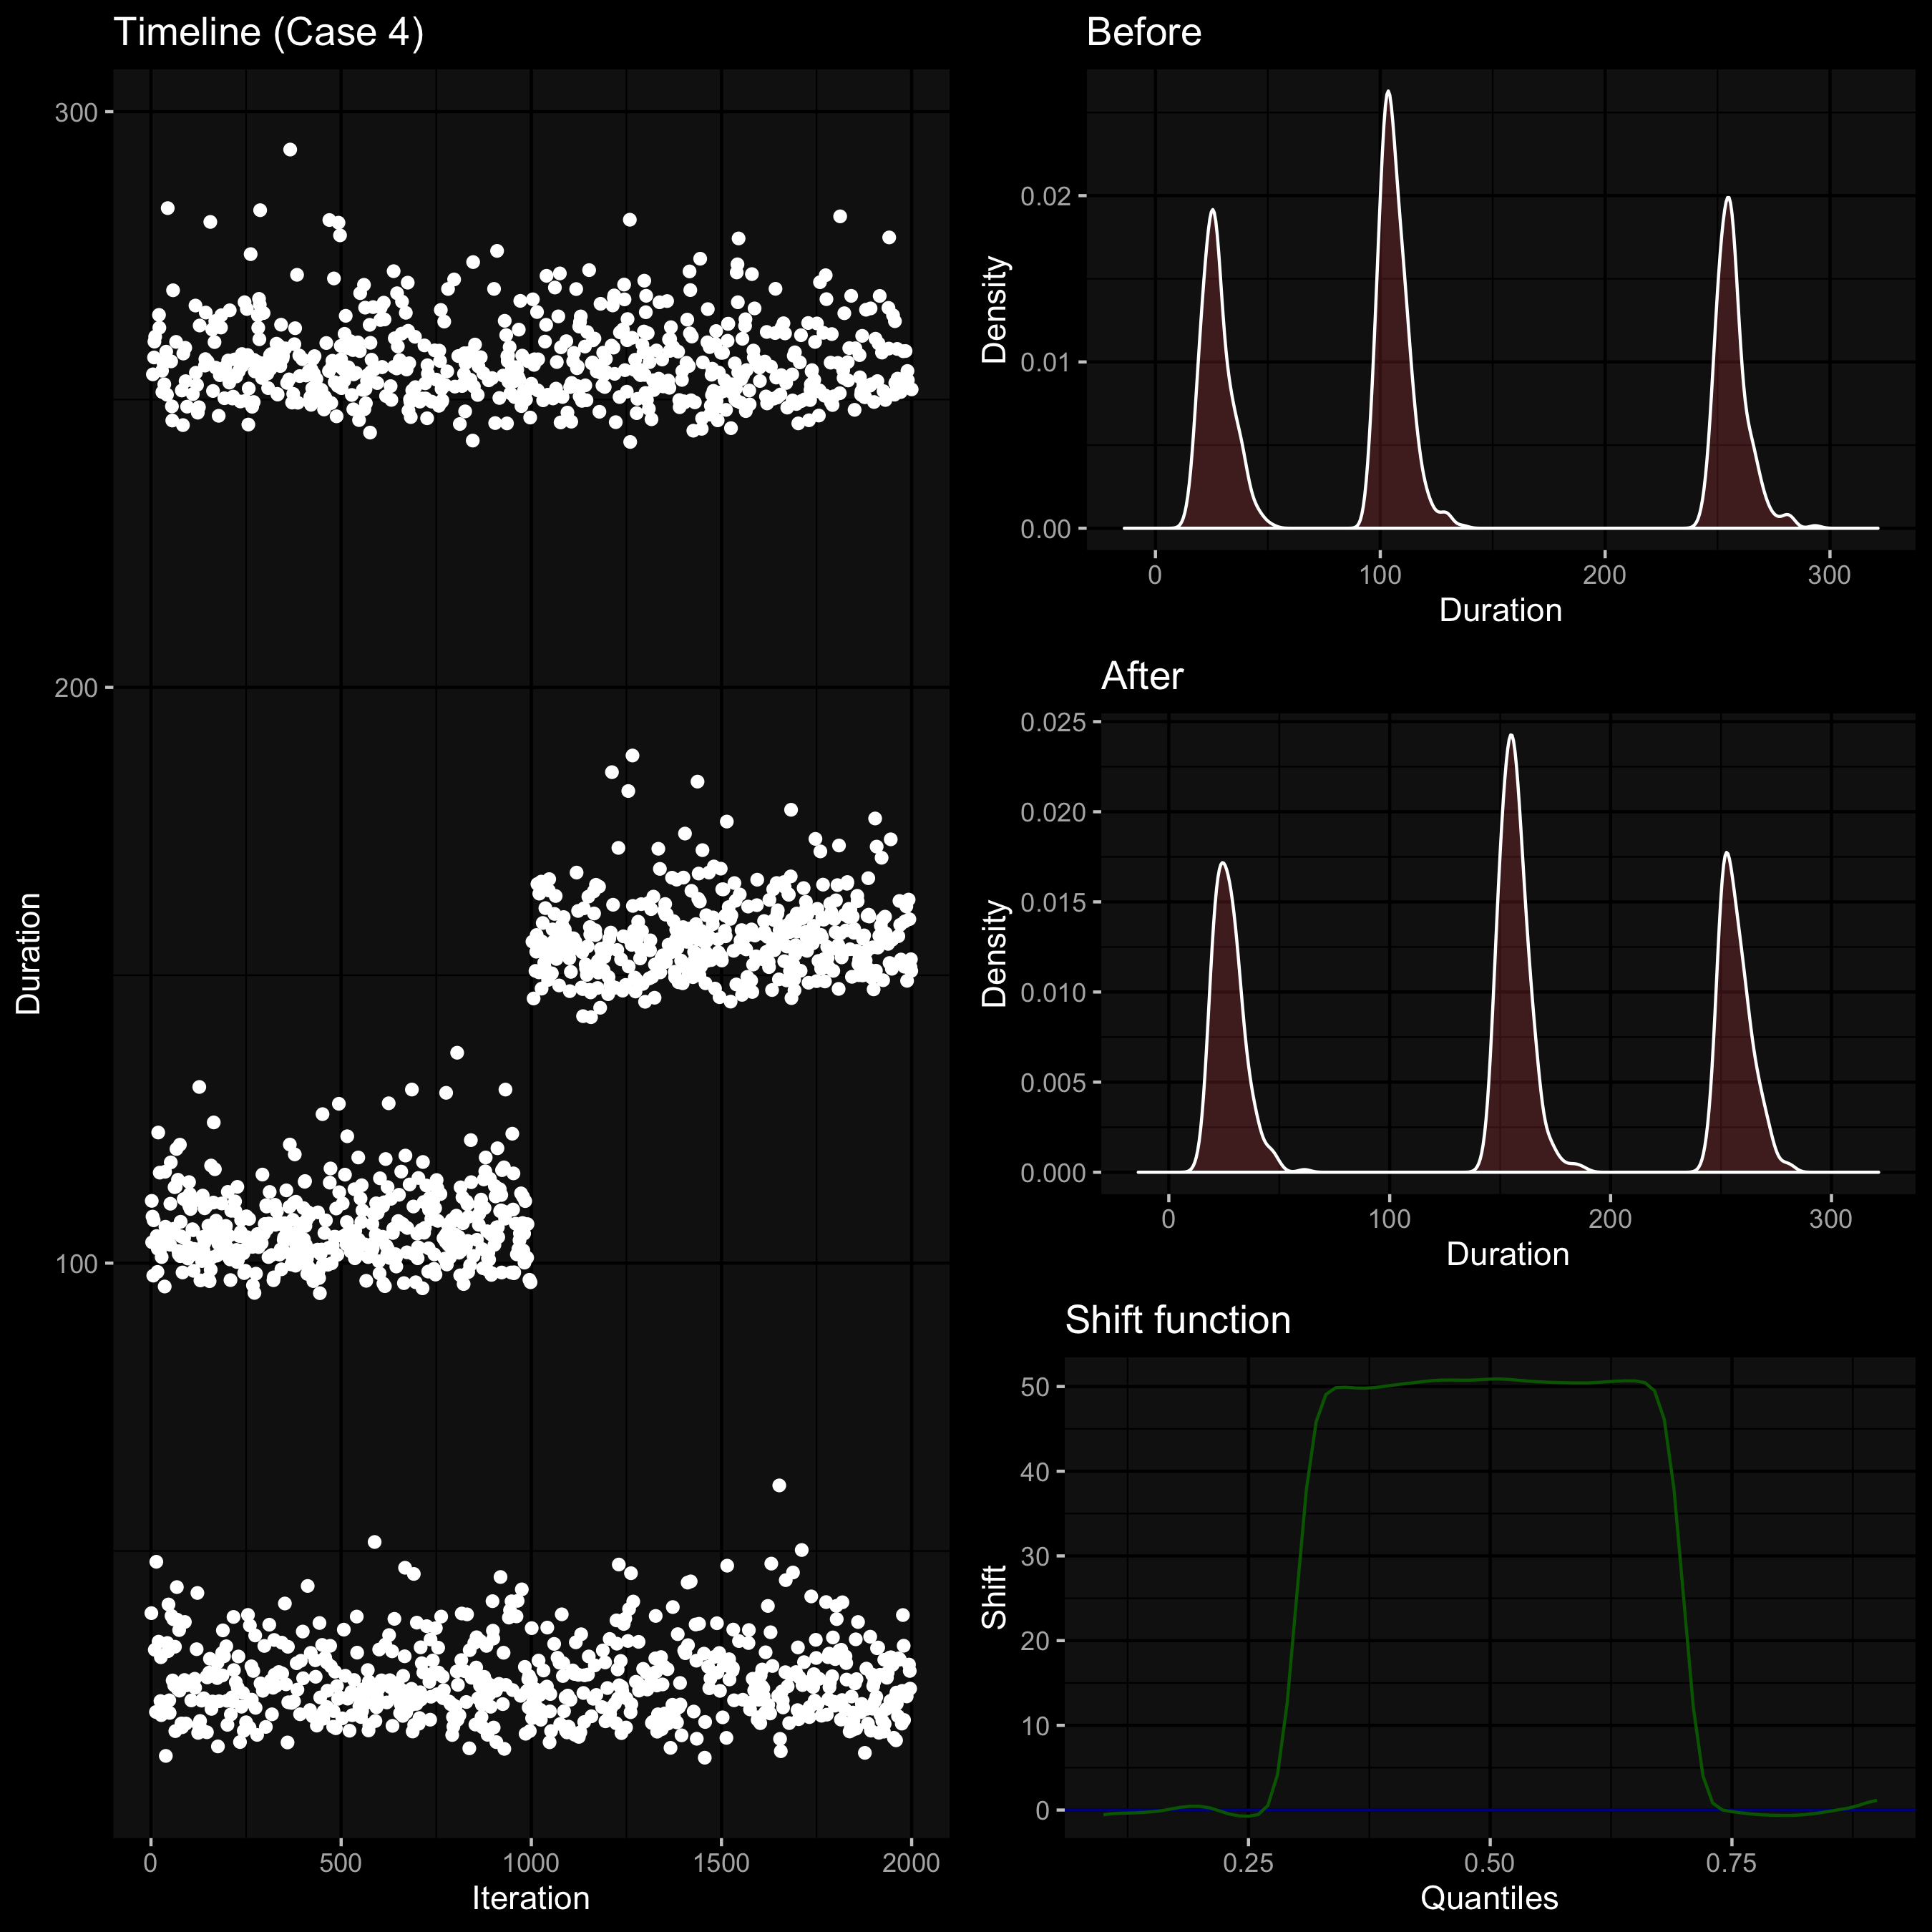
When we compare two distributions, it’s not always enough to detect a statistically significant difference between them. In many cases, we also want to evaluate the magnitude of this difference. Let’s look at the following image:
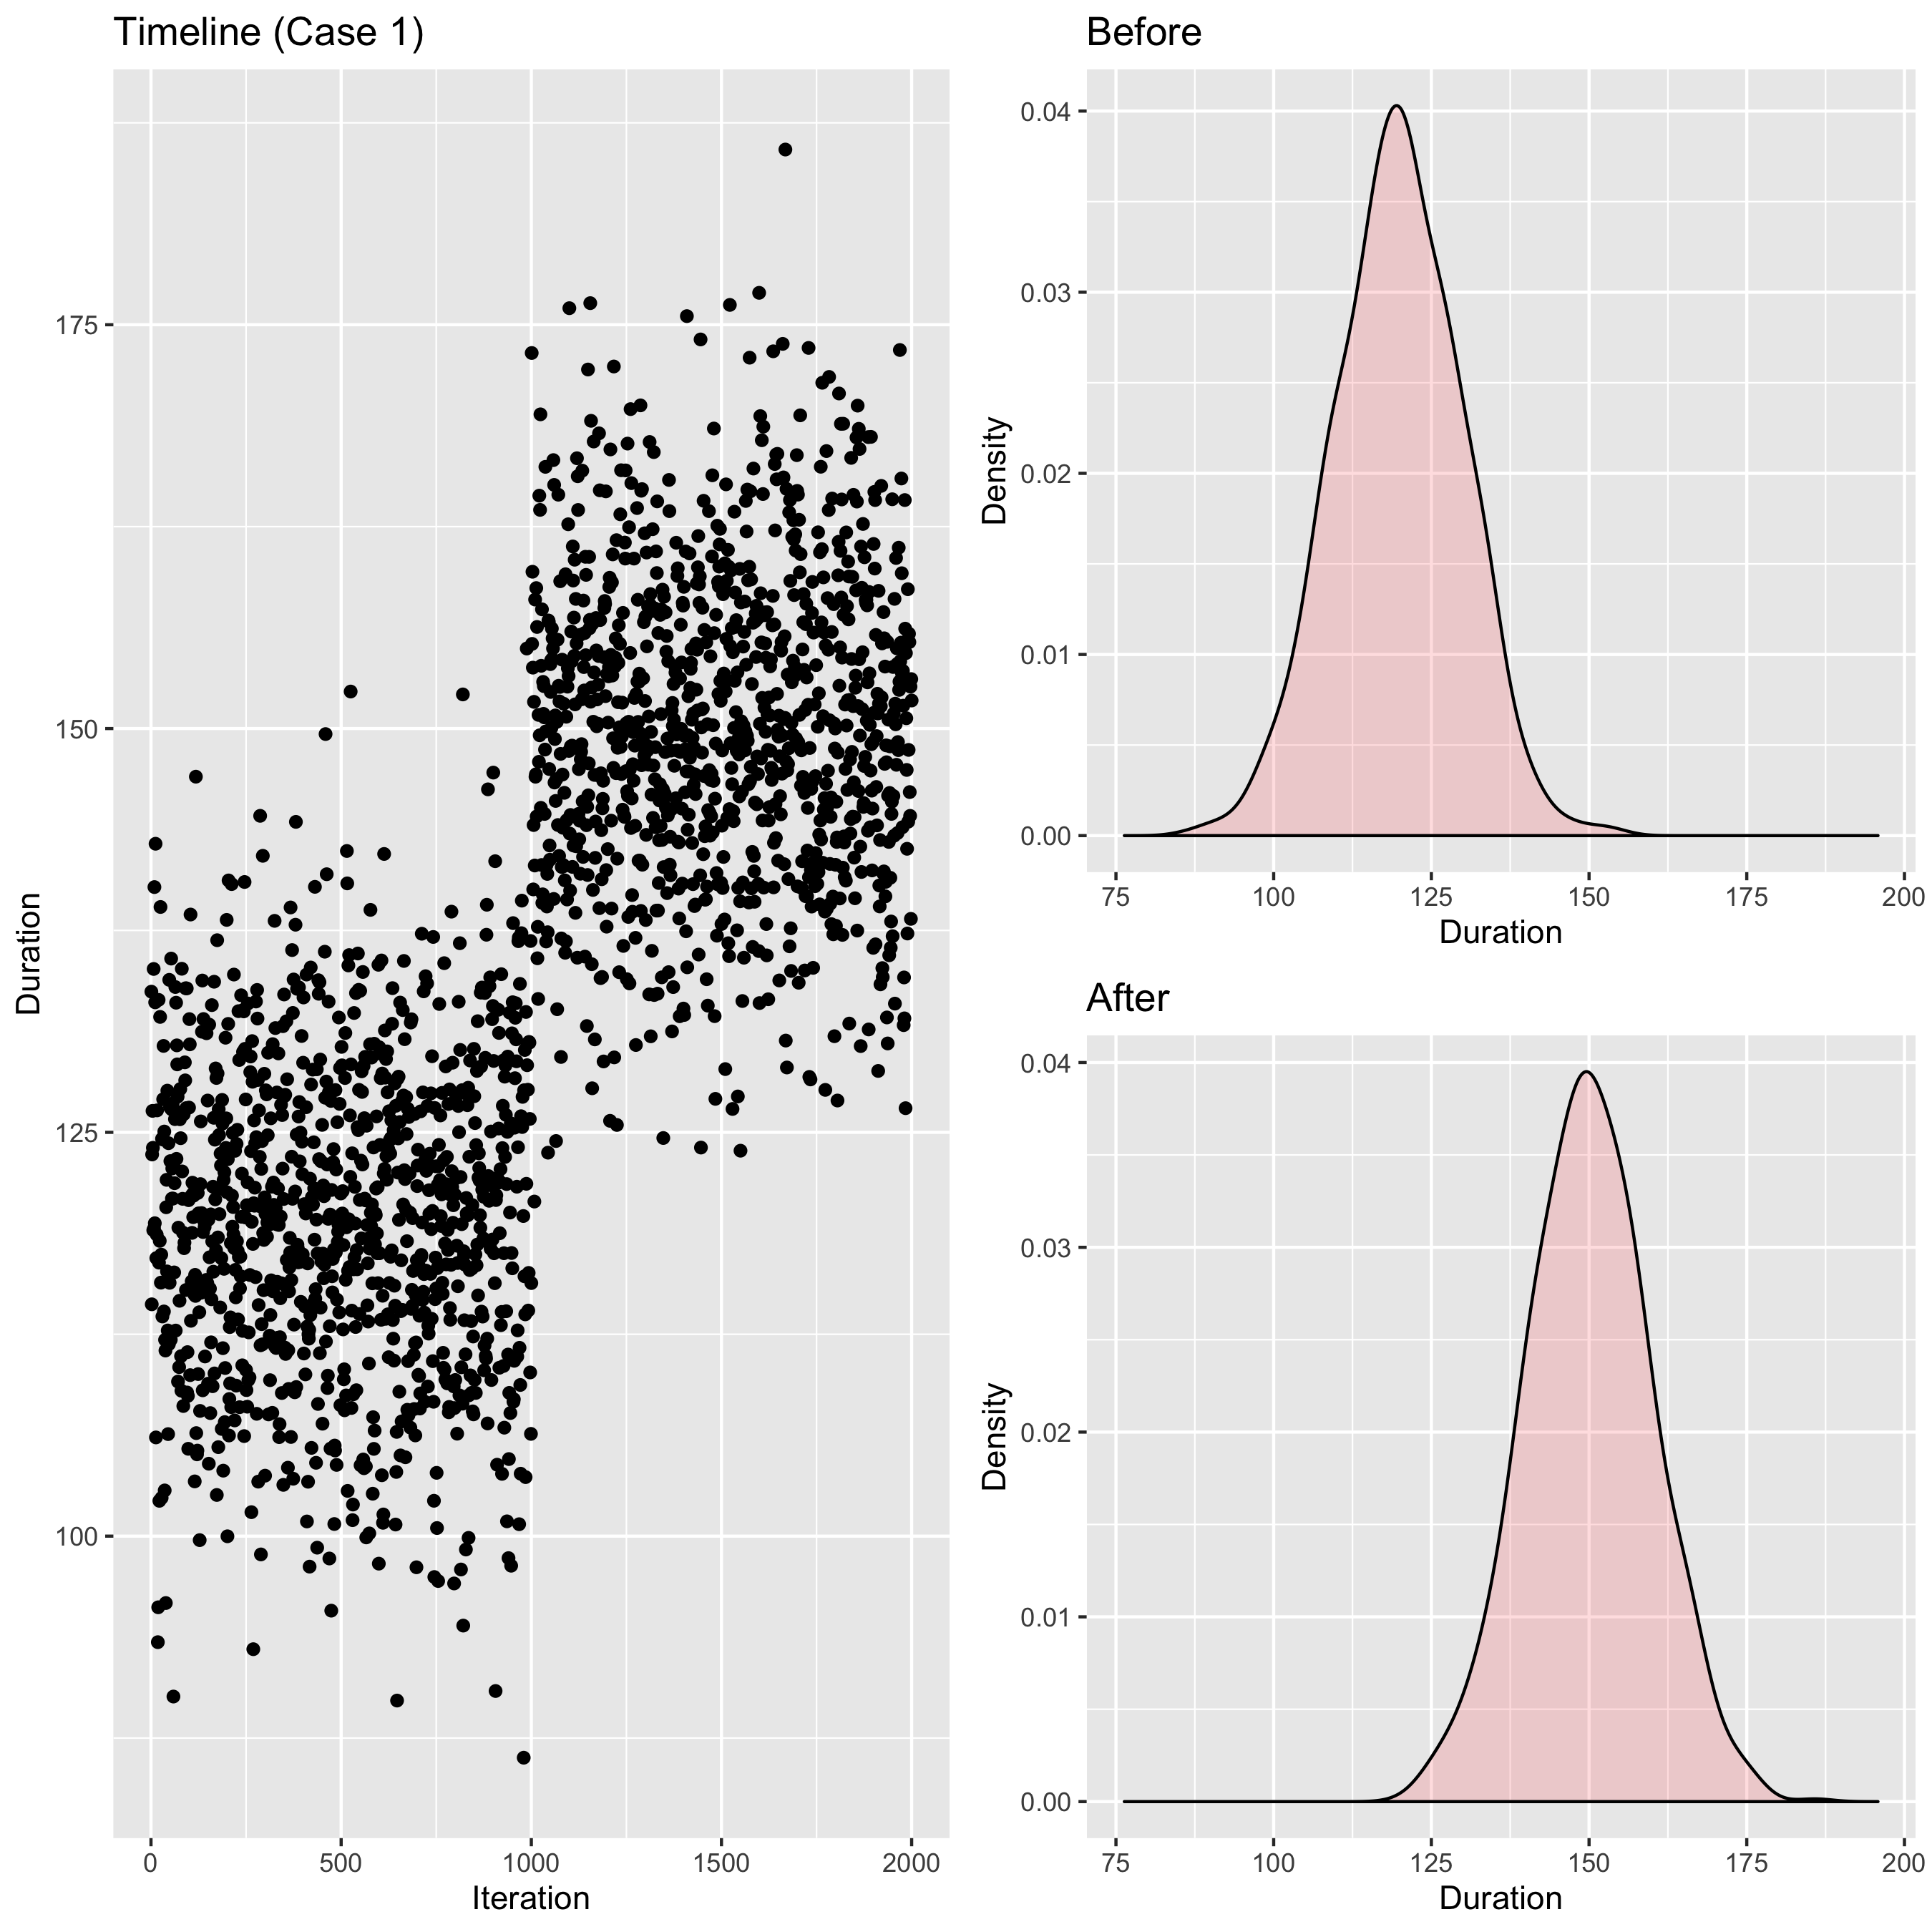
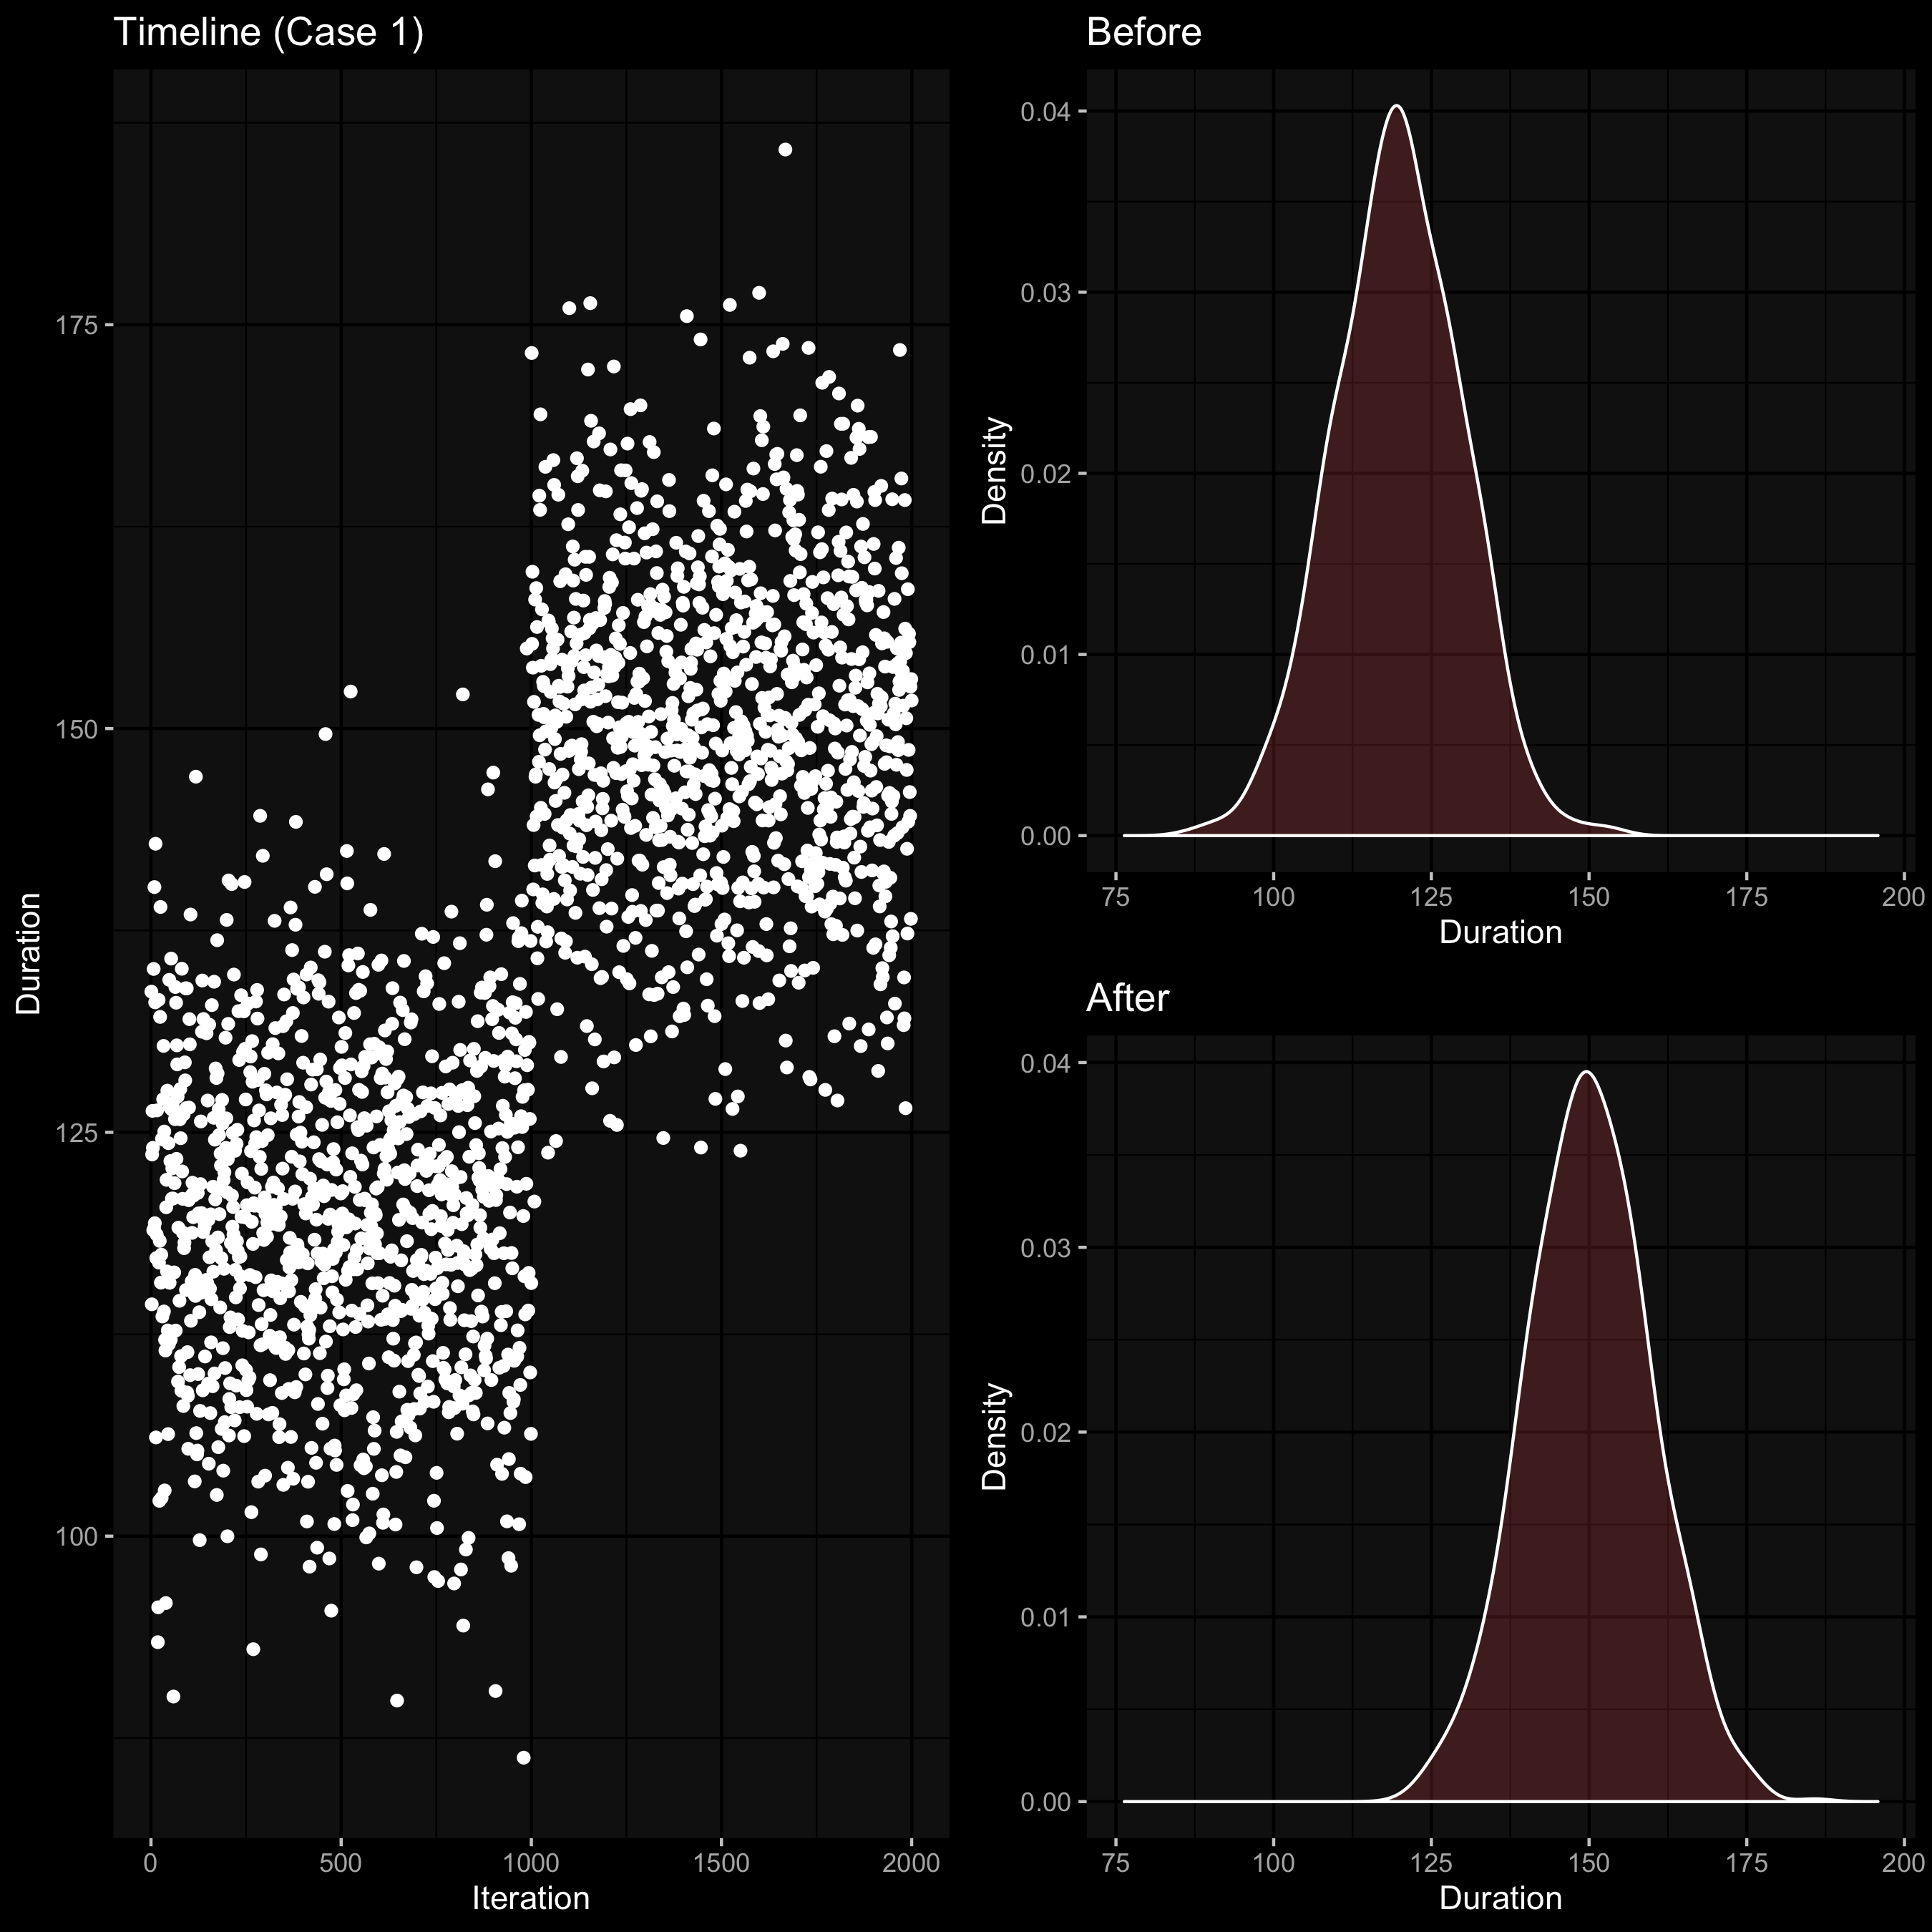
On the left side, we can see a timeline plot with 2000 points (at the middle of this plot, the distribution was significantly changed). On the right side, you can see density plots for the left and the right side of the timeline plot (before and after the change). It’s a pretty simple case, the difference between distributions be expressed via the difference between mean values.
Now let’s look at a more tricky case:
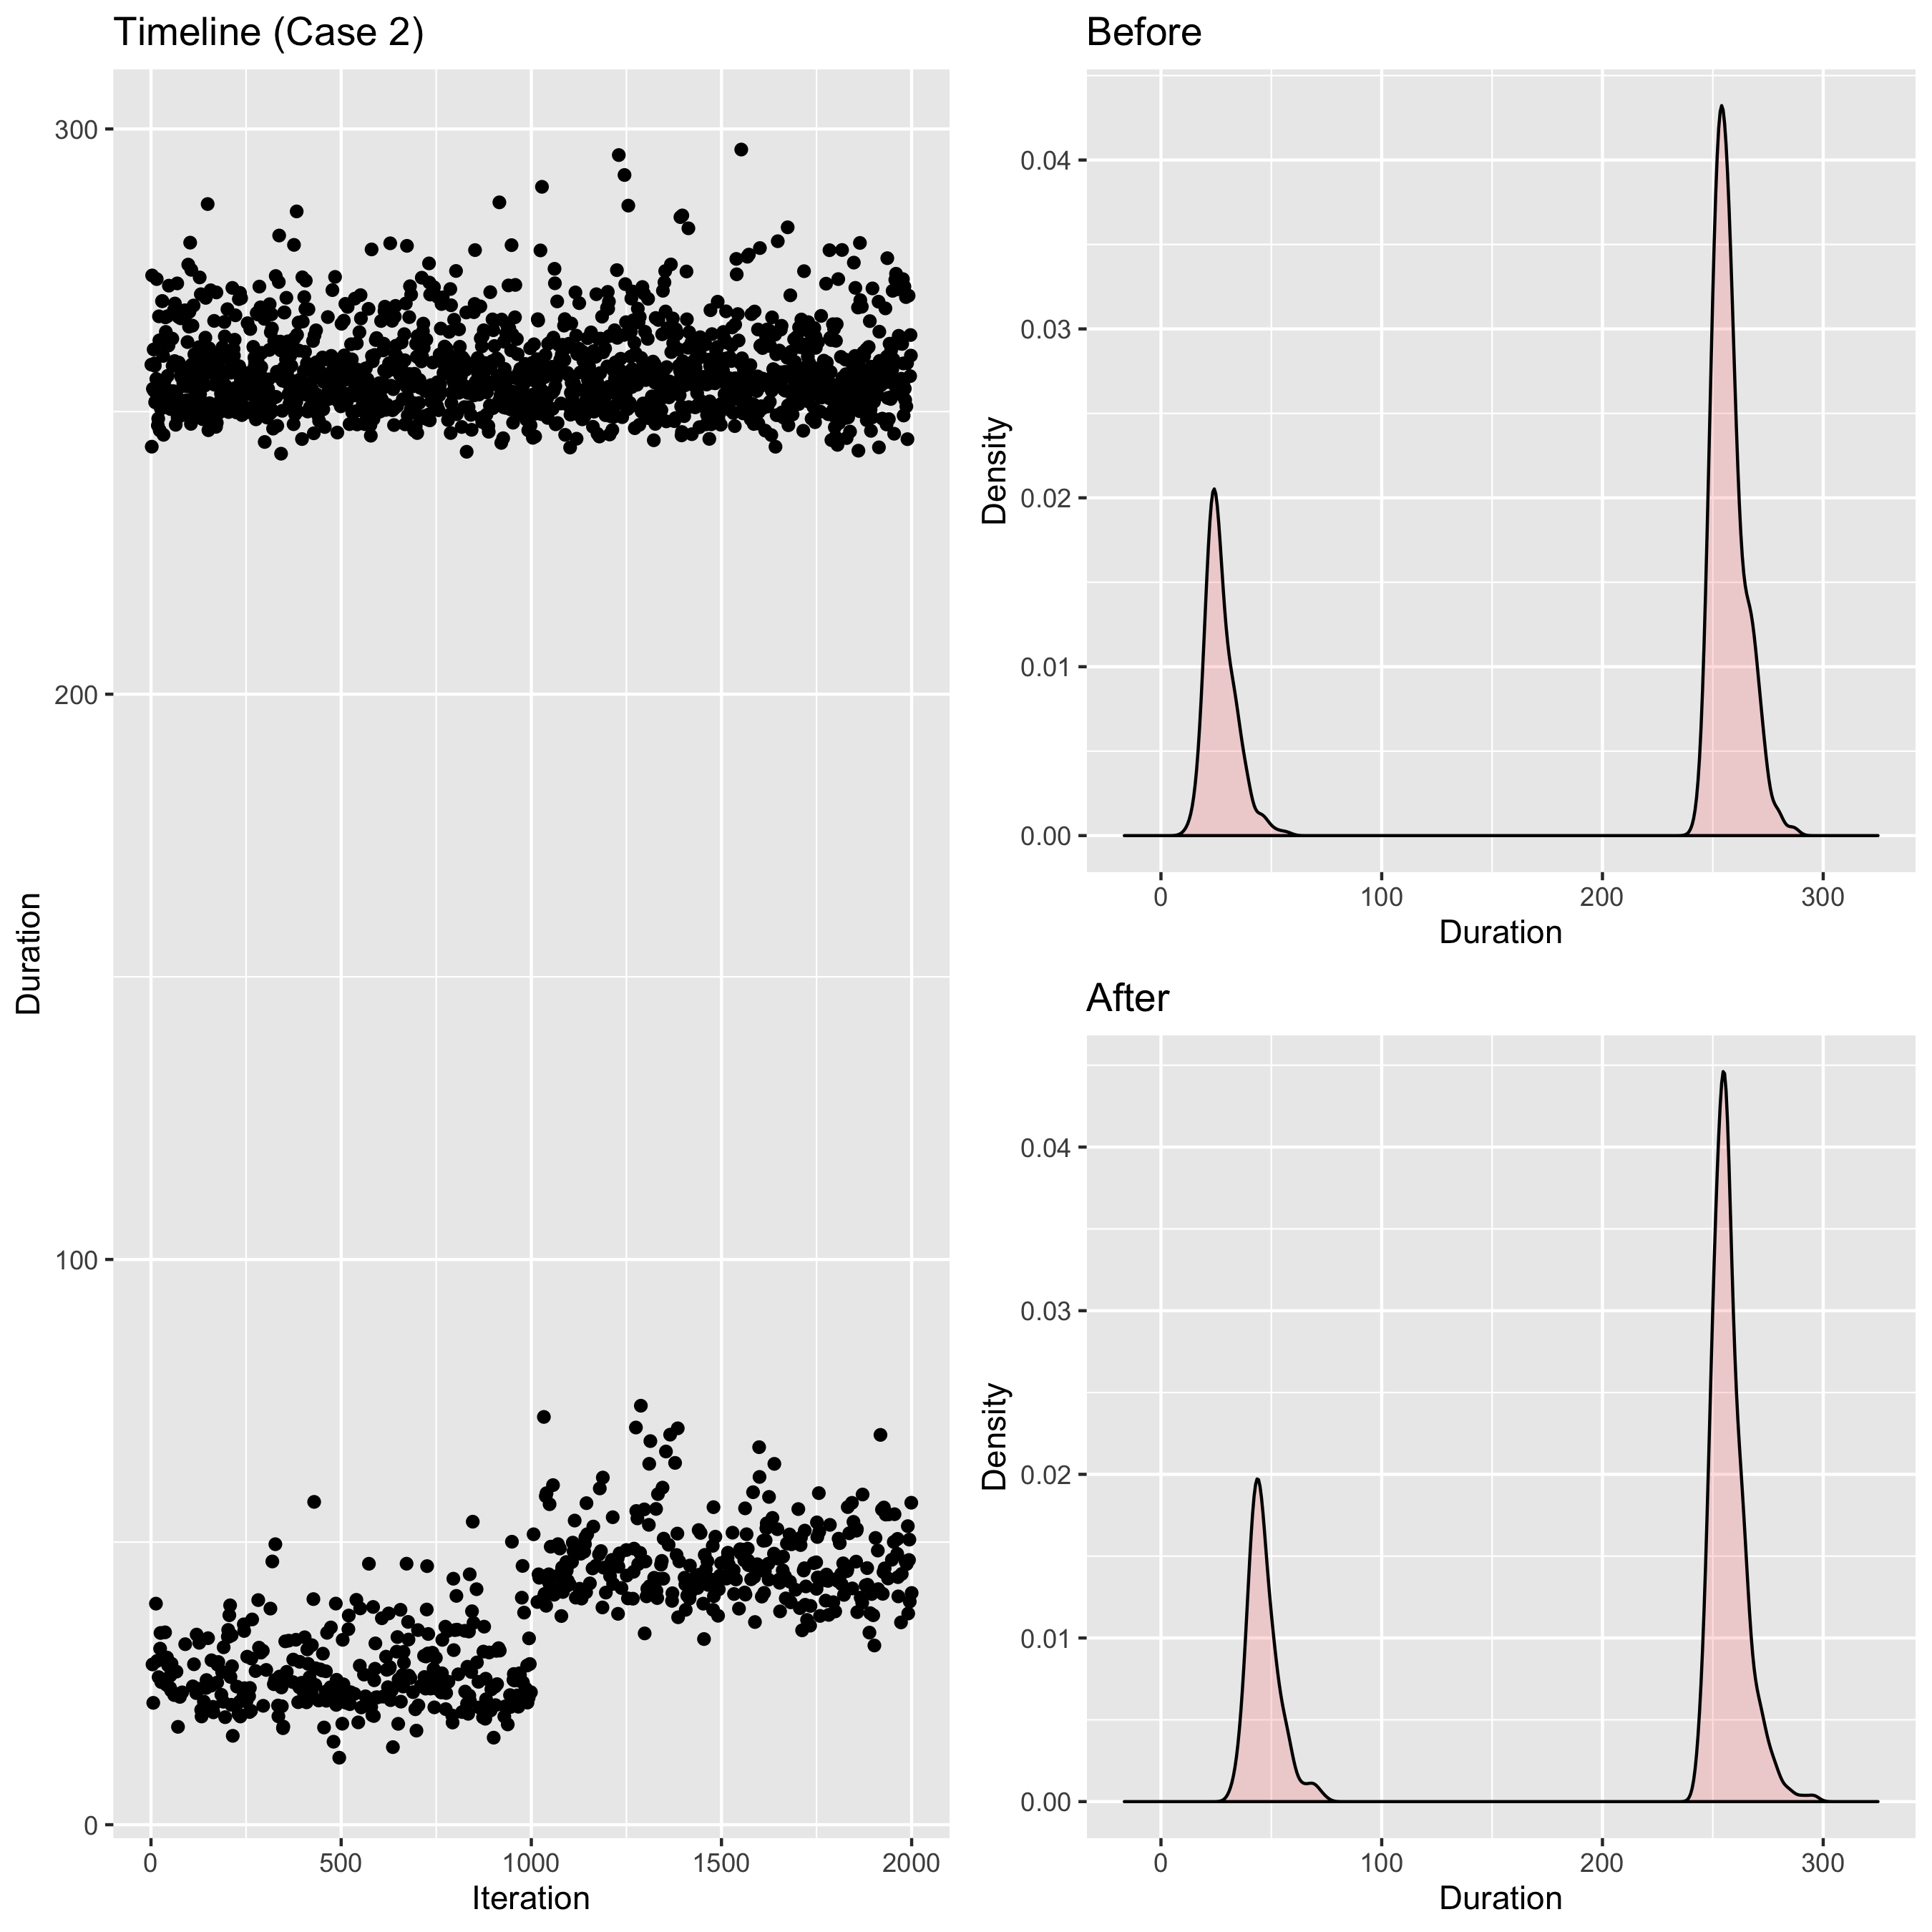
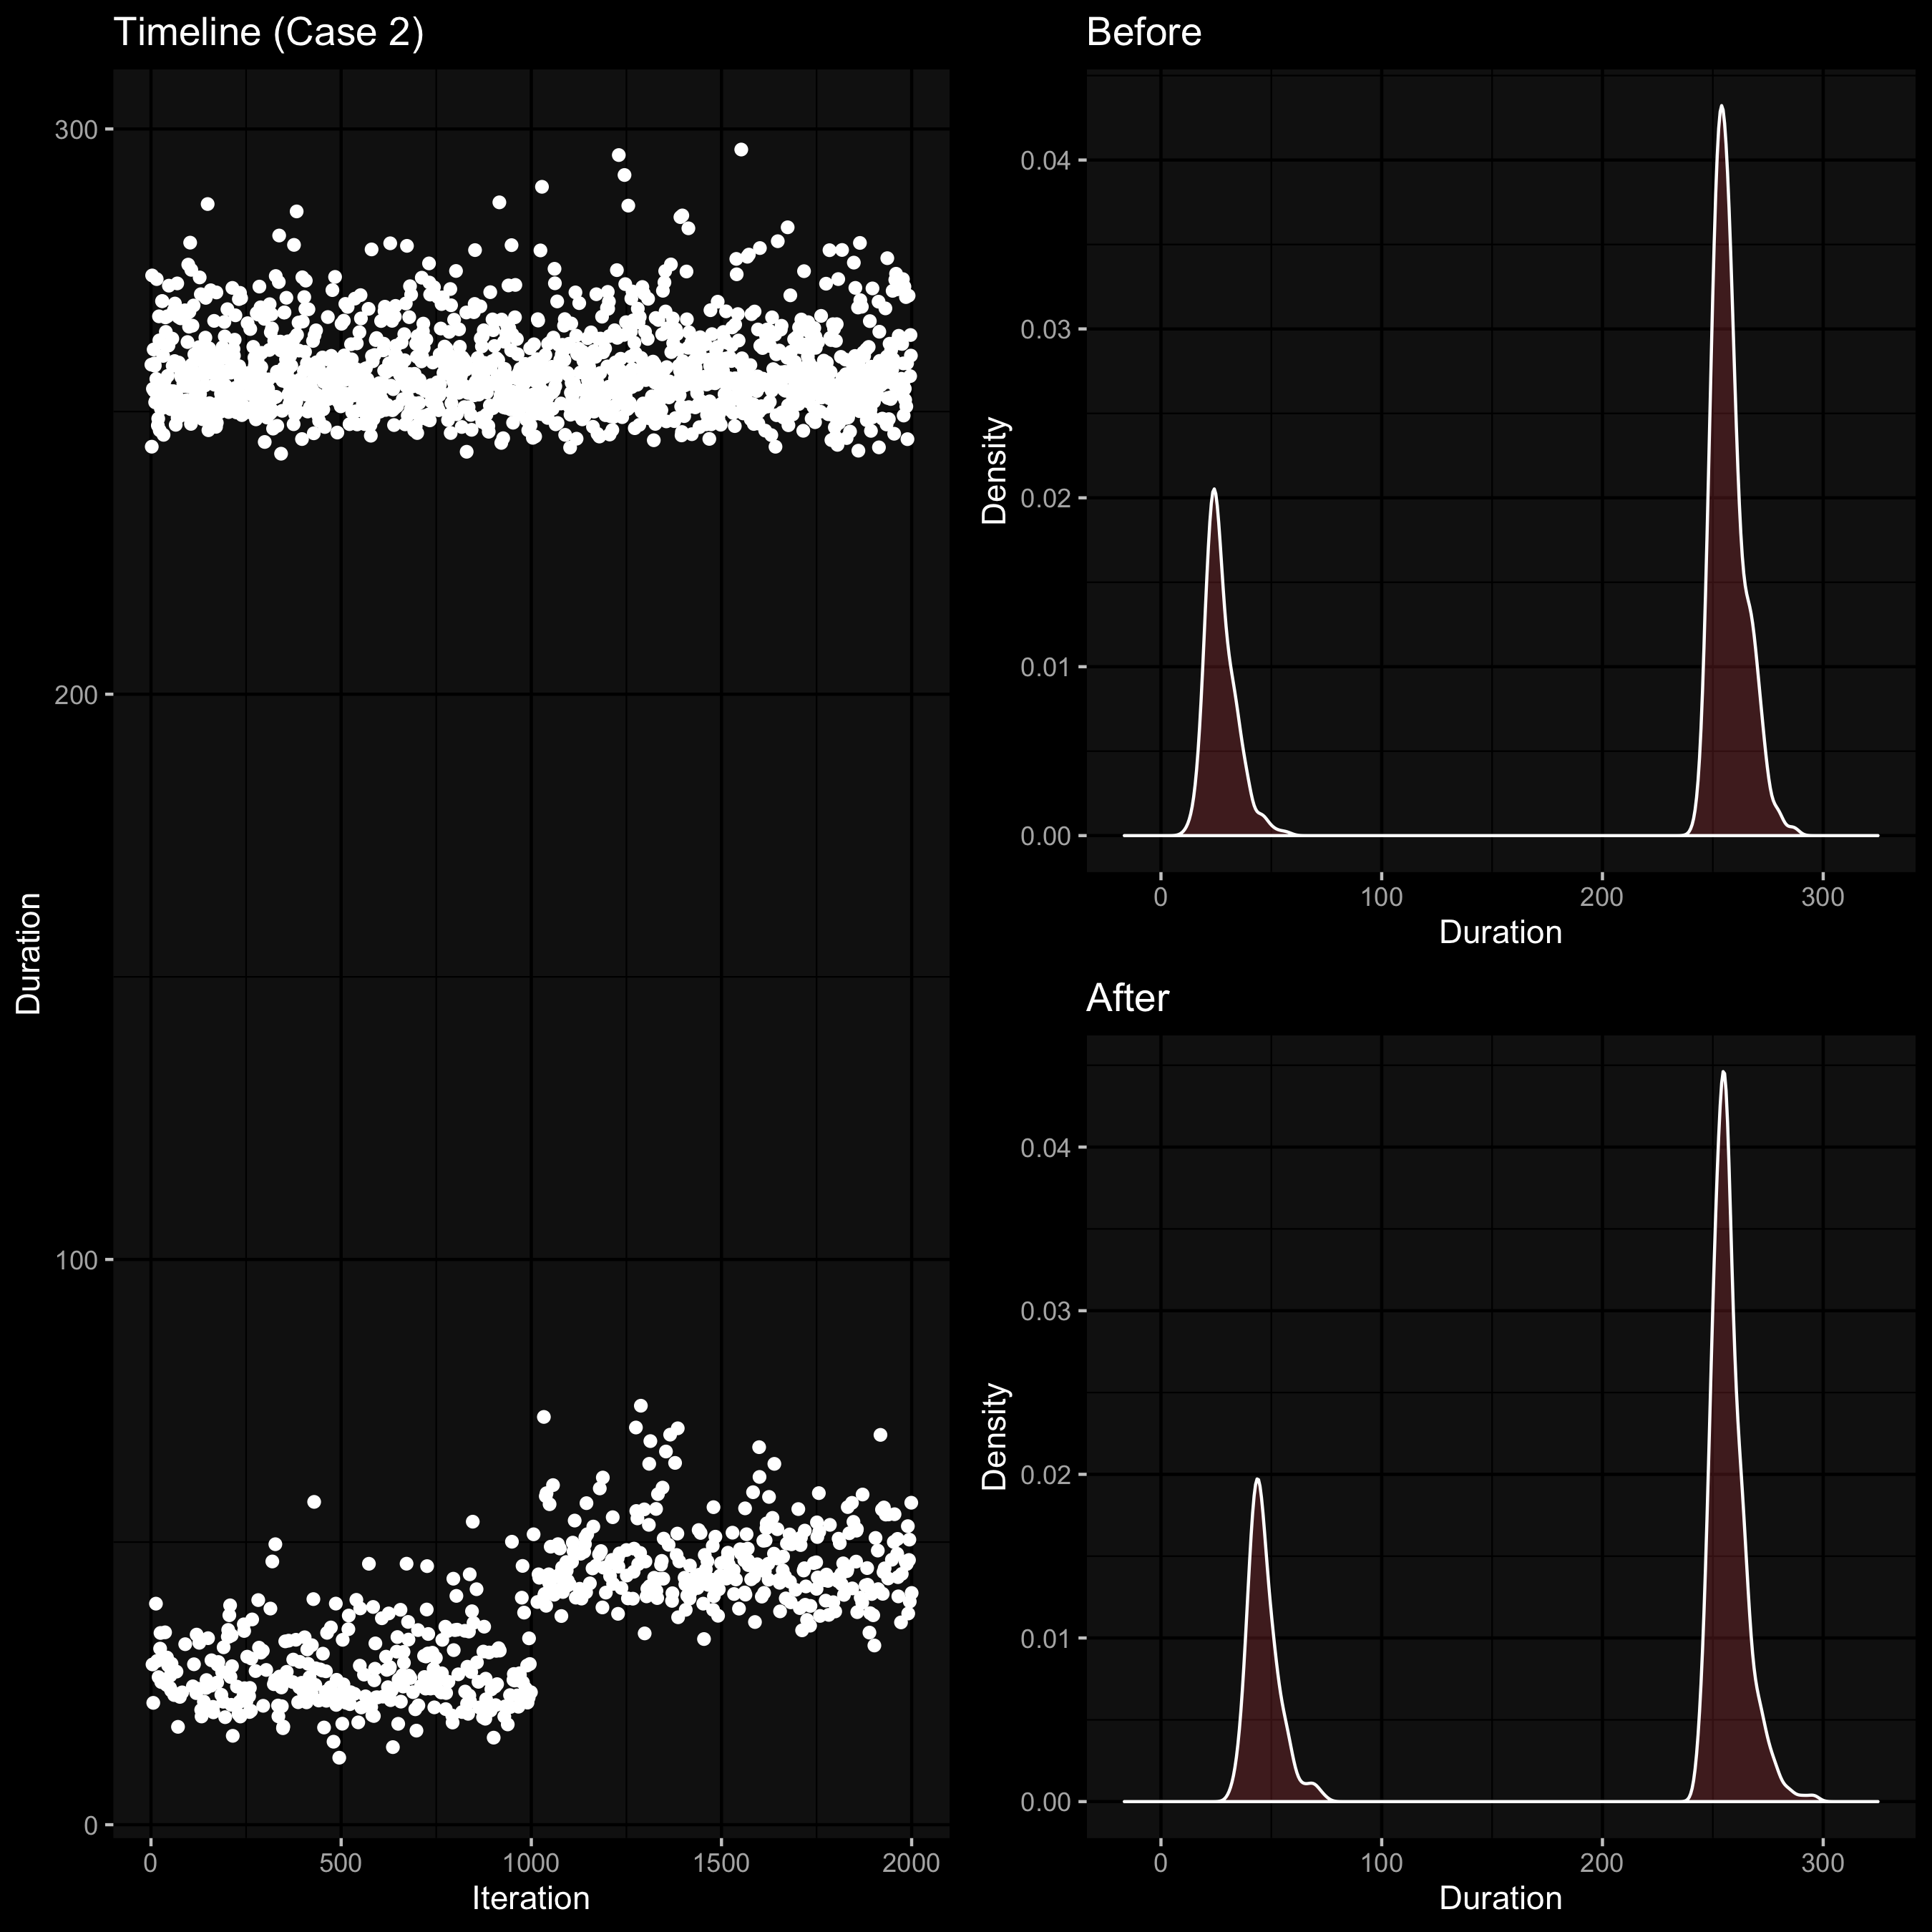
Here we have a bimodal distribution; after the change, the left mode “moved right.” Now it’s much harder to evaluate the difference between distributions because the mean and the median values almost not changed: the right mode has the biggest impact on these metrics than the left more.
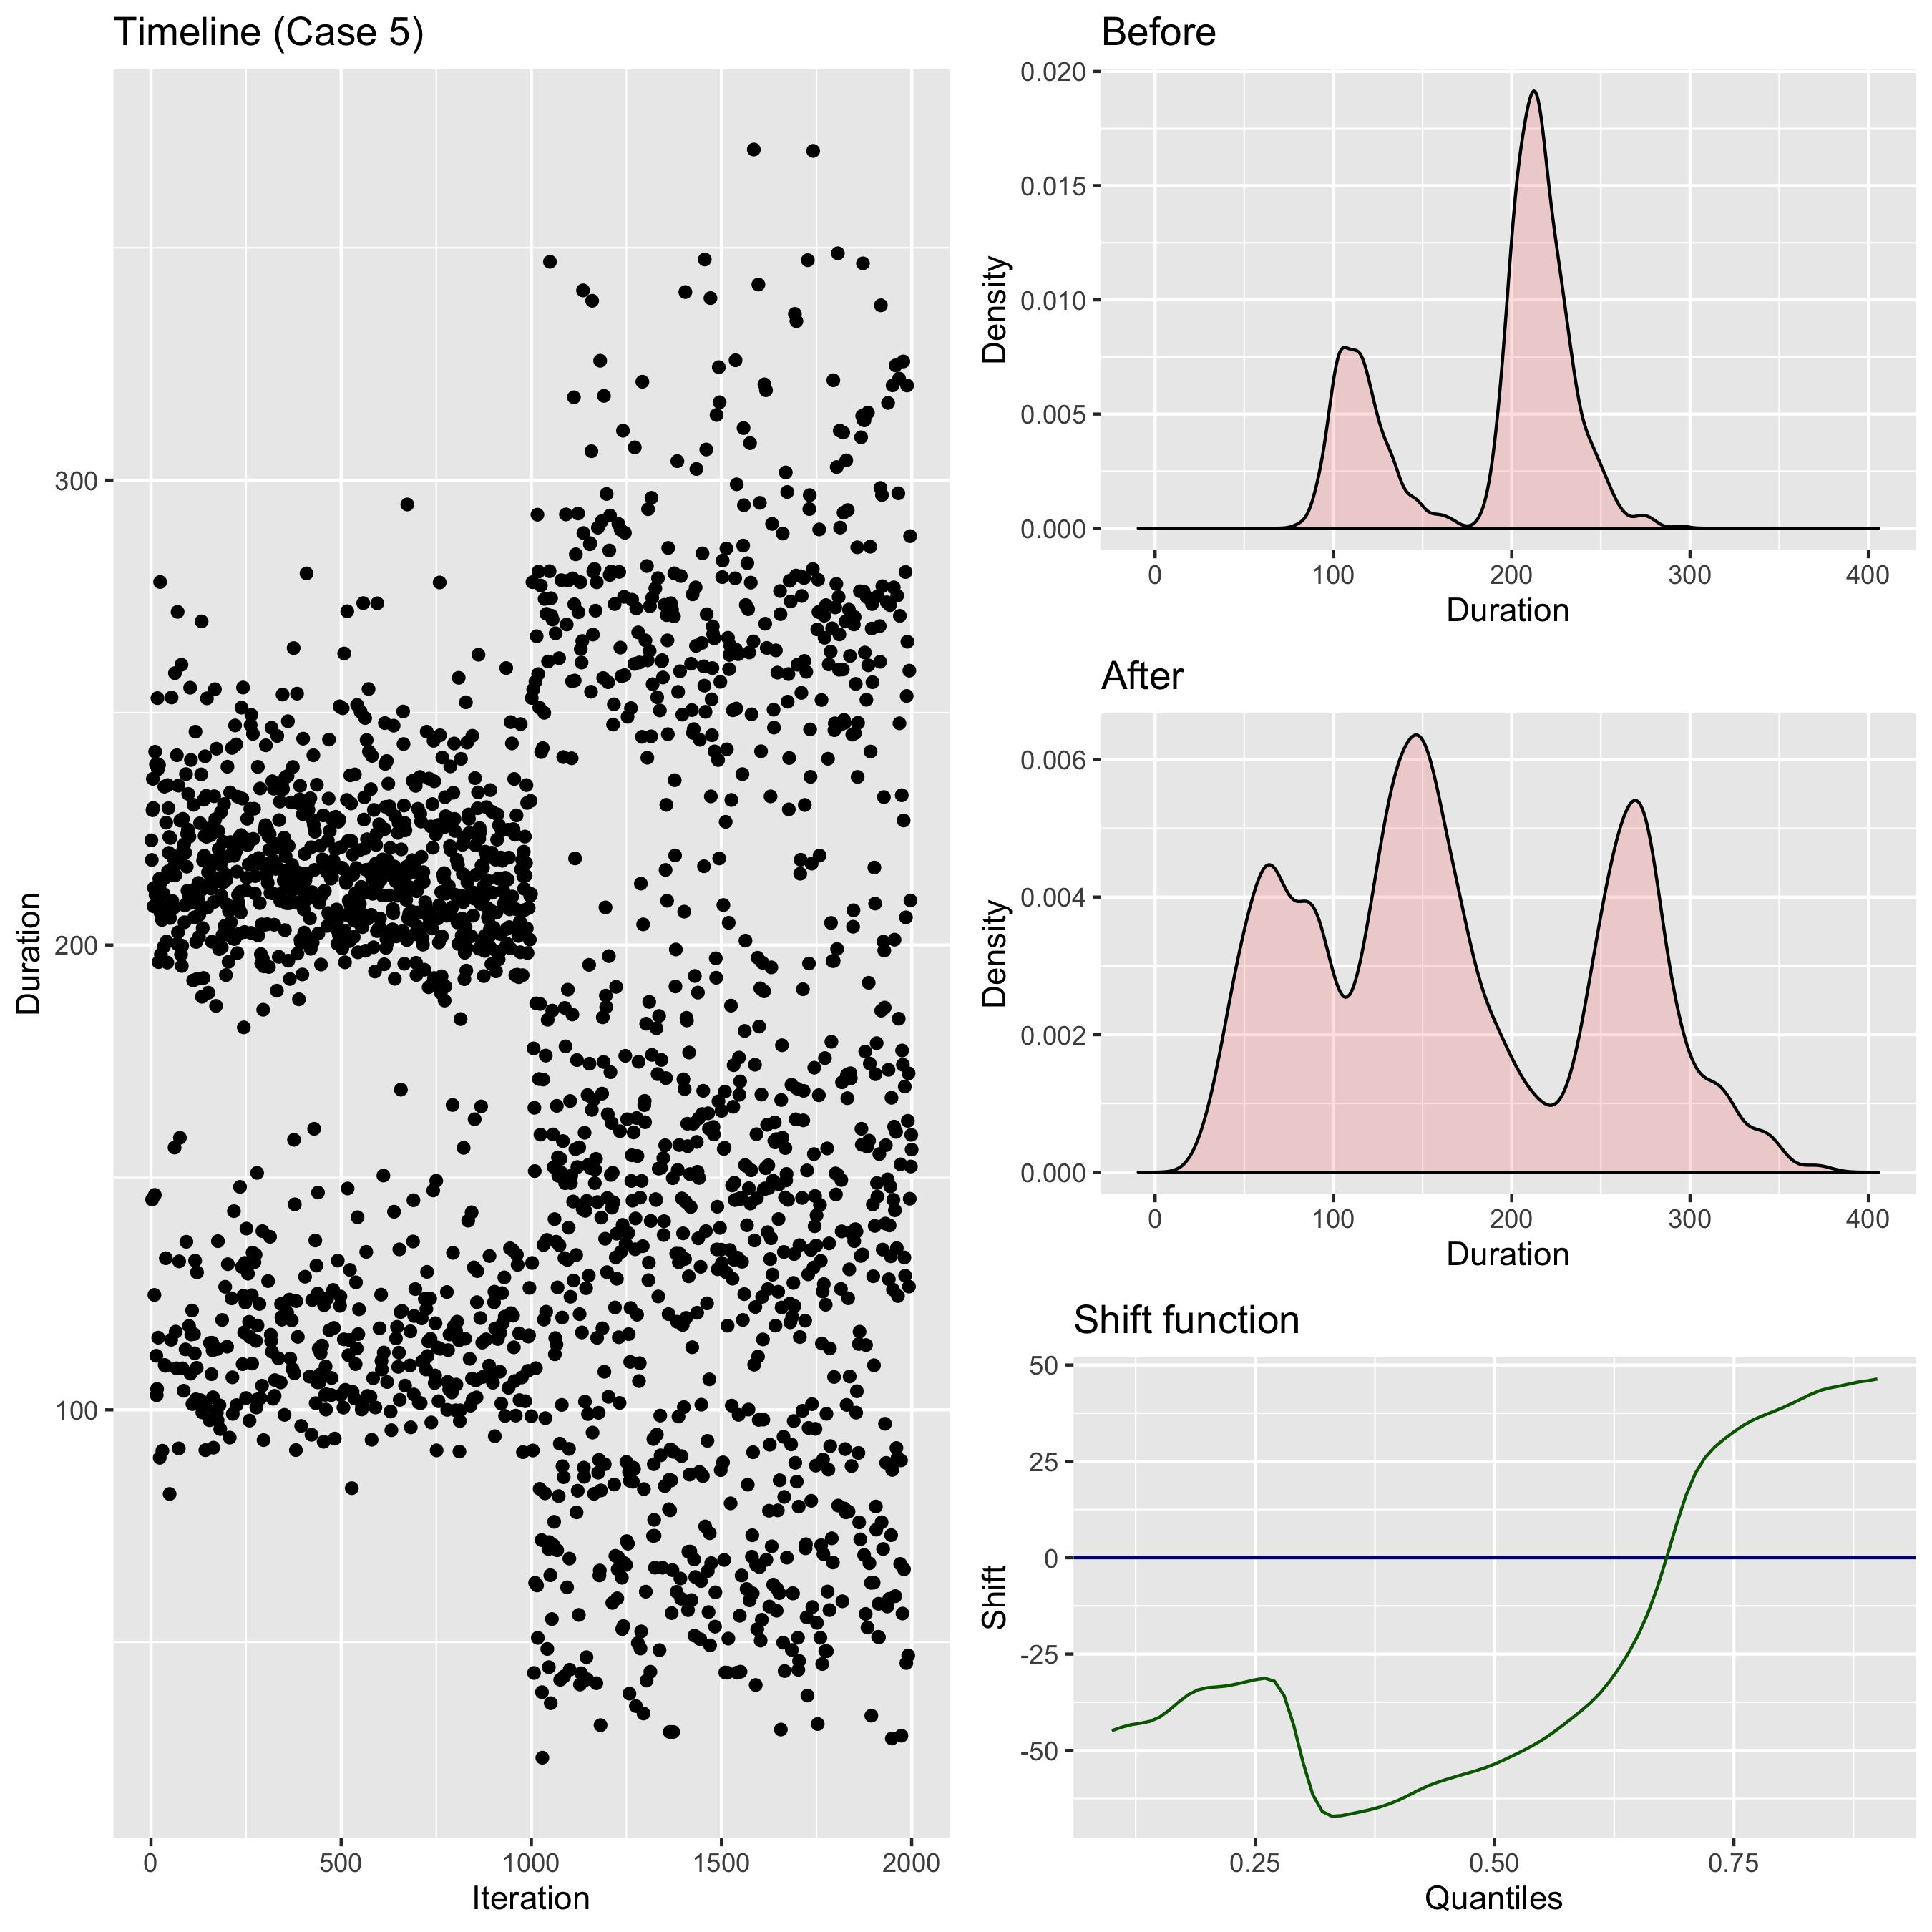
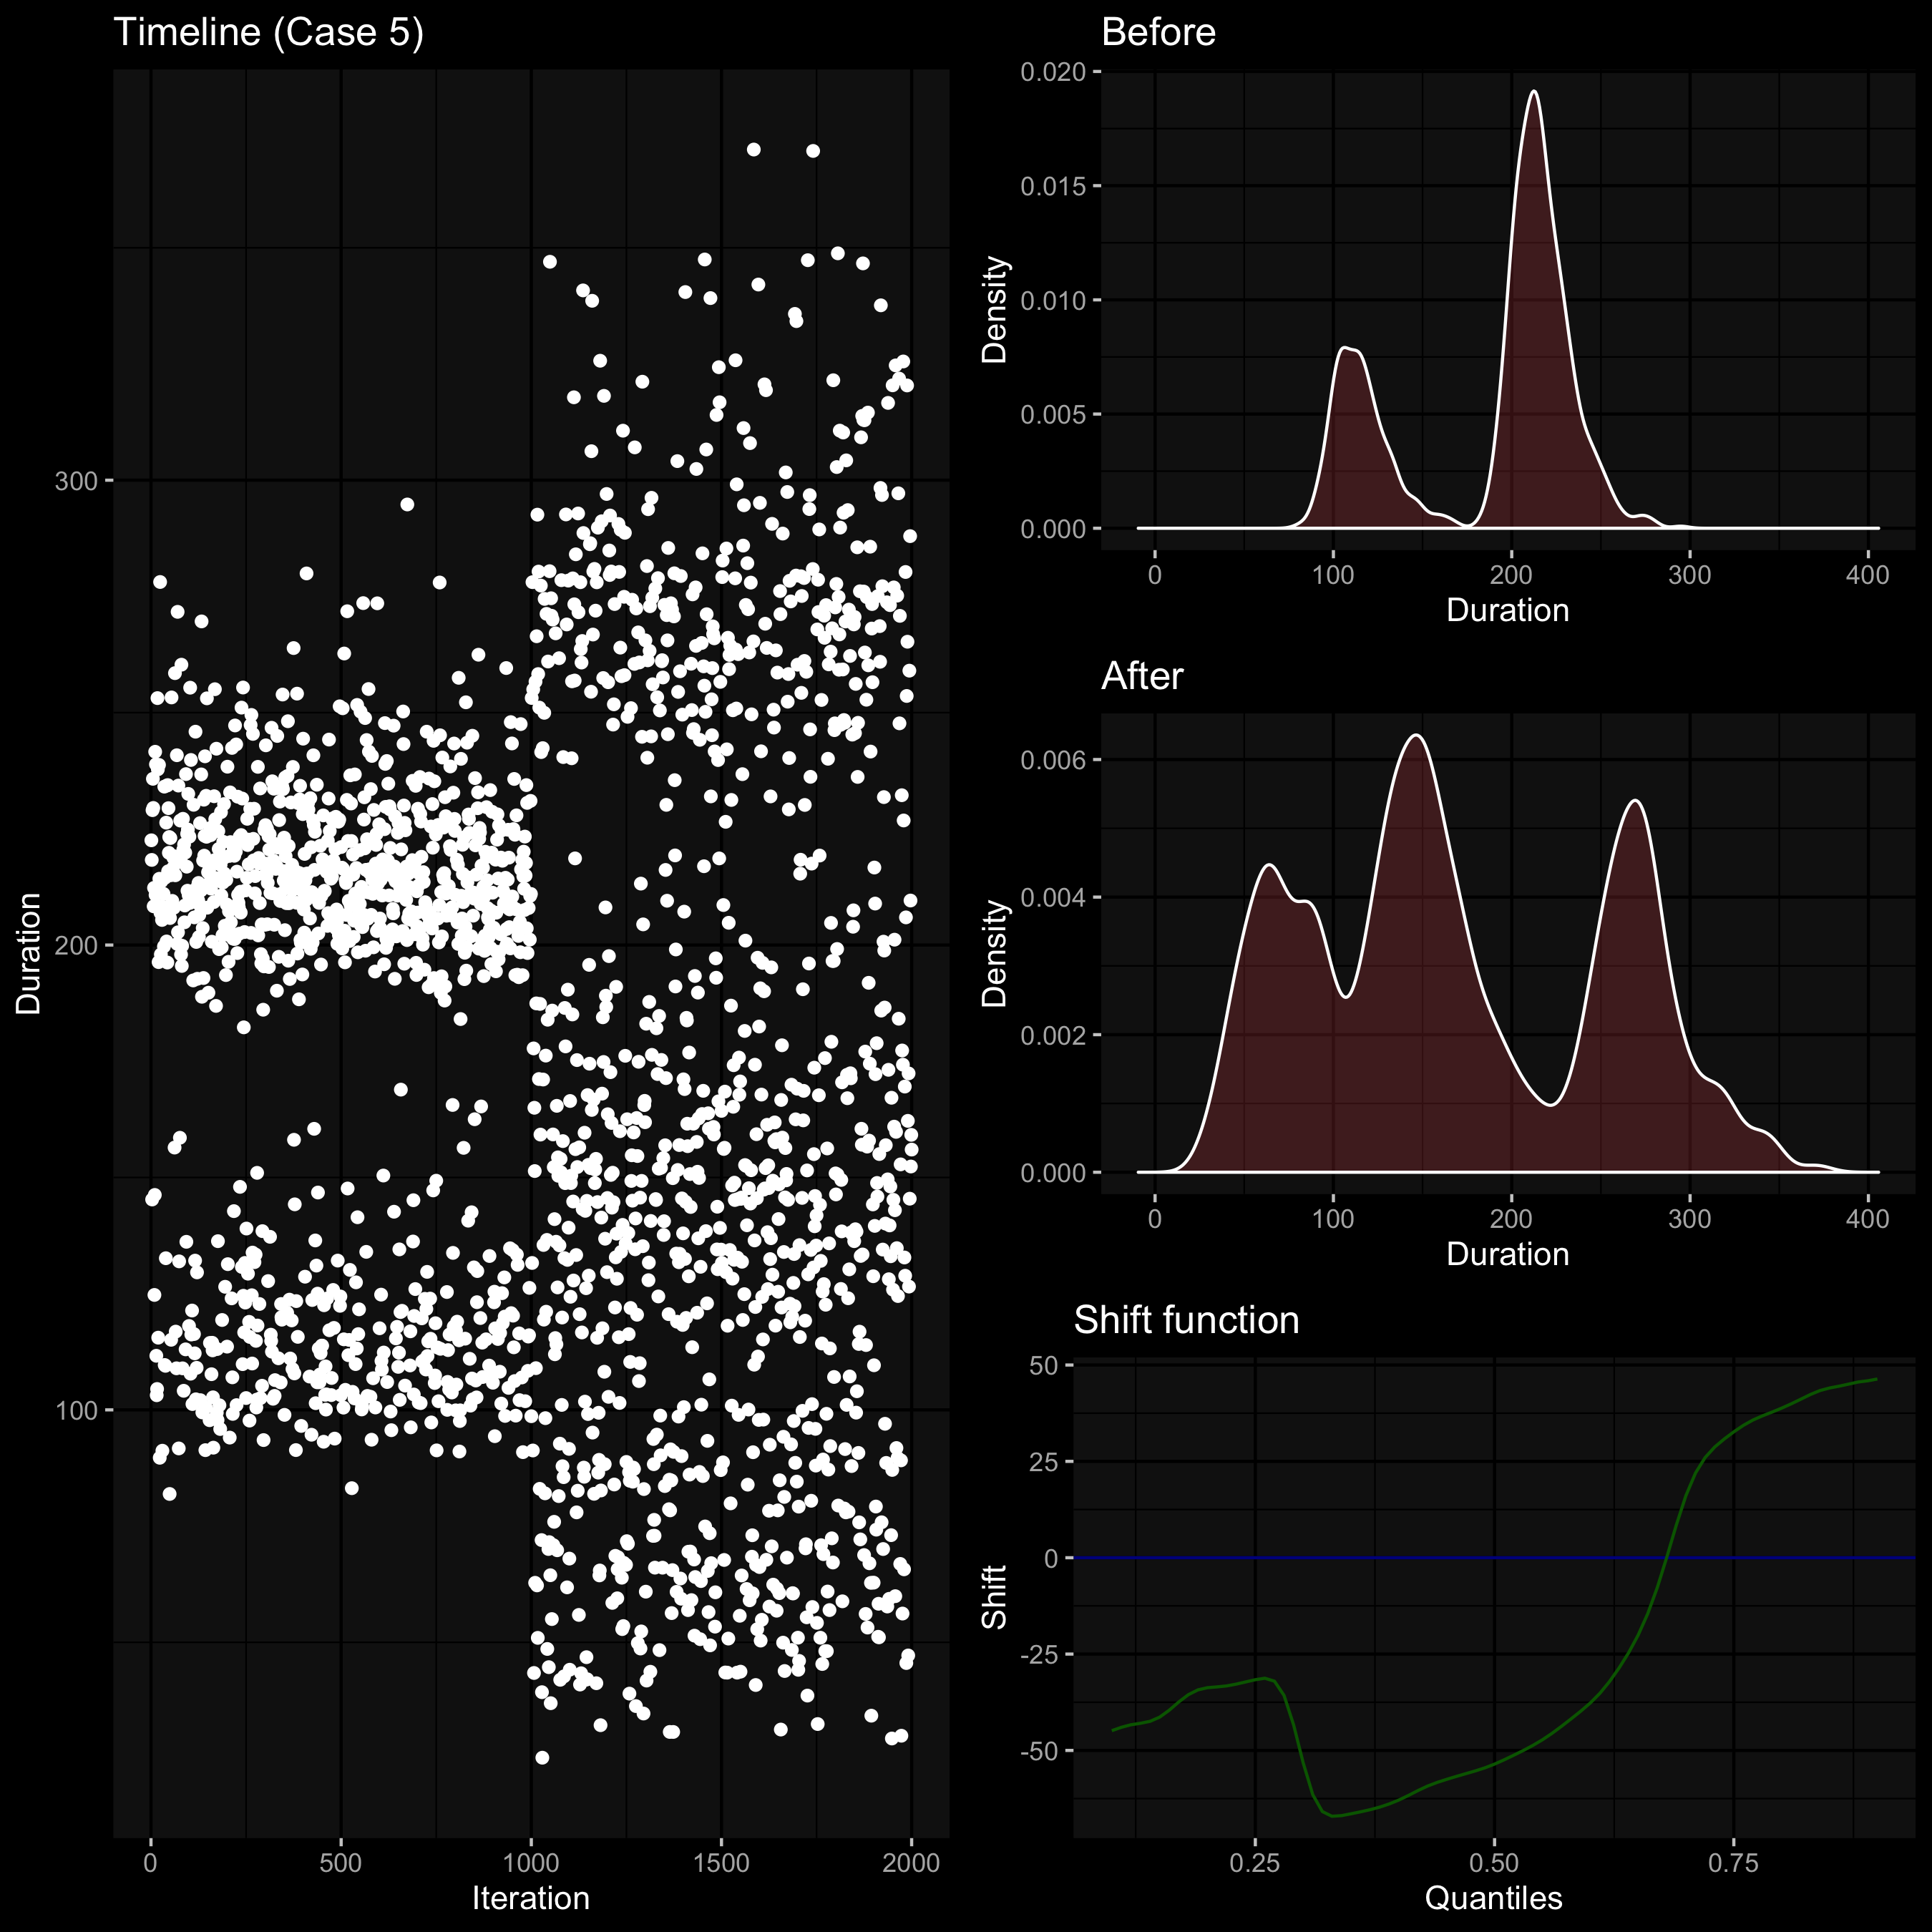
And here is a much more tricky case:
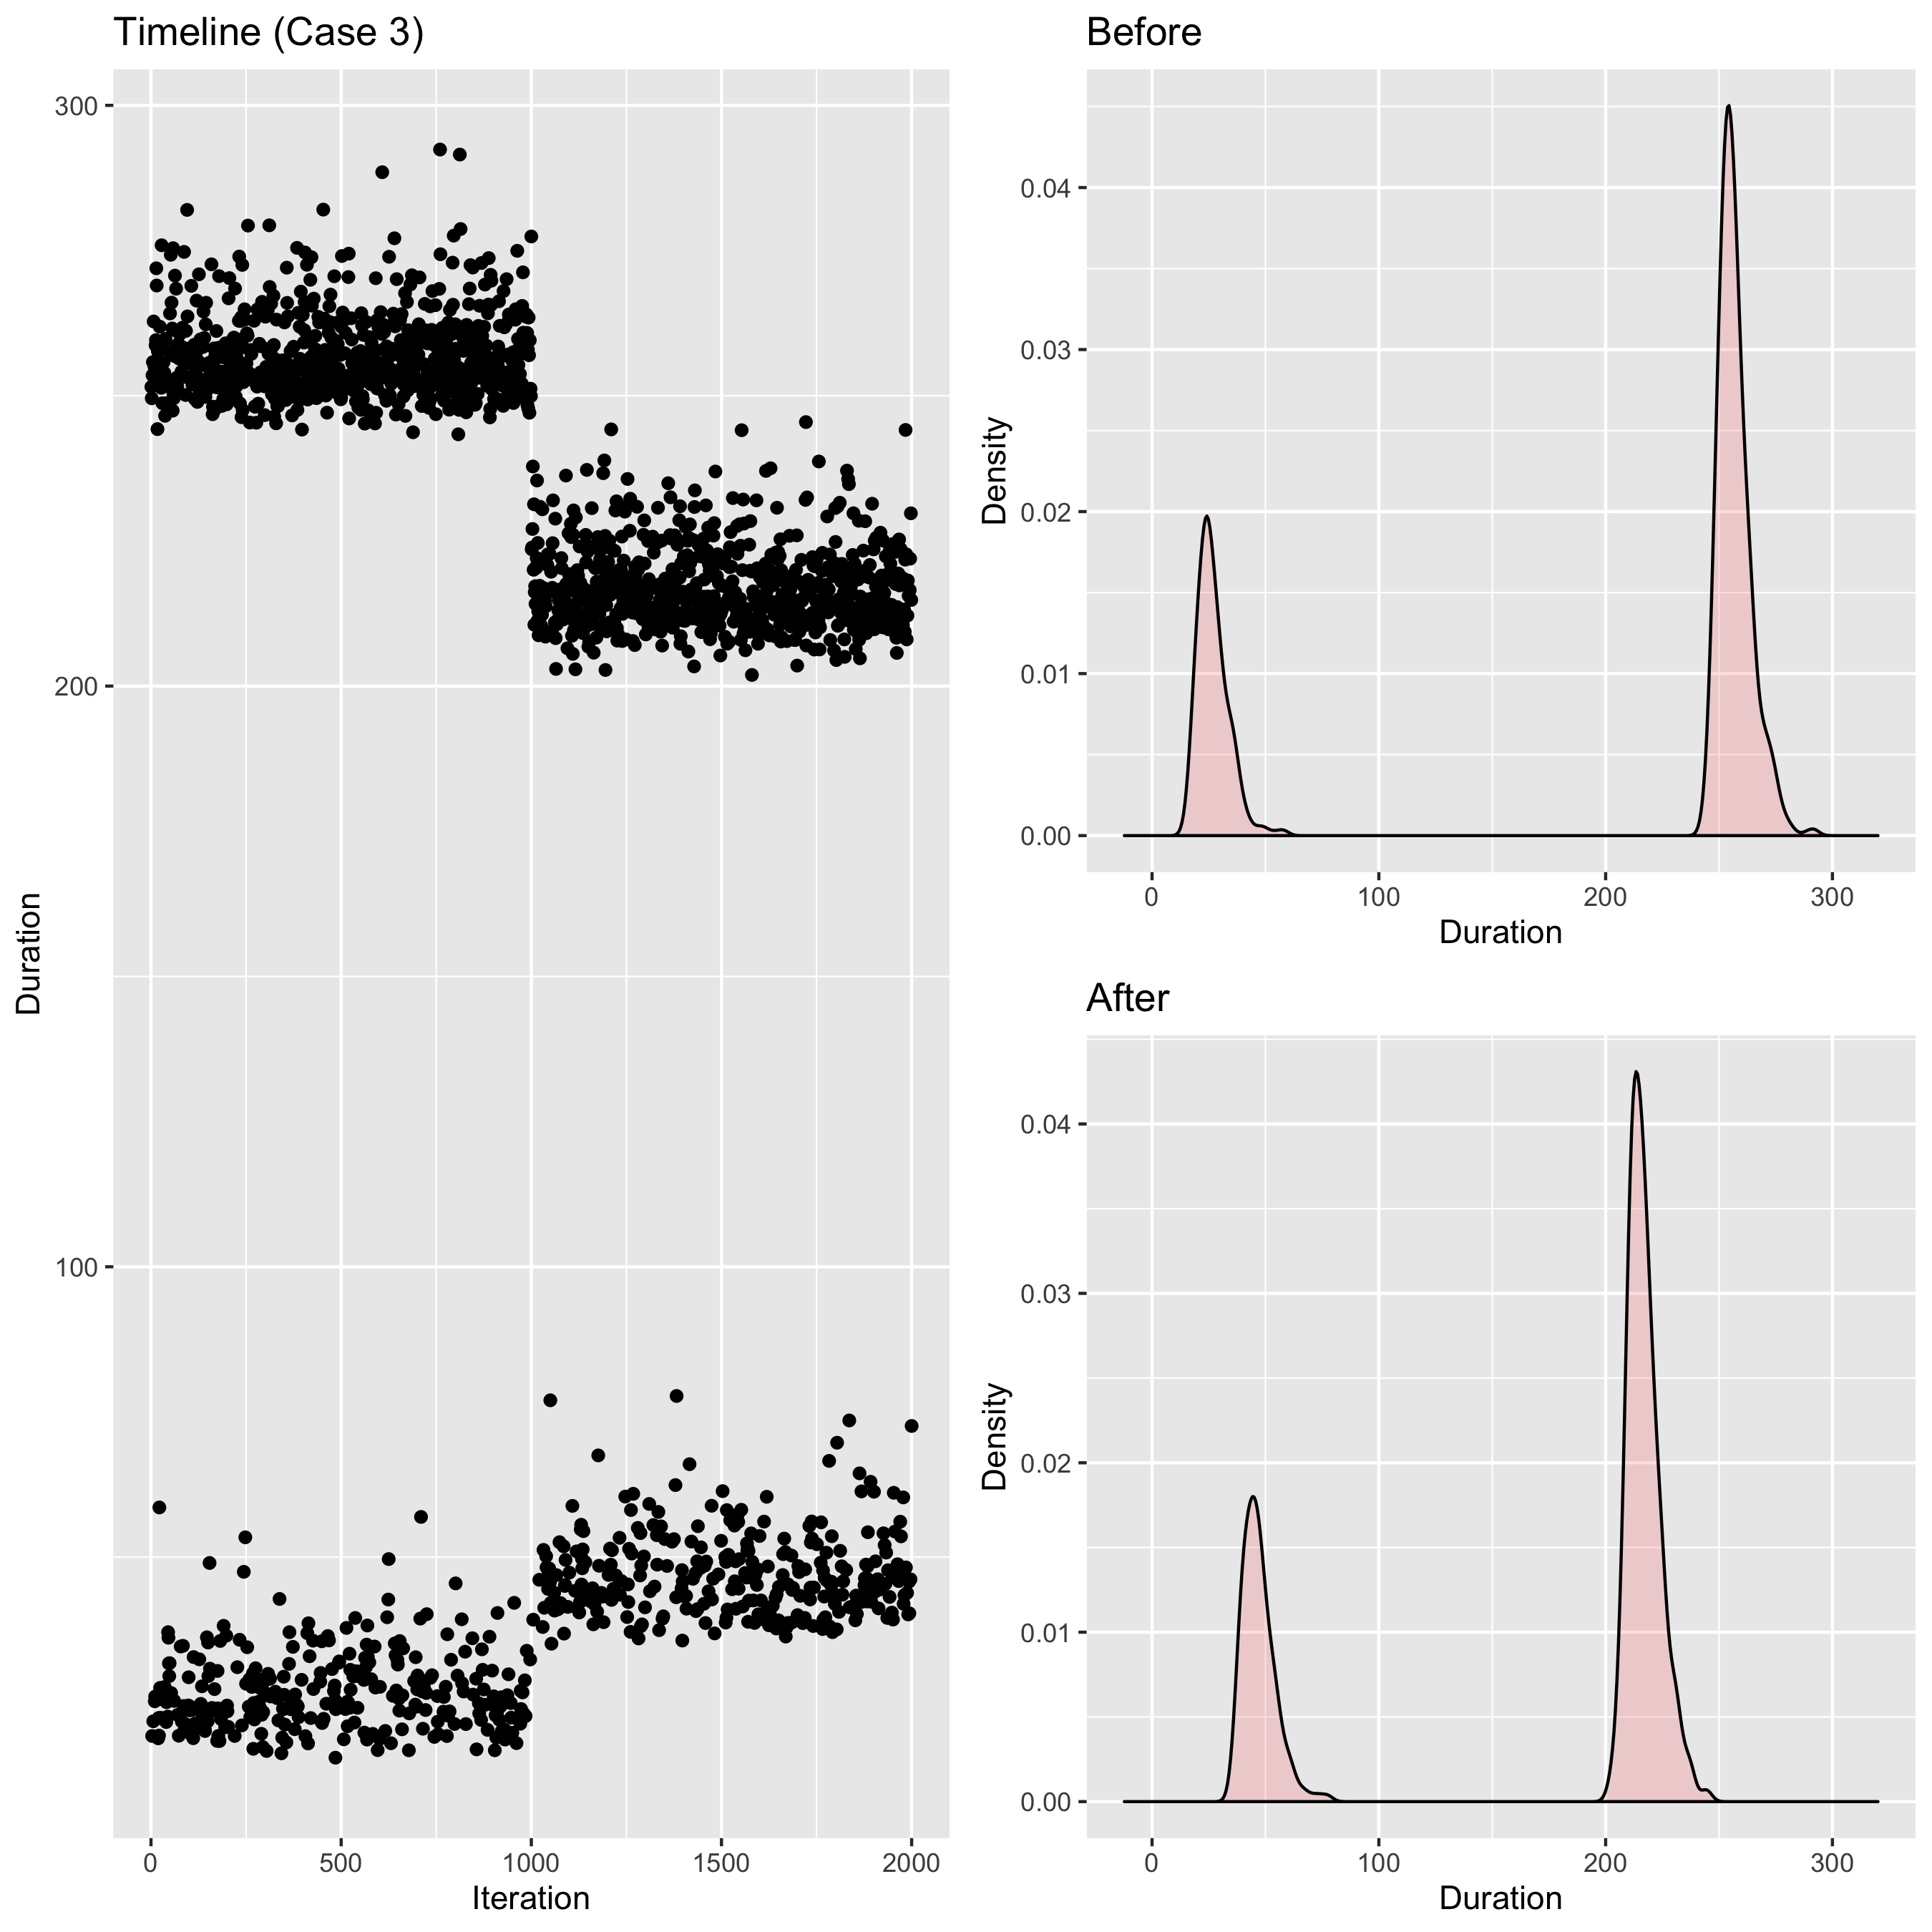
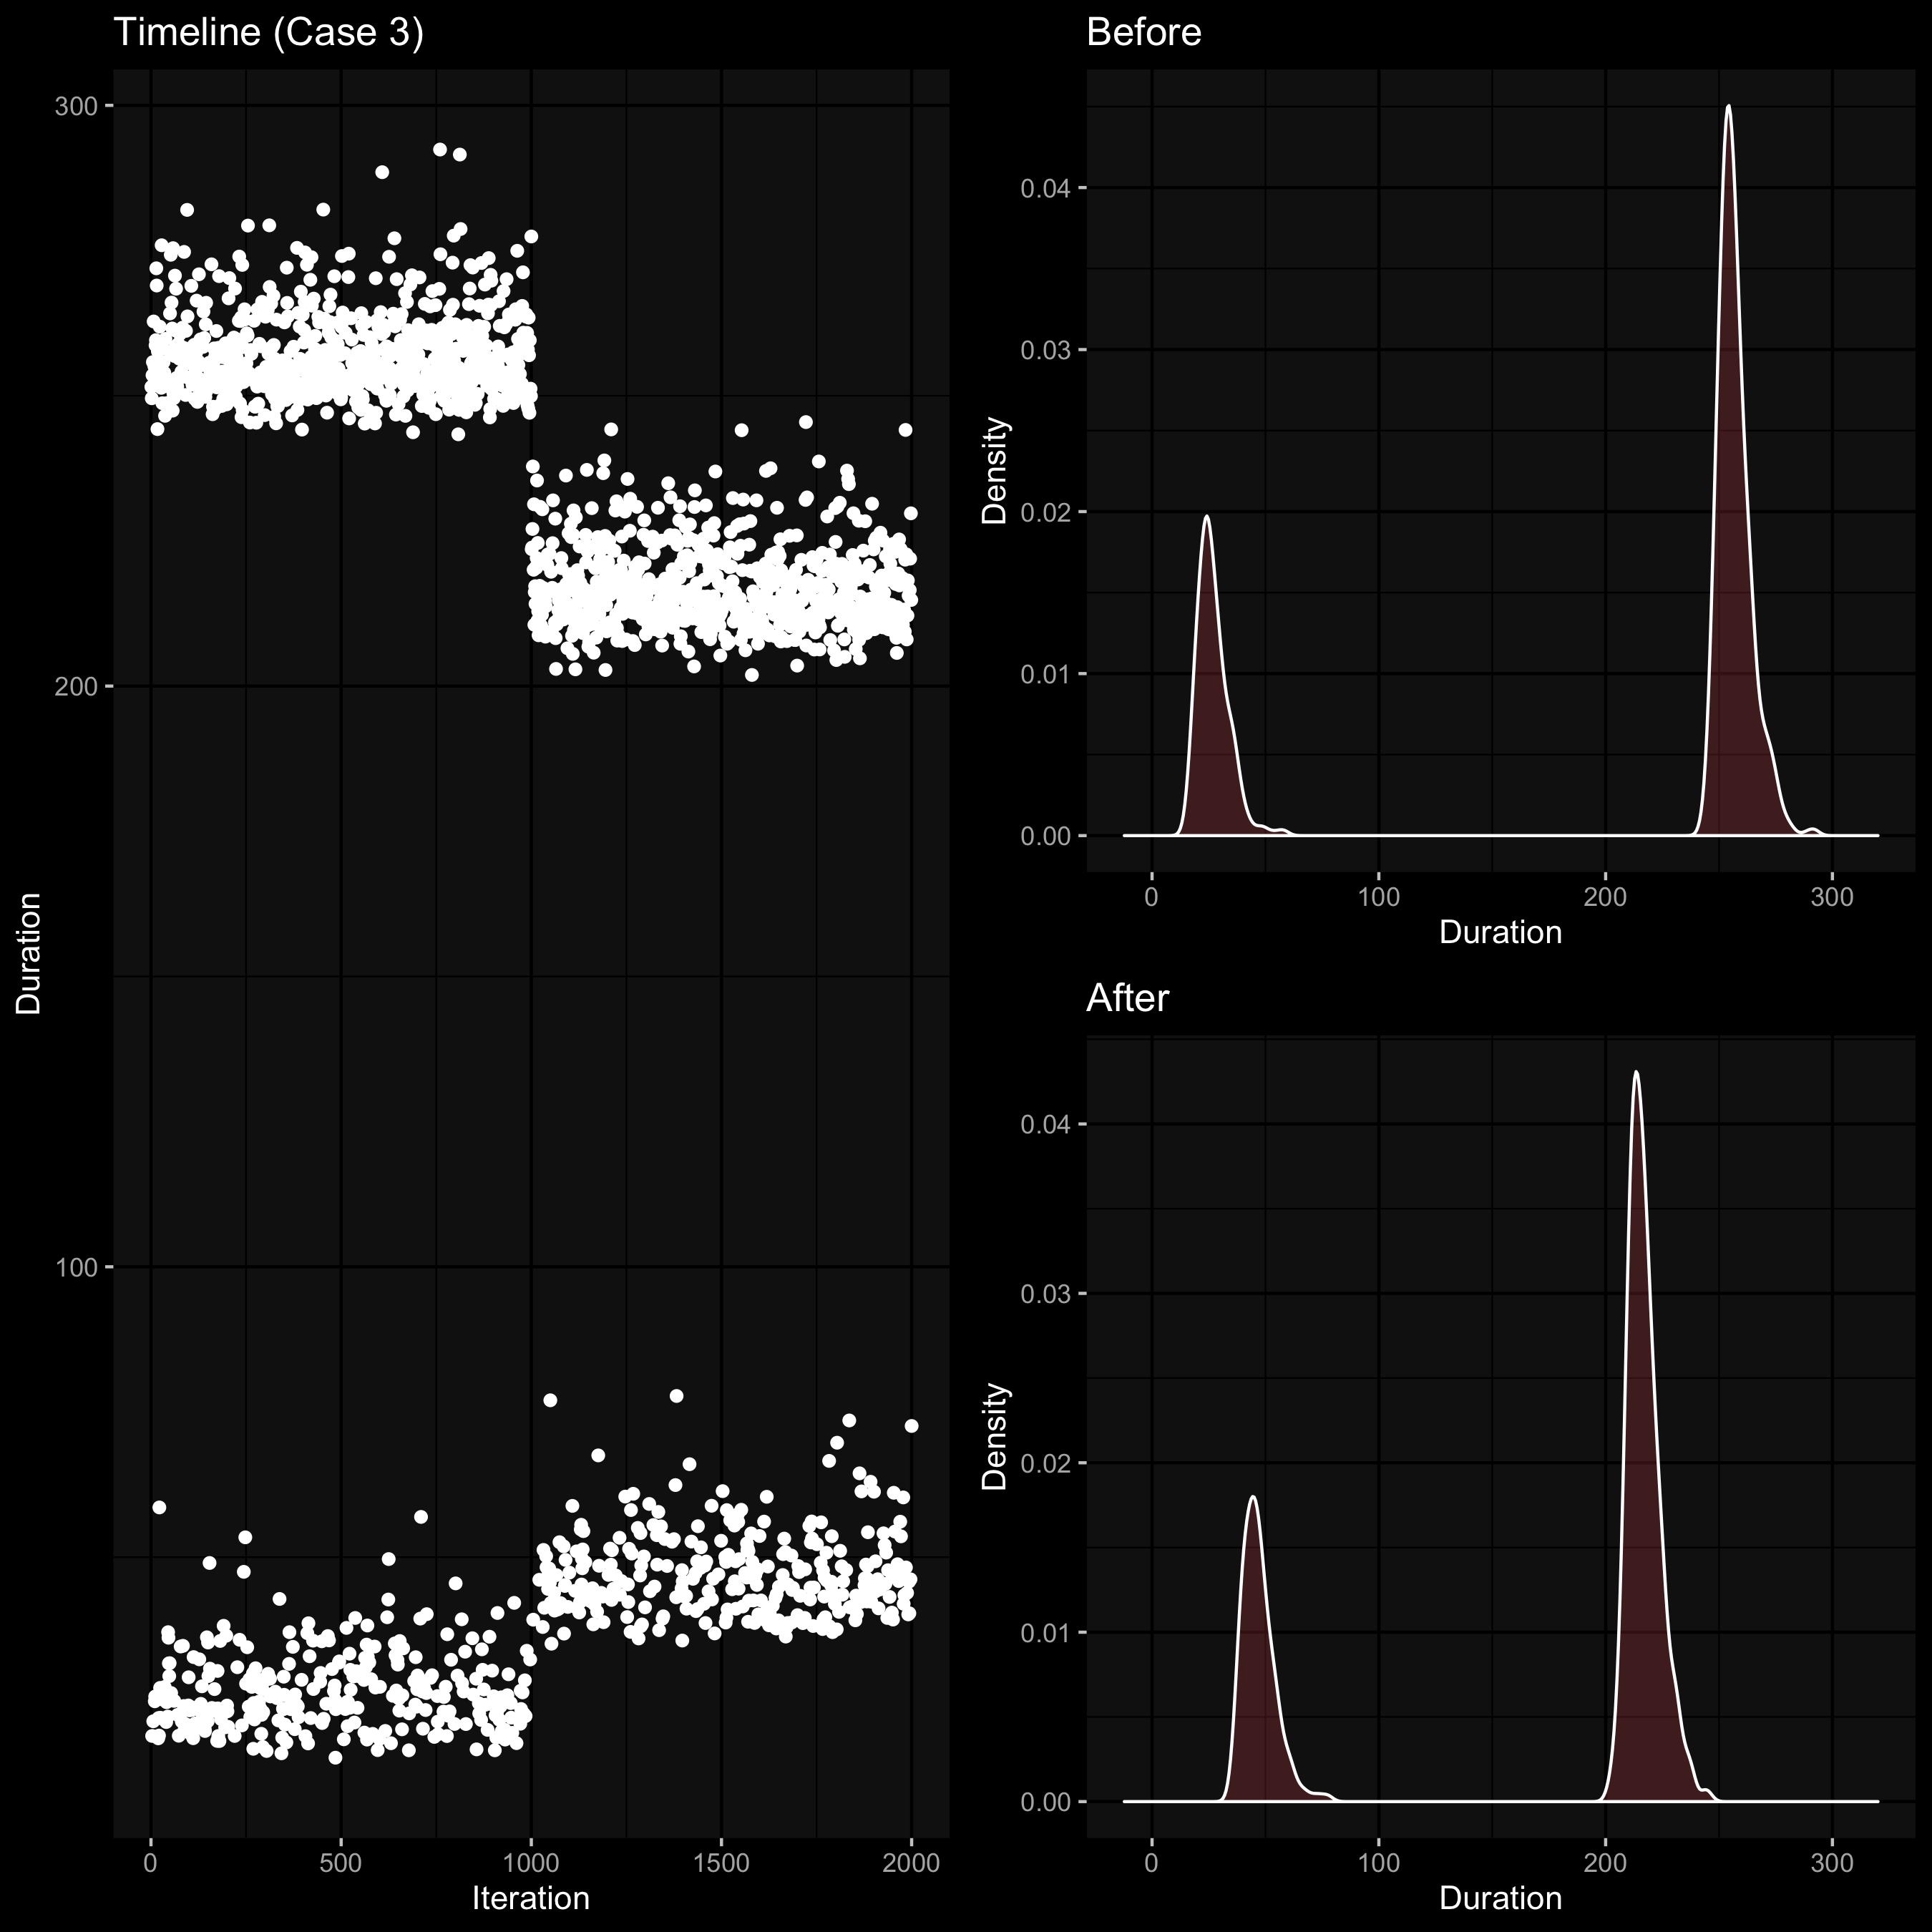
Here we also have a bimodal distribution; after the change, both modes moved: the left mode “moved right” and the right mode “moved left.” How should we describe the difference between these distributions now?
Shift function
One of my favorite ways to do it is the shift function that was introduced by Kjell Doksum in 1974 (check out these two papers: “Empirical Probability Plots and Statistical Inference for Nonlinear Models in the Two-Sample Case” and “Plotting with Confidence: Graphical Comparisons of Two Populations”). The idea is pretty simple: for each quantile, we should calculate the corresponding value for both distributions and find the difference between them. For the above three cases, the shift function plots will look like this:
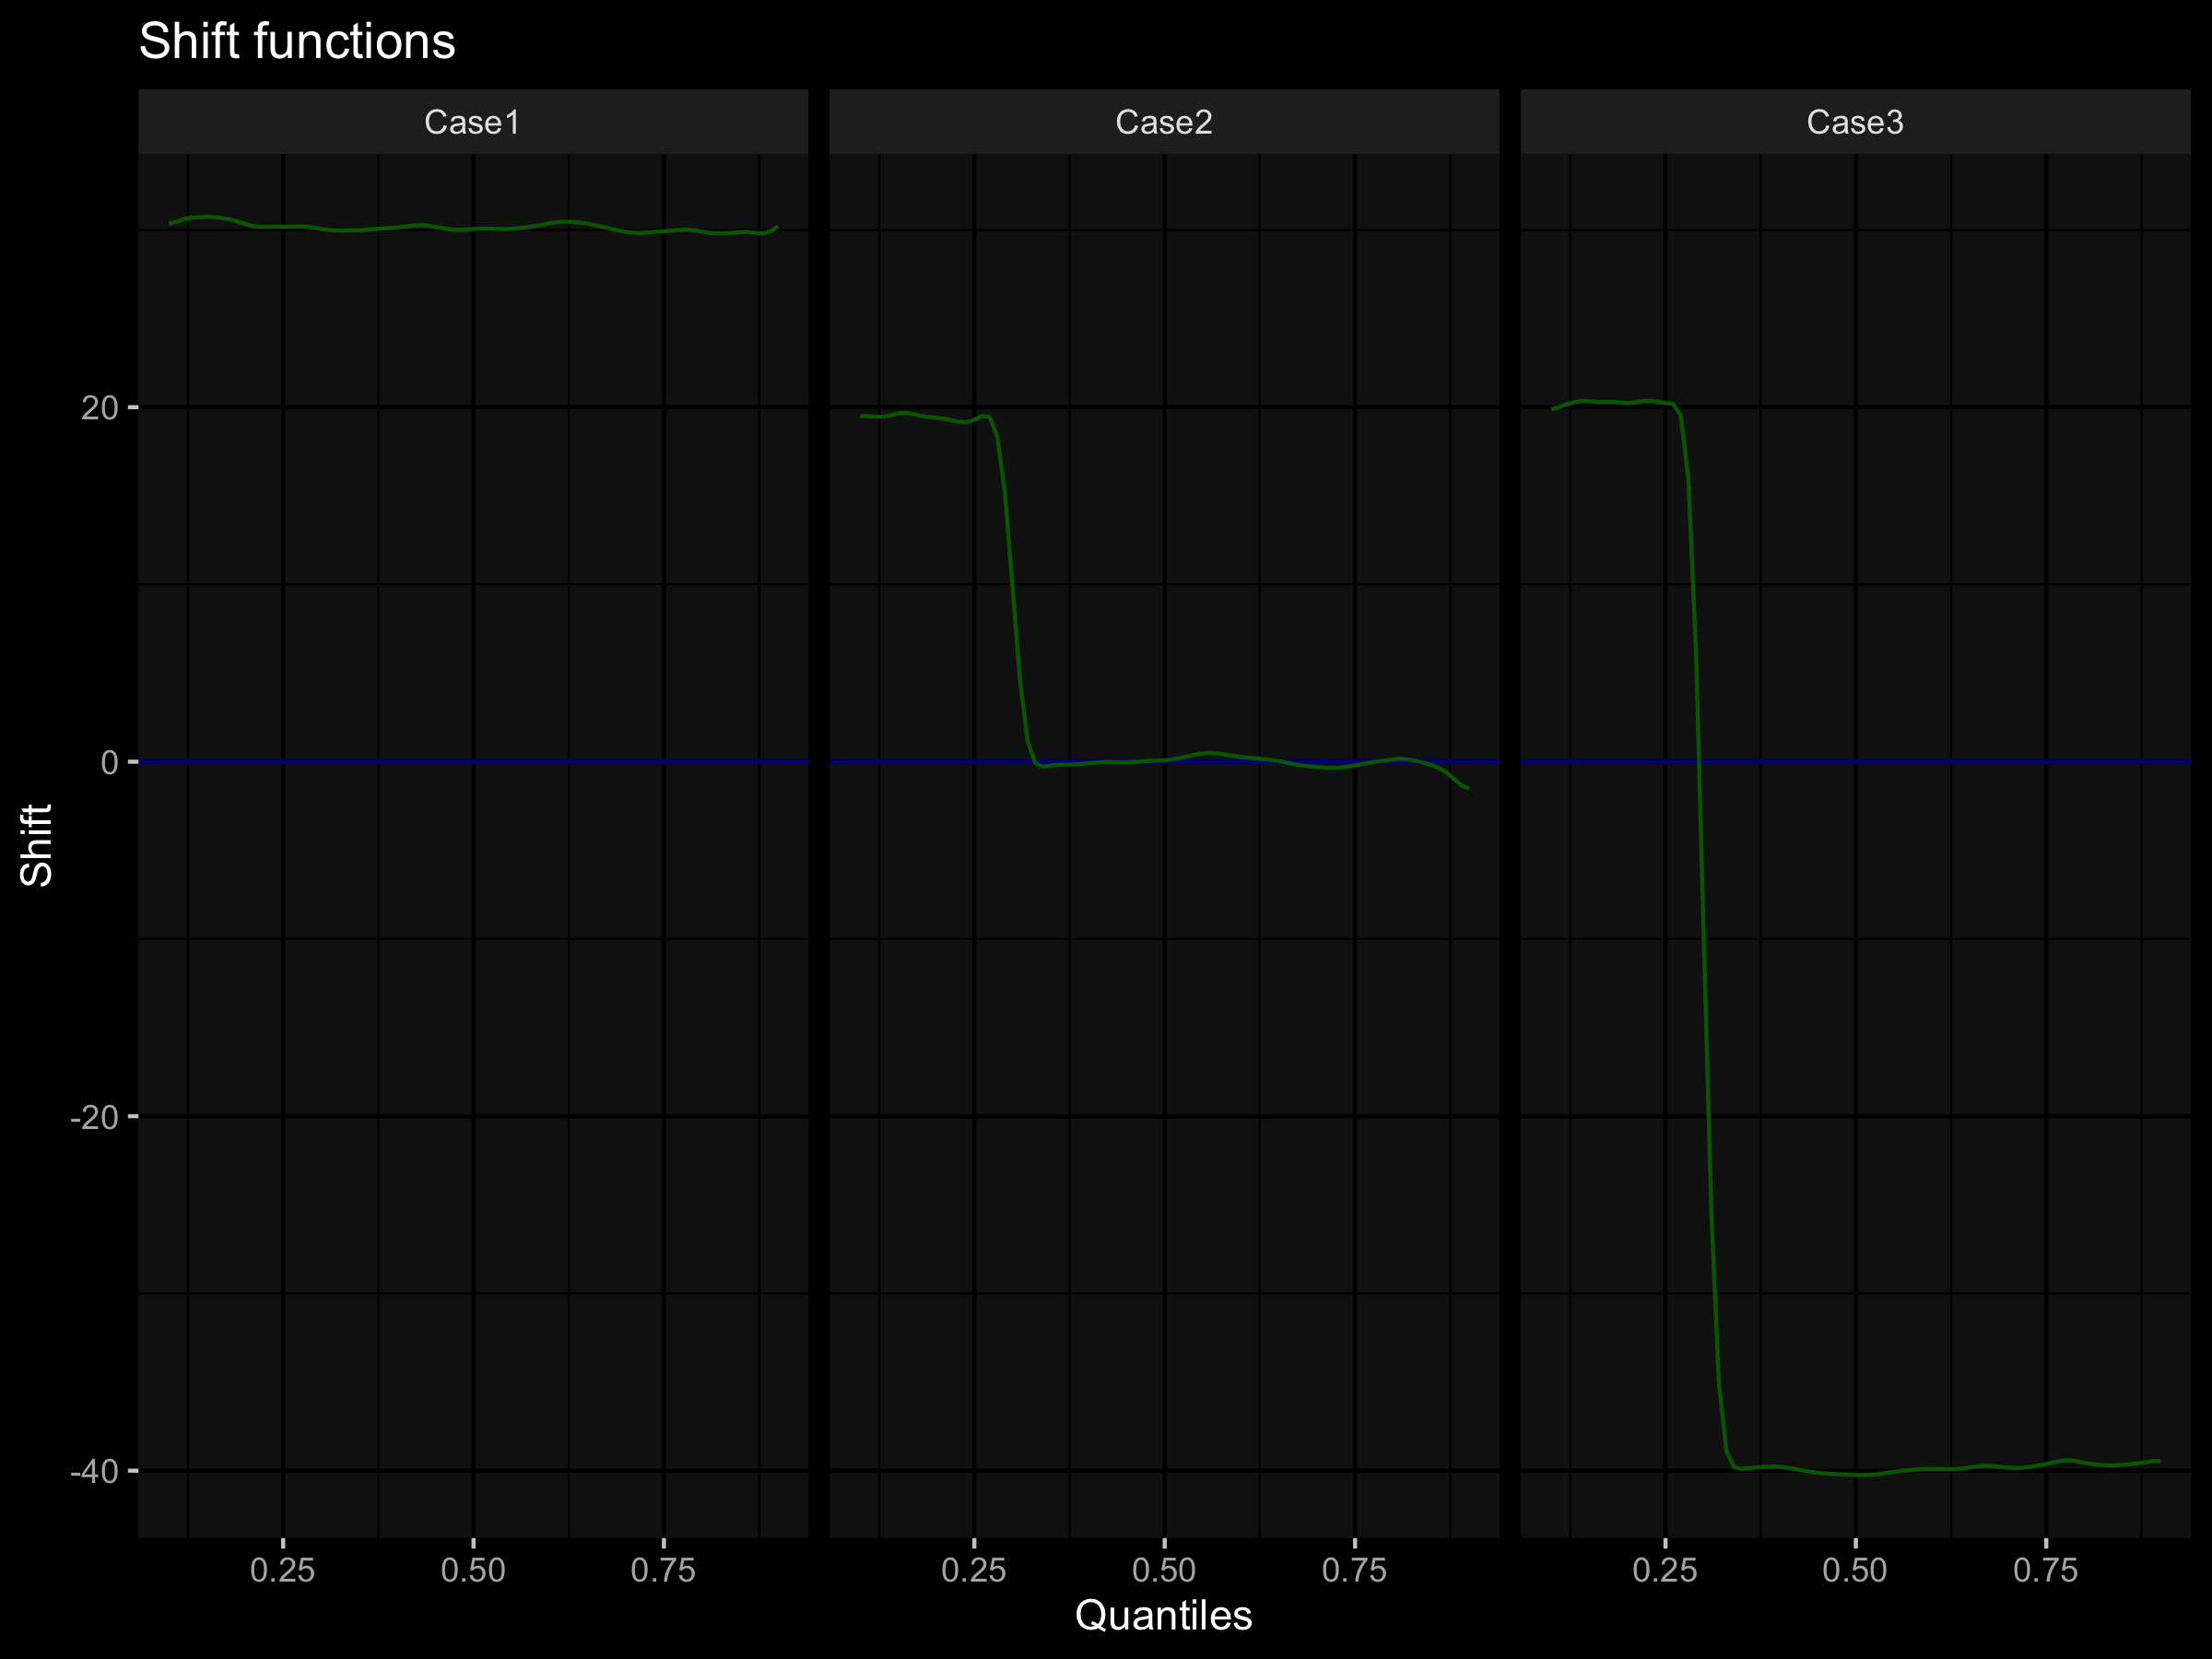
Based on these pictures, we can quickly come up with the following conclusions:
- Case 1. All of the quantiles were increased by ≈30.
- Case 2. Some small quantiles were increased by ≈20; other quantiles remained in place.
- Case 3. Some small quantiles were increased by ≈20; other quantiles decreased by ≈40.
As you can see, the shift function helps us to understand the changes for all of the individual quantiles.
Ratio function
By analog, we can evaluate the ratio function: instead of the difference, we should divide the value on each quantile for one distribution on the value of the same quantile for another distribution (check out this paper: “Quantile and quantile-function estimations under density ratio model”). It will look like this:

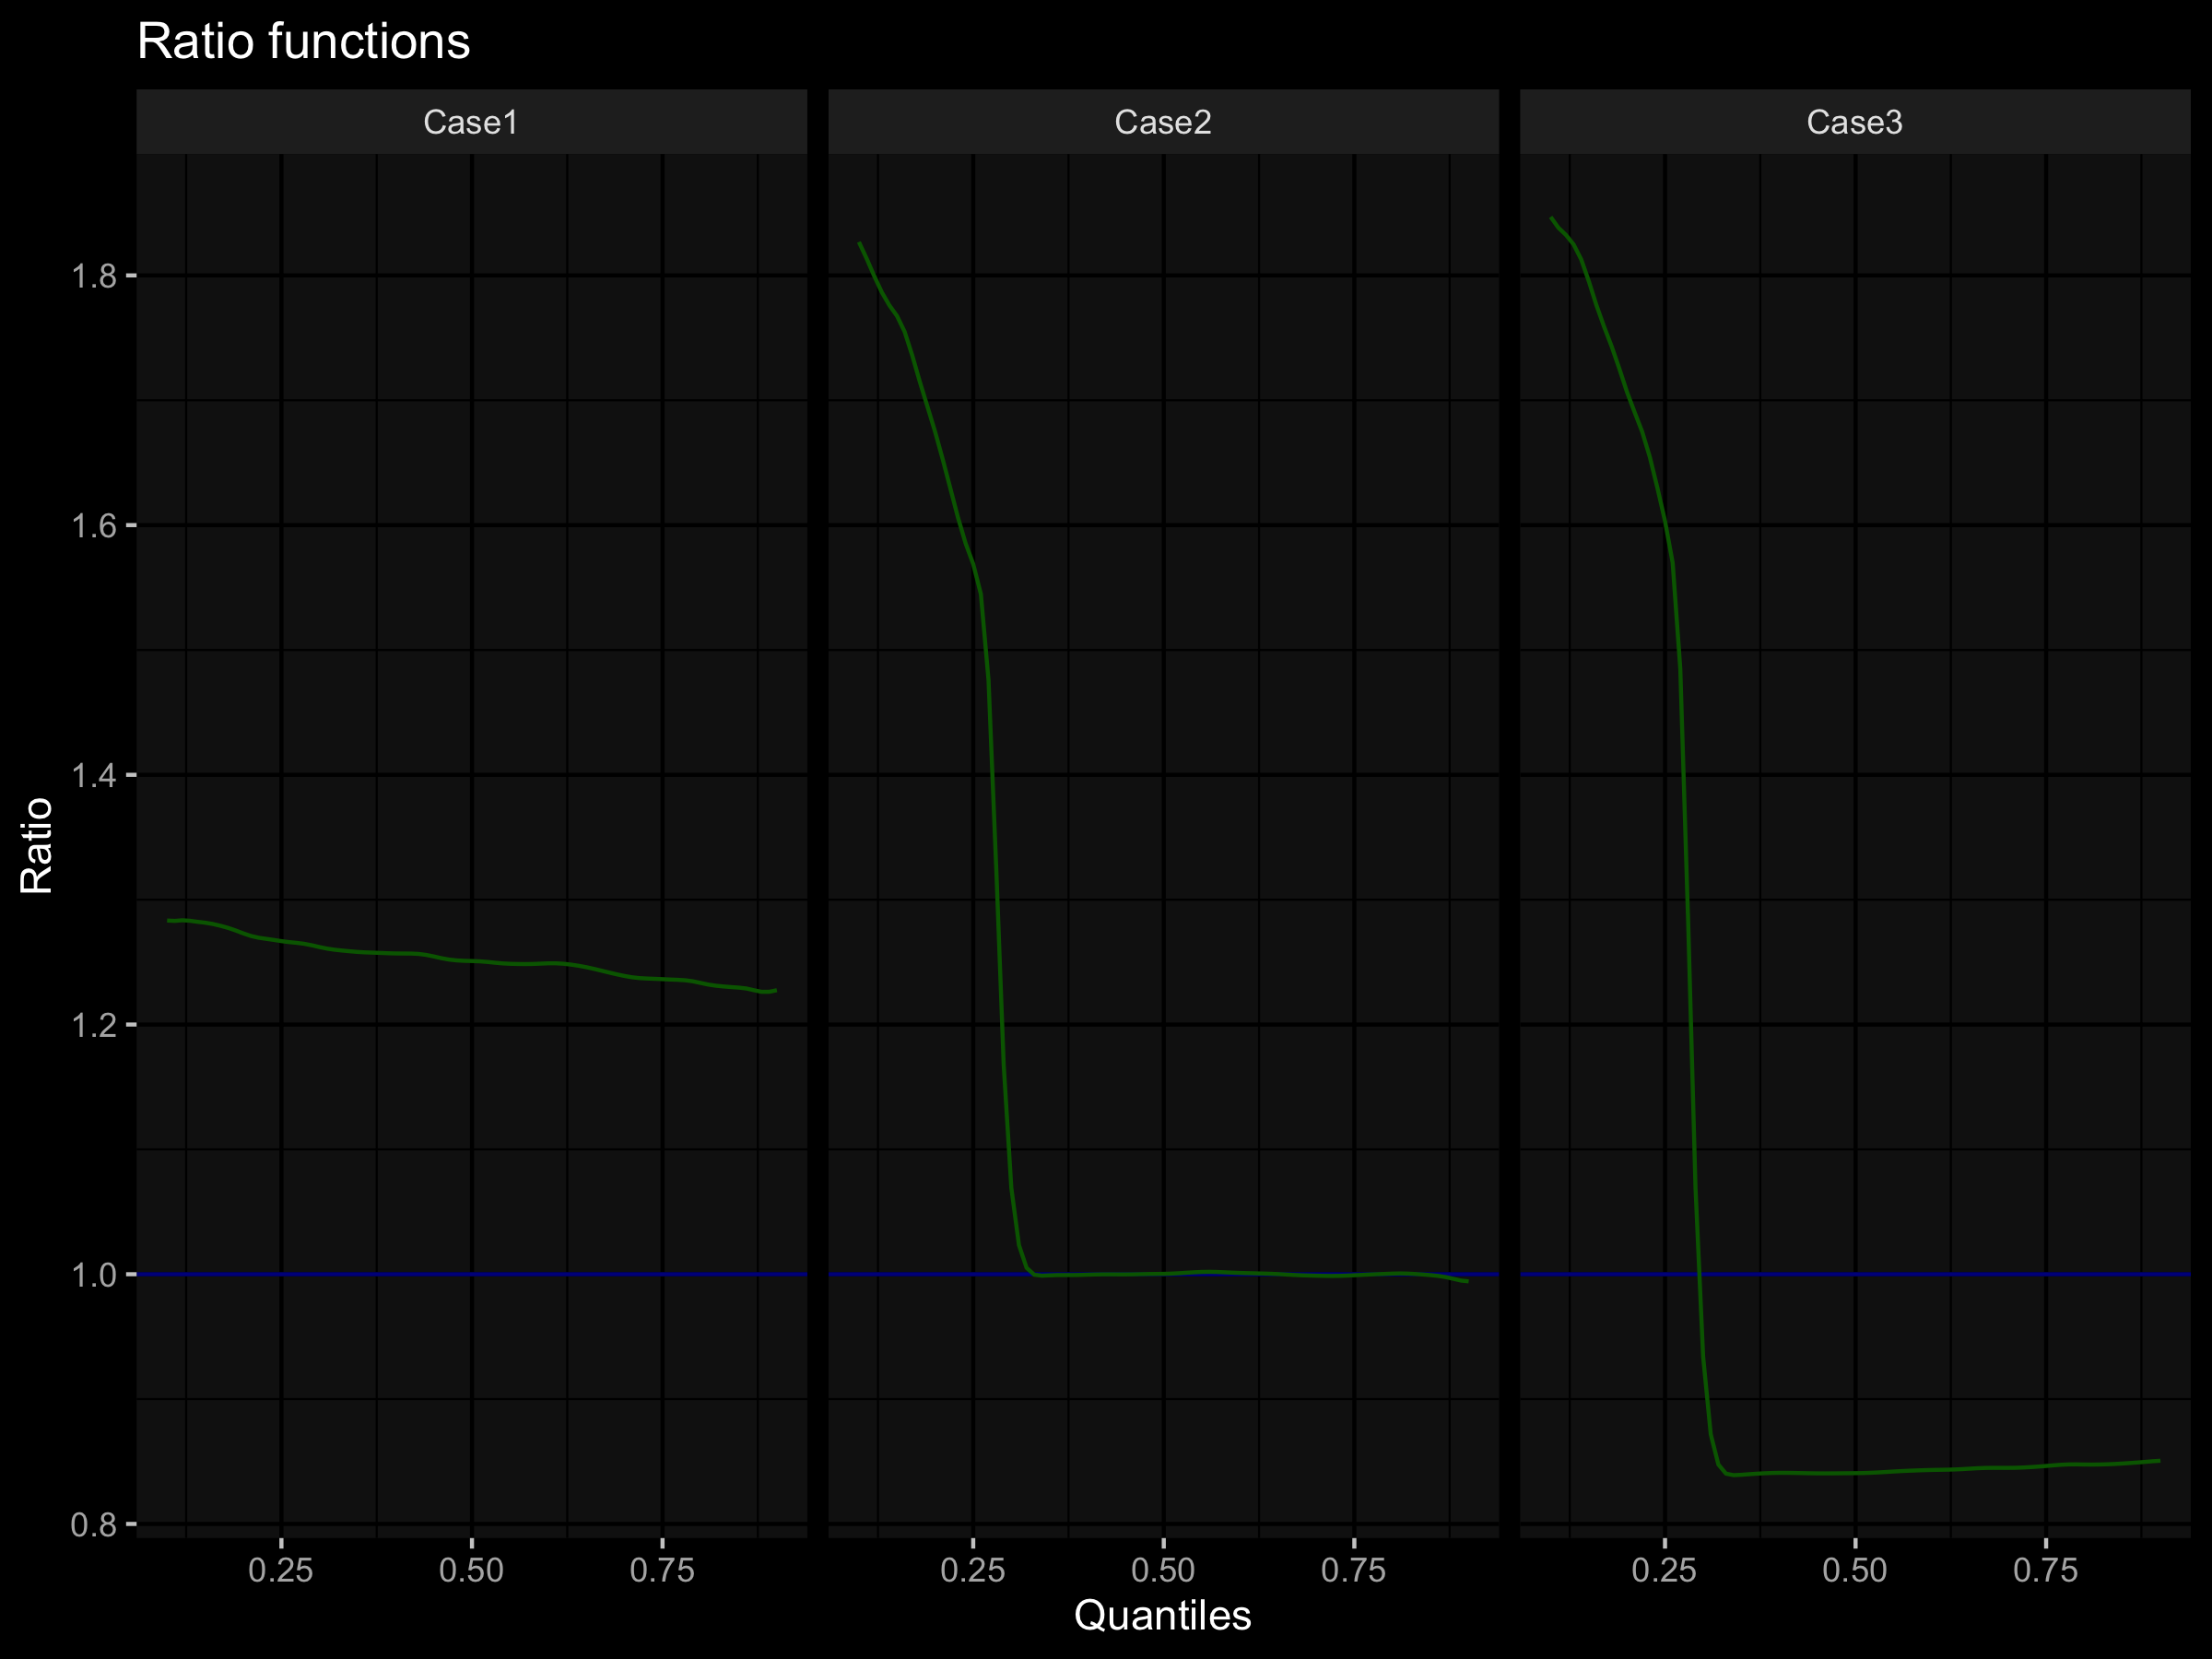
These pictures also allow us making conclusions about the presented distributions:
- Case 1. All of the quantiles were increased by ≈20-30%.
- Case 2. Some small quantiles were increased by ≈60-80%; other quantiles remained in place.
- Case 3. Some small quantiles were increased by ≈60-80%; other quantiles decreased by ≈15%.
More complicated cases
Let’s look at a few more complicated cases.


The last two cases are especially complicated because it’s not easy to say what’s going on there even if look at the density functions. Fortunately, the shift functions helps us to get more useful information from the data.
Implementation notes
I would like to highlight some important facts that can be useful if you decided to adopt the shift and ratio functions:
- The value of shift and ratio functions for extreme quantiles (≤0.1 or ≥0.9) may be very unstable
(the situation can be improved using the percentile bootstrap approach).
If you don’t care about extreme quantiles and want to describe the difference for the “main” part of your distributions, I recommend using the
[0.1, 0.9]quantile interval. - There are several ways to visualize shift functions. You can find an example of an alternative visualization here.
- There are several ways to calculate the quantile values for a sample. For example, in this blog post, I used the Harrell-Davis quantile estimator (see Harrell, F.E. & Davis, C.E. (1982) A new distribution-free quantile estimator. Biometrika, 69, 635-640; The Harrell-Davis quantile estimator by Guillaume Rousselet). Also, you can use the percentile bootstrap (see Wilcox, R.R. (2012) Introduction to robust estimation and hypothesis testing. Academic Press, Amsterdam; Boston; Wilcox, R.R. & Erceg-Hurn, D.M. (2012) Comparing two dependent groups via quantiles. J Appl Stat, 39, 2655-2664; the shift function: a powerful tool to compare two entire distributions by Guillaume Rousselet).
- Harrell-Davis quantile estimator provides not only approximated quantile values, but also confidence intervals.
Conclusion
The shift and ratio functions provide an easy way to describe the difference between two distributions. The shift function shows the absolute difference for each quantile; the ratio function shows the relative difference. The best thing about them is that they work pretty good even with multimodal distributions (it’s very important because normality is a myth).
You may need some time to get used to these charts and learn how to extract information from them quickly. But as soon as you learn, this visualization approach will become your faithful assistant which will allow you to compare distributions fast and easy way.