Measuring Performance Improvements in .NET Core with BenchmarkDotNet (Part 1)
A few days ago Stephen Toub published a great post at the Microsoft .NET Blog: Performance Improvements in .NET Core. He showed some significant performance changes in .NET Core 2.0 Preview 1 (compared with .NET Framework 4.7). The .NET Core uses RyuJIT for generating assembly code. When I first tried RyuJIT (e.g., CTP2, CTP5, 2014), I wasn’t excited about this: the preview versions had some bugs, and it worked slowly on my applications. However, the idea of a rethought and open-source JIT-compiler was a huge step forward and investment in the future. RyuJIT had been developed very actively in recent years: not only by Microsoft but with the help of the community. I’m still not happy about the generated assembly code in some methods, but I have to admit that the RyuJIT (as a part of .NET Core) works pretty well today: it shows a good performance level not only on artificial benchmarks but also on real user code. Also, there are a lot of changes not only in dotnet/coreclr (the .NET Core runtime), but also in dotnet/corefx (the .NET Core foundational libraries). It’s very nice to watch how the community helps to optimize well-used classes which have not changed for years.
Now let’s talk about benchmarks. For the demonstration, Stephen wrote a set of handwritten benchmarks. A few people (in comments and on HackerNews) asked about BenchmarkDotNet regarding these samples (as a better tool for performance measurements). So, I decided to try all these benchmarks on BenchmarkDotNet.
In this post, we will discuss how can BenchmarkDotNet help in such performance investigations, which benchmarking approaches (and when) are better to use, and how can we improve these measurements.
How can BenchmarkDotNet help?
If you have spent less than a week studying a benchmark result, it is probably wrong.
— System Performance. Enterprise and the Cloud.
The first question of the post: are Stephen’s benchmarks valid? Well… Yes and no.
Yes,
we can see code which measures performance,
it prints some performance numbers,
the results are correct,
it helps to make the right conclusions.
Probably, when you see difference like 7.7sec vs 0.013sec,
you don’t need a specialized benchmarking library: it’s obvious that the second benchmark is faster.
So, it’s ok to use such approach for getting quick raw results.
However, in my world, a benchmark is more than just a program which somehow measures performance and prints some numbers. I think that a benchmark is a performance investigation or a performance research (of course, you may have a different opinion). For such investigation, I recommend using a powerful .NET library for benchmarking: BenchmarkDotNet. Disclaimer: I’m the maintainer of this library, and my opinion may be biased. I started it several years ago as a pet project, but now it’s very popular tool: BenchmarkDotNet has a lot of happy users, it has 2000+ stars on GitHub, and it’s supported by the .NET Foundation. A lot of popular projects use it, also it’s used in some of the coreclr discussions and corefx discussions.
If you are already a BenchmarkDotNet user, you can skip this section and go to the benchmarks. If you didn’t use BenchmarkDotNet before, I try to explain why it can be a good choice for performance measurements. Basically, BenchmarkDotNet solves the following two problems:
- Getting results you can trust.
When I look at a microbenchmark with
30%performance difference, I always ask myself: can I trust it? Sometimes, we really have30%difference. Sometimes, it’s just a statistical error due to a huge standard deviation. How can we be sure? Probably we have to warmup the benchmark. Probably we have to do more iterations. Probably JIT applies some crazy optimizations here and destroys our artificial benchmarks. There are a lot of problems in the world of microbenchmarks, you can not be sure that everything is fine without hours of additional checks even for a simple case. - Comfortable research. As I said before, benchmarking is a kind of performance research. You can’t make any conclusions only by a single set of measurements: you always have to think about the performance space (source code + input data + environment). Recently, I wrote a few post with performance exercises (Minimum and Division) which demonstrate how hard it can be even in super simple cases. Usually, benchmarking is not a one-time activity. A good performance engineer always asks himself: what if we rewrote code in this way, what if we take a bigger sample, what if we run it on another OS, what if… When you start to work with a benchmark and check different hypotheses, you also start to invent your own benchmarking infrastructure. Sometimes you have to spend hours or days debugging this infrastructure instead of the actual performance investigation.
Let’s talk about how can BenchmarkDotNet help you.
Precision
When someone run a benchmark 10 times, I always ask: why 10? Why not 5? Or 15? Or 100000? Maybe you didn’t execute the benchmark enough times for getting a good precision level. Or maybe you did too many iterations, and you have to wait a lot longer without tangible precision improvements. BenchmarkDotNet has set of heuristics for automatic choosing the best amount of benchmark repetition (of course you can specify it manually if you want). Basically, BenchmarkDotNet tries to get the required confidence level (+some magic for corner cases). Probably, it not a perfect solution for all benchmarks in the world, but it works pretty well for the vast majority of cases: you will get decent results and you will not wait too long (from some moment, additional iterations practically do not improve the benchmark accuracy).
Also, with BenchmarkDotNet you can usually skip almost all of the benchmarking routine. How many times should I repeat this method which takes a few nanoseconds? Should I care about the benchmarking infrastructure overhead? Can Roslyn/RyuJIT/CPU apply some tricky optimization and spoil the results? Is it possible that one benchmark method will be inlined and other will be not inlined? Should we care about hardware timers? I also have a few post about internals of Stopwatch and DateTime which show some important problems with timers.
You can’t imagine how many problems are there. Some of them are related to “features” of modern CPUs. Some of the Intel CPU optimizations are even not covered in official documentation (but they still can spoil your results). I spent a huge amount of time on reverse engineering trying to create workarounds for these “features” (one day I’ll write a post about it). BenchmarkDotNet has a set of tricks, hacks, and workarounds which protect you from dozens of potential troubles. Of course, you can be lucky and avoid all these problems without the corresponded knowledge. But again: how can you be sure?
Environments
In the original post, Stephen compare .NET Core 2.0 Preview 1 and .NET Framework 4.7 (with RyuJIT-x64).
I believe that he ran each benchmark twice: on each runtime.
BenchmarkDotNet has special objects — Jobs which help you to compare several environments at once.
Basically, you can define a config for your benchmark:
public class MyConfig : ManualConfig
{
  public MyConfig()
  {
    Add(Job.Default.With(Runtime.Clr).With(Jit.RyuJit).With(Platform.X64));
    Add(Job.Default.With(Runtime.Core).With(CsProjCoreToolchain.NetCoreApp20));
  }
}
RyuJIT-x64 is not the only JIT in the full .NET Framework.
Some people still use LegacyJIT-x64 (because not all of the enterprise companies are ready for switching to a new JIT-compiler without a detailed performance research).
If you develop x86 application, you use LegacyJIT-x86.
In BenchmarkDotNet, you can just add a few additional jobs:
Add(Job.Default.With(Runtime.Clr).With(Jit.LegacyJit).With(Platform.X64));
Add(Job.Default.With(Runtime.Clr).With(Jit.LegacyJit).With(Platform.X86));
Also it would be nice to check the mono performance:
Add(Job.Default.With(Runtime.Mono));
Wait!
I have two different mono on my Windows machine: x86 and x64.
I want to check both versions!
How can I do it?
Easy peasy:
Add(Job.Default.With(new MonoRuntime("Mono_x64", @"C:\Program Files\Mono\bin\mono.exe")));
Add(Job.Default.With(new MonoRuntime("Mono_x86", @"C:\Program Files (x86)\Mono\bin\mono.exe")));
Also I want to compare .NET Core 2.0 Preview 1 with .NET Core 1.1:
Add(Job.Default.With(Runtime.Core).With(CsProjCoreToolchain.NetCoreApp11));
Add(Job.Default.With(Runtime.Core).With(CsProjCoreToolchain.NetCoreApp20));
There are a huge amount of different environments. You can’t make any conclusion about C# performance based only on a single runtime (remember that C# is just a language, it’s an abstraction; it hasn’t such property as “performance”; “performance” is a property of a runtime.) If you want to get the results which you can apply, you have to check different configurations. BenchmarkDotNet also helps you to check a lot of additional things like GC settings (Server/Workstation, On/Off concurrent GC, and so on) and benchmark mode parameters (e.g. you can automatically throw away all the outliers or include them in the final results).
The main important fact here: you can define a config once and use it everywhere. You can get the summary table with all results by a single click: you shouldn’t manually run the program in all environment after each change.
Automation and analysis
BenchmarkDotNet has a lot of additional tools for performance engineers.
For example, if you want to enumerate a parameter (e.g. size of an array), you can use Params:
int[] a;

[Params(1, 100, 100_000, 10_000_000)]
public int N;

[GlobalSetup]
public void Setup()
{
  a = new int[N];
}
Of course, you can do it manually. But you can spent a lot of time on this, make a mistake, try to debug a mistake, collect all the result in a table, prettify the console output, spent more time, and so on. All the basic stuff for such kind of tasks is already implemented.
Also BenchmarkDotNet automatically warn you if something goes wrong with results, it calculates statistics for you, draw beautiful distribution plots, export the results to markdown/xml/json/your_favorite_format, check memory usage and an amount of allocations, and so on.
What are we going to do?
Once again: if you don’t use BenchmarkDotNet, it doesn’t mean that your results are incorrect. Also, if you use BenchmarkDotNet, it doesn’t mean that you have correct results. It’s not a magic wand which will automatically fix all your benchmarks. It’s just a handy tool which helps you: it allows focusing on a problem instead of benchmarking stuff.
So, today I’m going to reimplement benchmarks of Stephen Toub with the help of BenchmarkDotNet and share my results. I hope you know that you shouldn’t trust a guy from the internet who present any performance measurements. There is a quote which I really like:
There are lies, damn lies and then there are performance measures.
— Anon et al., “A Measure of Transaction Processing Power”
So, I prepared a GitHub repo (AndreyAkinshin/StephenToubBenchmarks) for you which contains almost all the samples. You can download it and try it on your own machine. You can modify the source code in any way and check the new results (it’s a good exercise if you want to improve your performance skills). Write you own benchmarks. Check out the performance of your production code on different runtimes. Share and discuss results: it will help you and others to better understand what’s going on under the hood of the .NET runtime. Also, this is a common situation these days when some guy read such discussion and will go to improve coreclr or corefx on GitHub. Remember that performance is a very tricky subject and you will not get good knowledge based on a few blog posts without own experiments.
Preparation
Let’s check how it works ont only on the .NET Core 2.0 Preview 1 and .NET Framework 4.7, but also on Mono 5.0.1.
Also, we would like to look at the distribution, so we add RPlotExporter:
public class MainConfig : ManualConfig
{
  public MainConfig()
  {
    Add(Job.Default.With(Runtime.Clr).With(Jit.RyuJit).With(Platform.X64).WithId("NET4.7_RyuJIT-x64"));
    Add(Job.Default.With(Runtime.Mono).WithId("Mono5.0.1-x64"));
    Add(Job.Default.With(Runtime.Core).With(CsProjCoreToolchain.NetCoreApp20).WithId("Core2.0-x64"));
    Add(RPlotExporter.Default);
  }
}
BenchmarkDotNet will print such lines before each summary:
BenchmarkDotNet=v0.10.8, OS=Windows 10 Redstone 1 (10.0.14393)
Processor=Intel Core i7-6700HQ CPU 2.60GHz (Skylake), ProcessorCount=8
Frequency=2531250 Hz, Resolution=395.0617 ns, Timer=TSC
dotnet cli version=2.0.0-preview1-005977
  [Host]            : .NET Core 4.6.25302.01, 64bit RyuJIT
  Core2.0-x64       : .NET Core 4.6.25302.01, 64bit RyuJIT
  Mono5.0.1-x64     : Mono 5.0.1 (Visual Studio), 64bit
  NET4.7_RyuJIT-x64 : Clr 4.0.30319.42000, 64bit RyuJIT-v4.7.2053.0
Here is the summary table legend:
  Mean   : Arithmetic mean of all measurements
  Error  : Half of 99.9% confidence interval
  StdDev : Standard deviation of all measurements

  Gen 0     : GC Generation 0 collects per 1k Operations
  Gen 1     : GC Generation 1 collects per 1k Operations
  Gen 2     : GC Generation 2 collects per 1k Operations
  Allocated : Allocated memory per single operation (managed only, inclusive, 1KB = 1024B)

  1 ns   : 1 Nanosecond  (0.000000001 sec)
  1 us   : 1 Microsecond (0.000001 sec)
Ok, now we are ready.
Collections
In this post (probably the first one from a series), we will talk only about collections. We will look at all the benchmark from the original post, reimplement it with the help of BenchmarkDotNet, think about possible improvements, and analyze the results.
Queue
There is the source code of the first benchmark:
while (true)
{
  var q = new Queue<int>();
  var sw = Stopwatch.StartNew();
  for (int i = 0; i < 100_000_000; i++)
  {
    q.Enqueue(i);
    q.Dequeue();
  }
  Console.WriteLine(sw.Elapsed);
}
In BenchmarkDotNet, you shouldn’t do a lot of repetitions of a quick piece of code:
the library will do it for you
(by the way, why we do exactly 100_000_000 repetitions here?).
Here is our benchmark:
[Config(typeof(MainConfig))]
[BenchmarkCategory("Collections")]
public class QueueBenchmark1
{
  private Queue<int> q = new Queue<int>();

  [Benchmark]
  public void Run()
  {
    q.Enqueue(0);
    q.Dequeue();
  }
}
There is my results (BenchmarkDotNet generated a pretty markdown table for me which I copy-pasted to my blog):
| Job | Mean | Error | StdDev |
|---|---|---|---|
| Core2.0-x64 | 6.228 ns | 0.0120 ns | 0.0079 ns |
| Mono5.0.1-x64 | 10.514 ns | 0.0288 ns | 0.0240 ns |
| NET4.7_RyuJIT-x64 | 11.150 ns | 0.0592 ns | 0.0525 ns |
Usually, it’s also a good idea to look at the distribution. BenchmarkDotNet provides plots like this:
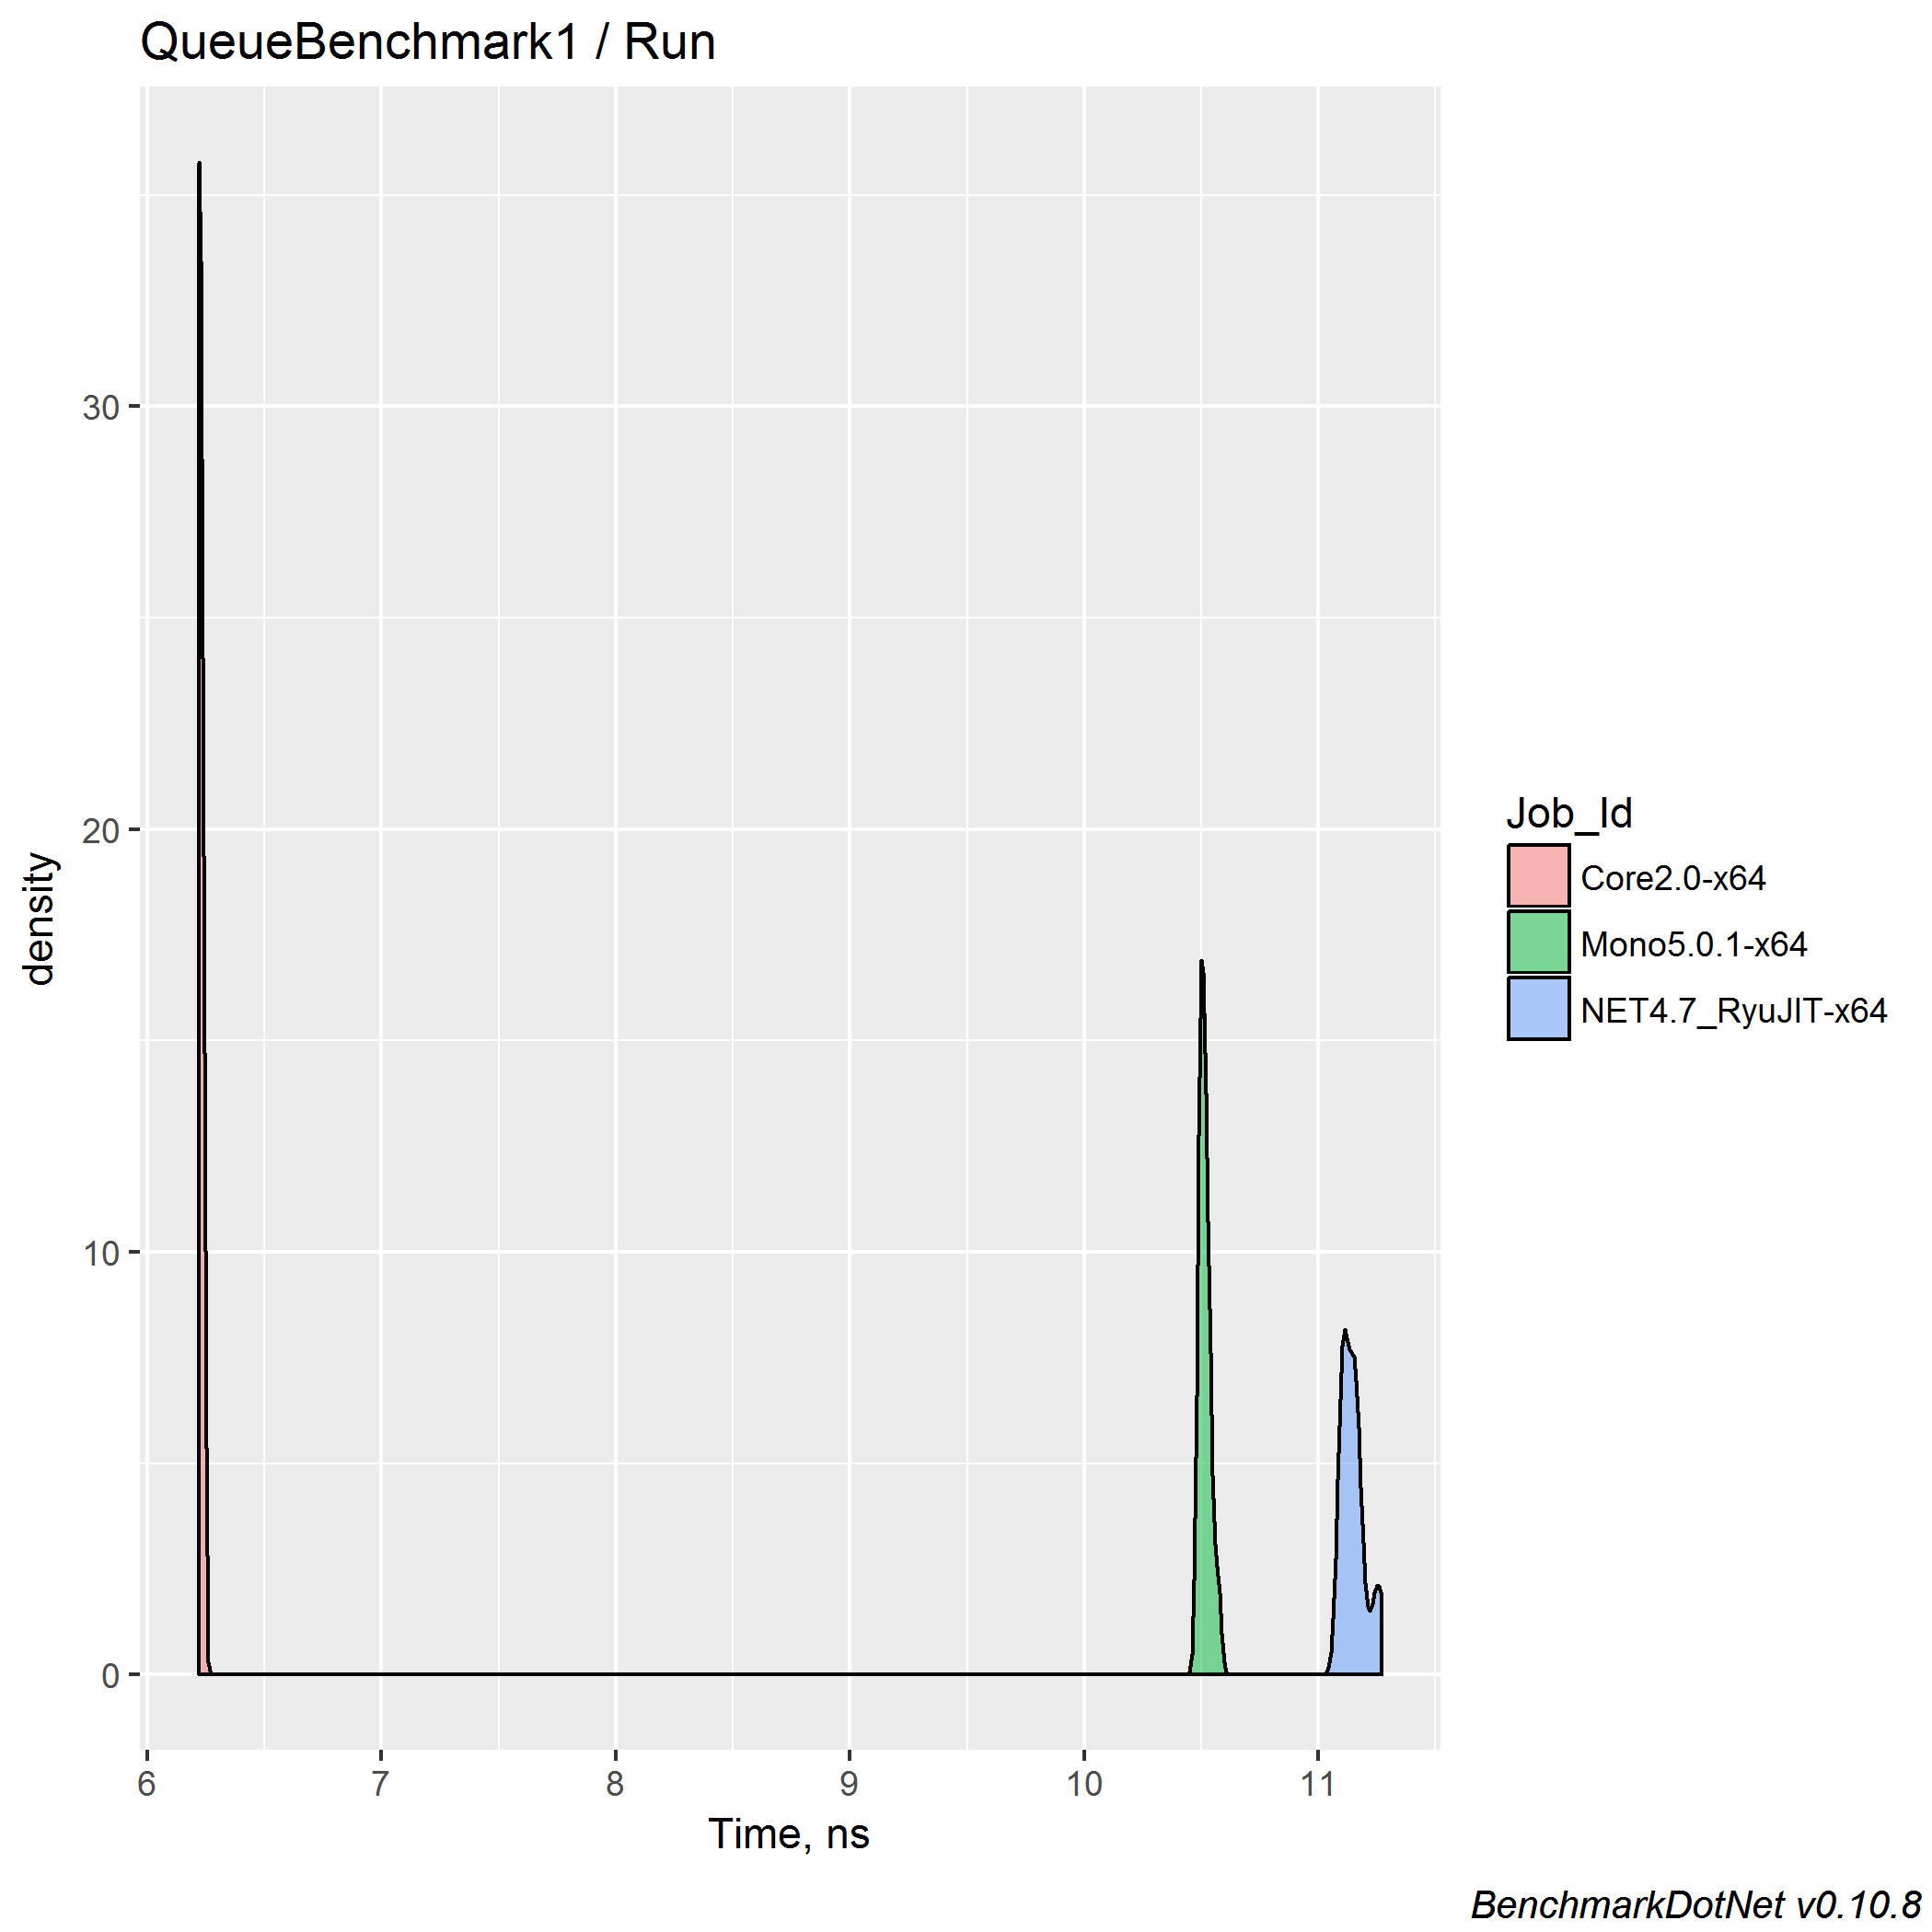
Now everything is fine, but don’t forget to check out the distribution when you are investigation a new performance space.
The original results:
// .NET Framework 4.7
00:00:00.9392595
00:00:00.9390453
00:00:00.9455784
00:00:00.9508294
00:00:01.0107745
// .NET Core 2.0 Preview 1
00:00:00.5514887
00:00:00.5662477
00:00:00.5627481
00:00:00.5685286
00:00:00.5262378
It’s nice to see ~1.8x speedup on the .NET Core (both original and BenchmarkDotNet results).
But here we are talking about too artificial benchmarks: we measure a single Enqueue/Dequeue pair with a zero-size queue.
The Enqueue doesn’t have a fixed performance because it can trigger resizing of the internal array.
Let’s write another benchmark with N elements:
[Config(typeof(MainConfig))]
[BenchmarkCategory("Collections")]
public class QueueBenchmark2
{
  private Queue<int> q = new Queue<int>();

  [Params(10, 100, 1_000, 10_000)]
  public int N;

  [Benchmark]
  public void Run()
  {
    for (int i = 0; i < N; i++)
      q.Enqueue(i);
    for (int i = 0; i < N; i++)
      q.Dequeue();
  }
}
Results:
| Job | N | Mean | Error | StdDev | ||
|---|---|---|---|---|---|---|
| Core2.0-x64 | 10 | 72.68 ns | 0.1578 ns | 0.1318 ns | ||
| Mono5.0.1-x64 | 10 | 180.29 ns | 0.5868 ns | 0.5489 ns | ||
| NET4.7_RyuJIT-x64 | 10 | 152.73 ns | 0.4126 ns | 0.3658 ns | ||
| Core2.0-x64 | 100 | 738.99 ns | 1.5047 ns | 1.4075 ns | ||
| Mono5.0.1-x64 | 100 | 2,200.55 ns | 43.0554 ns | 67.0321 ns | ||
| NET4.7_RyuJIT-x64 | 100 | 2,023.59 ns | 5.1311 ns | 4.5486 ns | ||
| Core2.0-x64 | 1000 | 6,978.27 ns | 21.7015 ns | 19.2378 ns | ||
| Mono5.0.1-x64 | 1000 | 22,917.90 ns | 65.6376 ns | 51.2455 ns | ||
| NET4.7_RyuJIT-x64 | 1000 | 20,632.16 ns | 49.7627 ns | 41.5541 ns | ||
| Core2.0-x64 | 10000 | 70,749.93 ns | 97.2220 ns | 75.9045 ns | ||
| Mono5.0.1-x64 | 10000 | 228,853.60 ns | 728.0385 ns | 681.0076 ns | ||
| NET4.7_RyuJIT-x64 | 10000 | 206,463.21 ns | 351.8959 ns | 293.8490 ns |
Let’s look at the bar chart for this benchmark:

With N=10_000, we have ~2.95x speedup which is pretty great.
You should understand that it’s still is not a perfect benchmark for Queue.
If we want to have a complete performance investigation,
we should check corner cases (e.g., moments before and after the array resizing),
we should check cases with different initial capacity,
we should check how it works in a real situation (e.g., solve a classic computer science problem with a queue),
we should check many-many cases.
We skip this “complete investigation” (but you can do it yourself) because it’s not our aim for today and we have a lot of other interesting examples.
I will be happy if someone else continues this research, writes a set of benchmarks and presents the results.
It will be a good exercise for you and a good example of a nice performance investigation for the community.
Feel free to pick up any other example from this post or create you own.
SortedSet
The next benchmark is about SortedSet.
We skip the constructor demo (comparing ~7.7sec and ~0.013s is not interesting)
and continue with the Min performance.
Here is the original code:
while (true)
{
  var s = new SortedSet<int>();
  for (int n = 0; n < 100_000; n++)
  {
    s.Add(n);
  }

  var sw = Stopwatch.StartNew();
  for (int i = 0; i < 10_000_000; i++)
  {
    s_result = s.Min;
  }
  Console.WriteLine(sw.Elapsed);
}
Original results:
// .NET Framework 4.7
00:00:01.1427246
00:00:01.1295220
00:00:01.1350696
00:00:01.1502784
00:00:01.1677880
// .NET Core 2.0 Preview 1
00:00:00.0861391
00:00:00.0861183
00:00:00.0866616
00:00:00.0848434
00:00:00.0860198
Why we put exactly 100_000 in the SortedSet?
Let’s try different values!
[Config(typeof(MainConfig))]
[BenchmarkCategory("Collections")]
public class SortedSetBenchmark1
{
  private SortedSet<int> s = new SortedSet<int>();

  [Params(1, 100, 100_000, 10_000_000)]
  public int N;

  [GlobalSetup]
  public void Setup()
  {
    for (int i = 0; i < N; i++)
      s.Add(i);
  }

  [Benchmark]
  public int Run() => s.Min;
}
| Job | N | Mean | Error | StdDev |
|---|---|---|---|---|
| Core2.0-x64 | 1 | 2.010 ns | 0.0061 ns | 0.0057 ns |
| Mono5.0.1-x64 | 1 | 81.355 ns | 1.6598 ns | 2.6802 ns |
| NET4.7_RyuJIT-x64 | 1 | 38.103 ns | 0.7885 ns | 1.4015 ns |
| Core2.0-x64 | 100 | 4.040 ns | 0.0166 ns | 0.0139 ns |
| Mono5.0.1-x64 | 100 | 147.587 ns | 2.9271 ns | 4.8093 ns |
| NET4.7_RyuJIT-x64 | 100 | 72.091 ns | 0.2088 ns | 0.2404 ns |
| Core2.0-x64 | 100000 | 12.193 ns | 0.0471 ns | 0.0440 ns |
| Mono5.0.1-x64 | 100000 | 257.729 ns | 0.6381 ns | 0.5657 ns |
| NET4.7_RyuJIT-x64 | 100000 | 145.400 ns | 0.5647 ns | 0.5282 ns |
| Core2.0-x64 | 10000000 | 55.452 ns | 0.1196 ns | 0.1119 ns |
| Mono5.0.1-x64 | 10000000 | 476.941 ns | 1.2562 ns | 1.1136 ns |
| NET4.7_RyuJIT-x64 | 10000000 | 202.415 ns | 0.5968 ns | 0.5290 ns |
Here are some interesting facts:
- In the original post, for
N=100_000we have~14.5xspeedup on.NET Core. - In our experiment, we have
~12xspeedup..NET Coreis still super-fast, but we have a difference between speedup results. - For
N=10_000_000we have~3.7xspeedup. Be careful with the parameters of your benchmark: they can significantly affect your results. Monoworks~2.35times slower than.NET Framework 4.7+RyuJIT-x64forN=10_000_000.
List
Now it’s time for the List.
The original benchmark:
while (true)
{
  var l = new List<int>();
  var sw = Stopwatch.StartNew();
  for (int i = 0; i < 100_000_000; i++)
  {
    l.Add(i);
    l.RemoveAt(0);
  }
  Console.WriteLine(sw.Elapsed);
}
The original results:
// .NET Framework 4.7
00:00:00.4434135
00:00:00.4394329
00:00:00.4496867
00:00:00.4496383
00:00:00.4515505
// .NET Core 2.0 Preview 1
00:00:00.3213094
00:00:00.3211772
00:00:00.3179631
00:00:00.3198449
00:00:00.3164009
Let’s write a simple benchmark for Add/RemoveAt:
[Config(typeof(MainConfig))]
[BenchmarkCategory("Collections")]
public class ListBenchmark1
{
  private List<int> l = new List<int>();

  [Benchmark]
  public void Run()
  {
    l.Add(0);
    l.RemoveAt(0);
  }
}
| Job | Mean | Error | StdDev | Median |
|---|---|---|---|---|
| Core2.0-x64 | 3.375 ns | 0.0053 ns | 0.0057 ns | 3.374 ns |
| Mono5.0.1-x64 | 7.942 ns | 0.1972 ns | 0.3556 ns | 8.229 ns |
| NET4.7_RyuJIT-x64 | 5.914 ns | 0.0126 ns | 0.0098 ns | 5.913 ns |
We can see here ~1.8x speedup on .NET Core, in the original post it was ~1.4x.
Another interesting fact: did you noticed that BenchmarkDotNet added the Median column in this table (it was skipped in previous benchmarks)?
By default, BenchmarkDotNet tries not to bore you with statistics (however, you can request any statistics manually).
If BenchmarkDotNet discovers something strange in the results, it adds additional columns with interesting values.
By default, the Median column is skipped because usually the Median and Mean values are too close.
Here we have a difference for Mono:
| Job | Mean | Median |
|---|---|---|
| Mono5.0.1-x64 | 7.942 ns | 8.229 ns |
Let’s look at the timeline plot for mono:
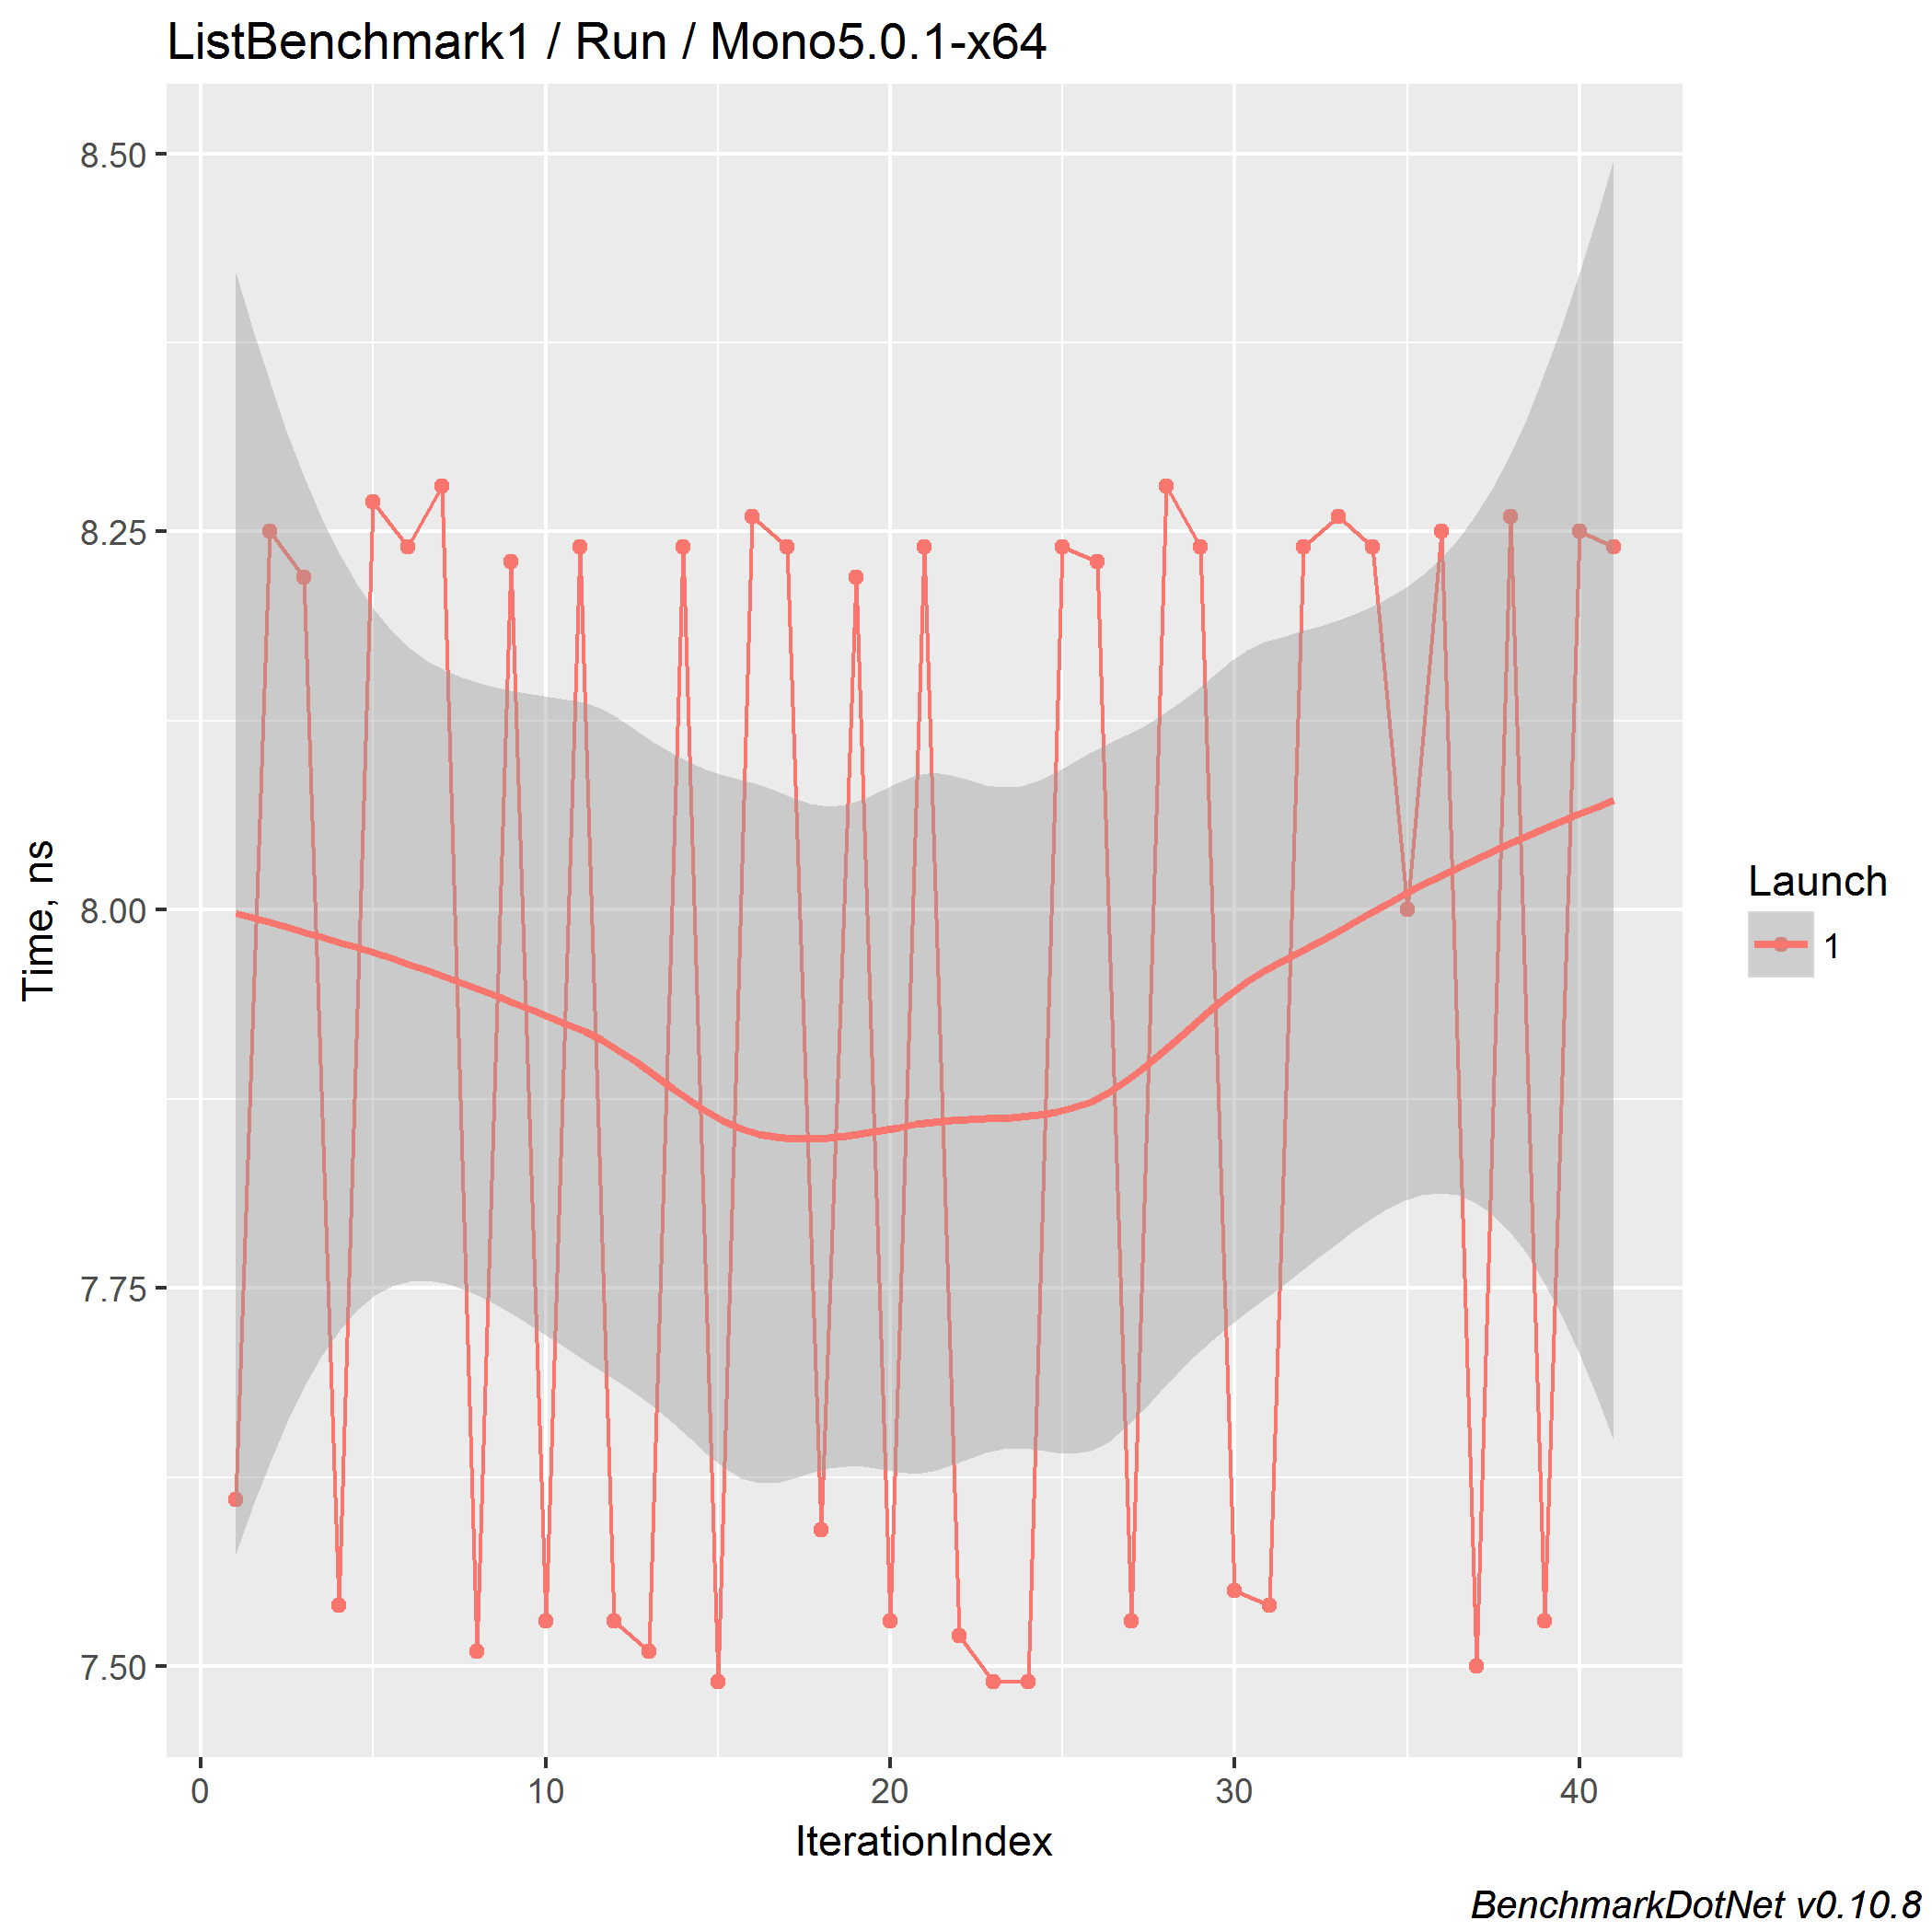
The usual amount of iterations for a benchmark is 15.
In most cases, it allows getting acceptable results.
I tried to increase it before, but people don’t want to wait too long for results;
they start to manually set a small amount of iterations,
and our default “automatic choosing the amount of iterations” logic becomes useless.
So, the default value is 15 (at least), but BenchmarkDotNet can increase it if something is going wrong.
On Mono, we can see that the amount of iterations is around 40. (Hooray, it works!)
Also, we can observe two modes: around ~7.6ns and ~8.2ns.
So, let’s check the distribution!
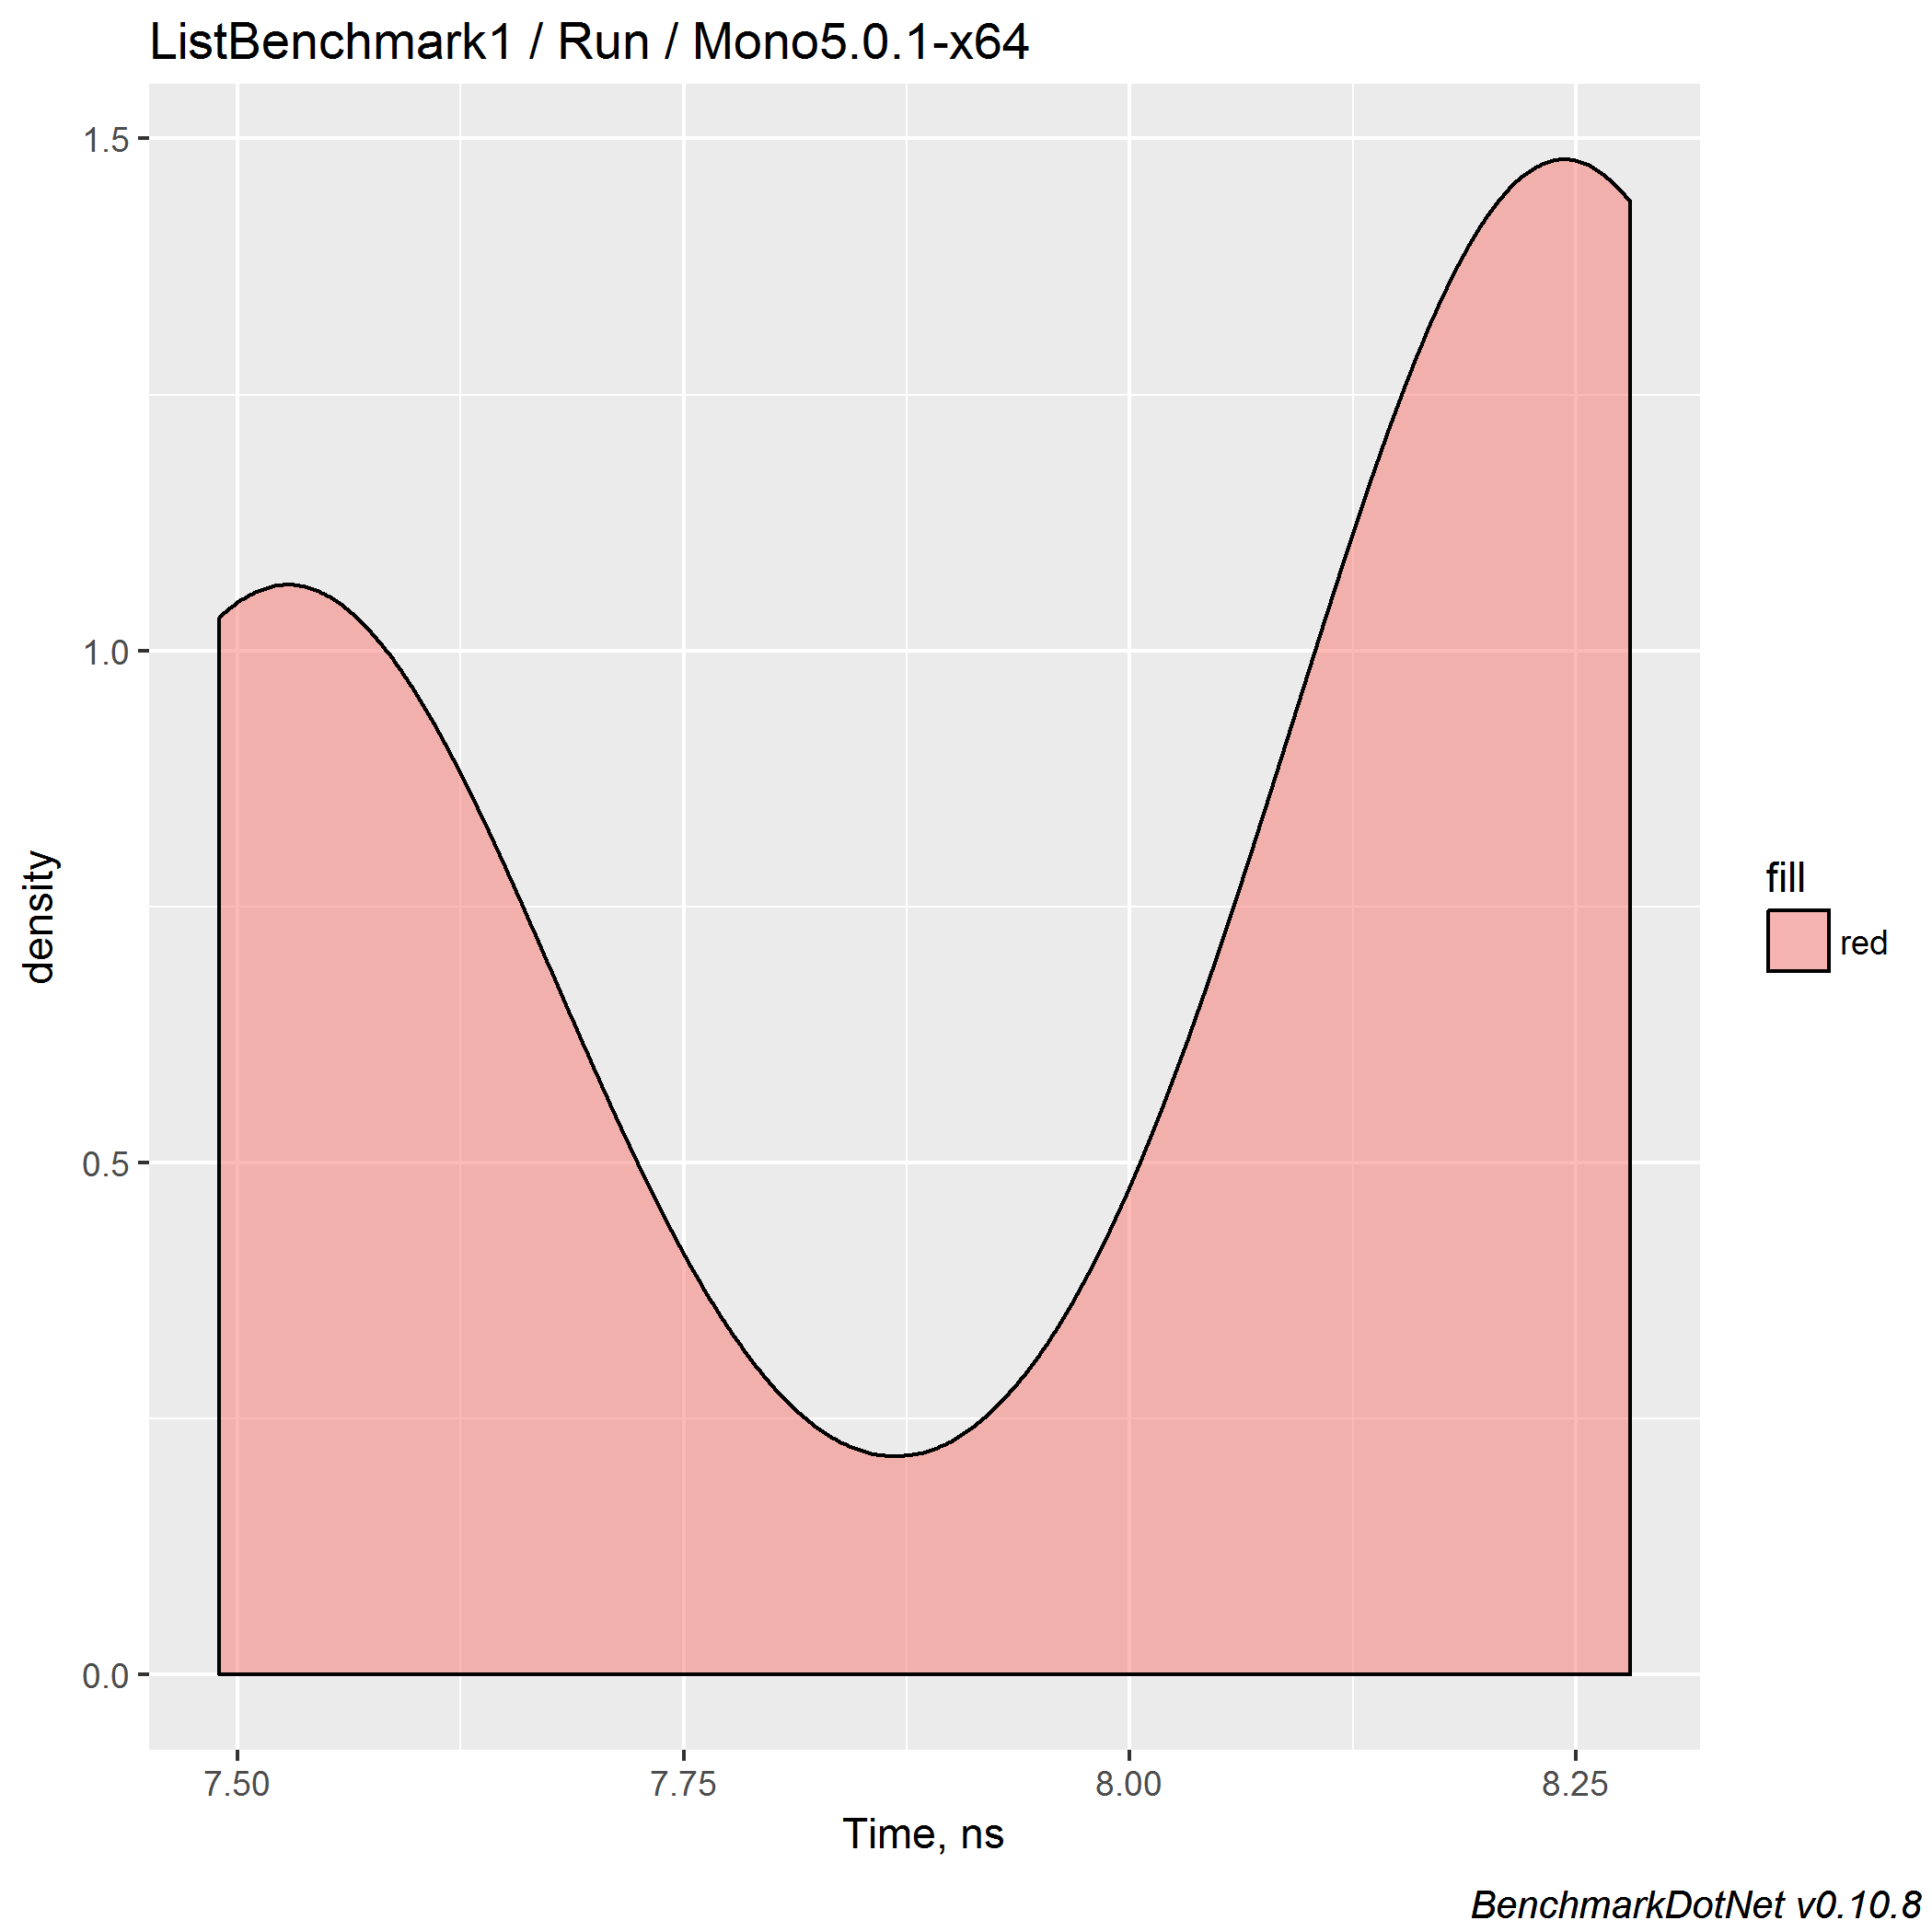
Yep, it’s a bimodal distribution. If BenchmarkDotNet is so smart, why it didn’t warn us about such distribution? Well, it’s an open issue: BenchmarkDotNet#429: Detect multimodal distributions. I tried to implement this, but performance distribution are too tricky, it’s not easy to write such logic without huge percent of false-positive results. I will try it again in the future, but if somebody knows a good solution, pull requests are welcome!
Why does the distribution look like this? I don’t know. And it’s not a topic of this post: the full performance investigation takes too much time: we have to play with initial configurations, check out the source code, try different versions of mono, different machines, and so on. In this post, I want to talk only about benchmarking. The important point here is that such phenomena can be easily skipped during handwritten measurements.
Now le’ts check how it works on huge lists:
[Config(typeof(MainConfig))]
[BenchmarkCategory("Collections")]
public class ListBenchmark2
{
  private List<int> l = new List<int>();

  [Params(10, 100, 1000)]
  public int N;

  [Benchmark]
  public void Run()
  {
    for (int i = 0; i < N; i++)
      l.Add(i);
    for (int i = 0; i < N; i++)
      l.RemoveAt(N - 1 - i);
  }
}
| Job | N | Mean | Error | StdDev | Median |
|---|---|---|---|---|---|
| Core2.0-x64 | 10 | 42.87 ns | 0.1396 ns | 0.1166 ns | 42.83 ns |
| Mono5.0.1-x64 | 10 | 115.27 ns | 0.7361 ns | 0.9040 ns | 115.55 ns |
| NET4.7_RyuJIT-x64 | 10 | 59.53 ns | 0.3000 ns | 0.2506 ns | 59.45 ns |
| Core2.0-x64 | 100 | 430.05 ns | 0.7114 ns | 0.6307 ns | 429.95 ns |
| Mono5.0.1-x64 | 100 | 871.77 ns | 17.3243 ns | 32.9613 ns | 897.37 ns |
| NET4.7_RyuJIT-x64 | 100 | 664.19 ns | 1.3559 ns | 0.9804 ns | 663.97 ns |
| Core2.0-x64 | 1000 | 4,059.05 ns | 13.0940 ns | 10.2230 ns | 4,060.99 ns |
| Mono5.0.1-x64 | 1000 | 7,623.19 ns | 95.4478 ns | 79.7032 ns | 7,610.51 ns |
| NET4.7_RyuJIT-x64 | 1000 | 6,271.42 ns | 123.4688 ns | 209.6594 ns | 6,398.59 ns |
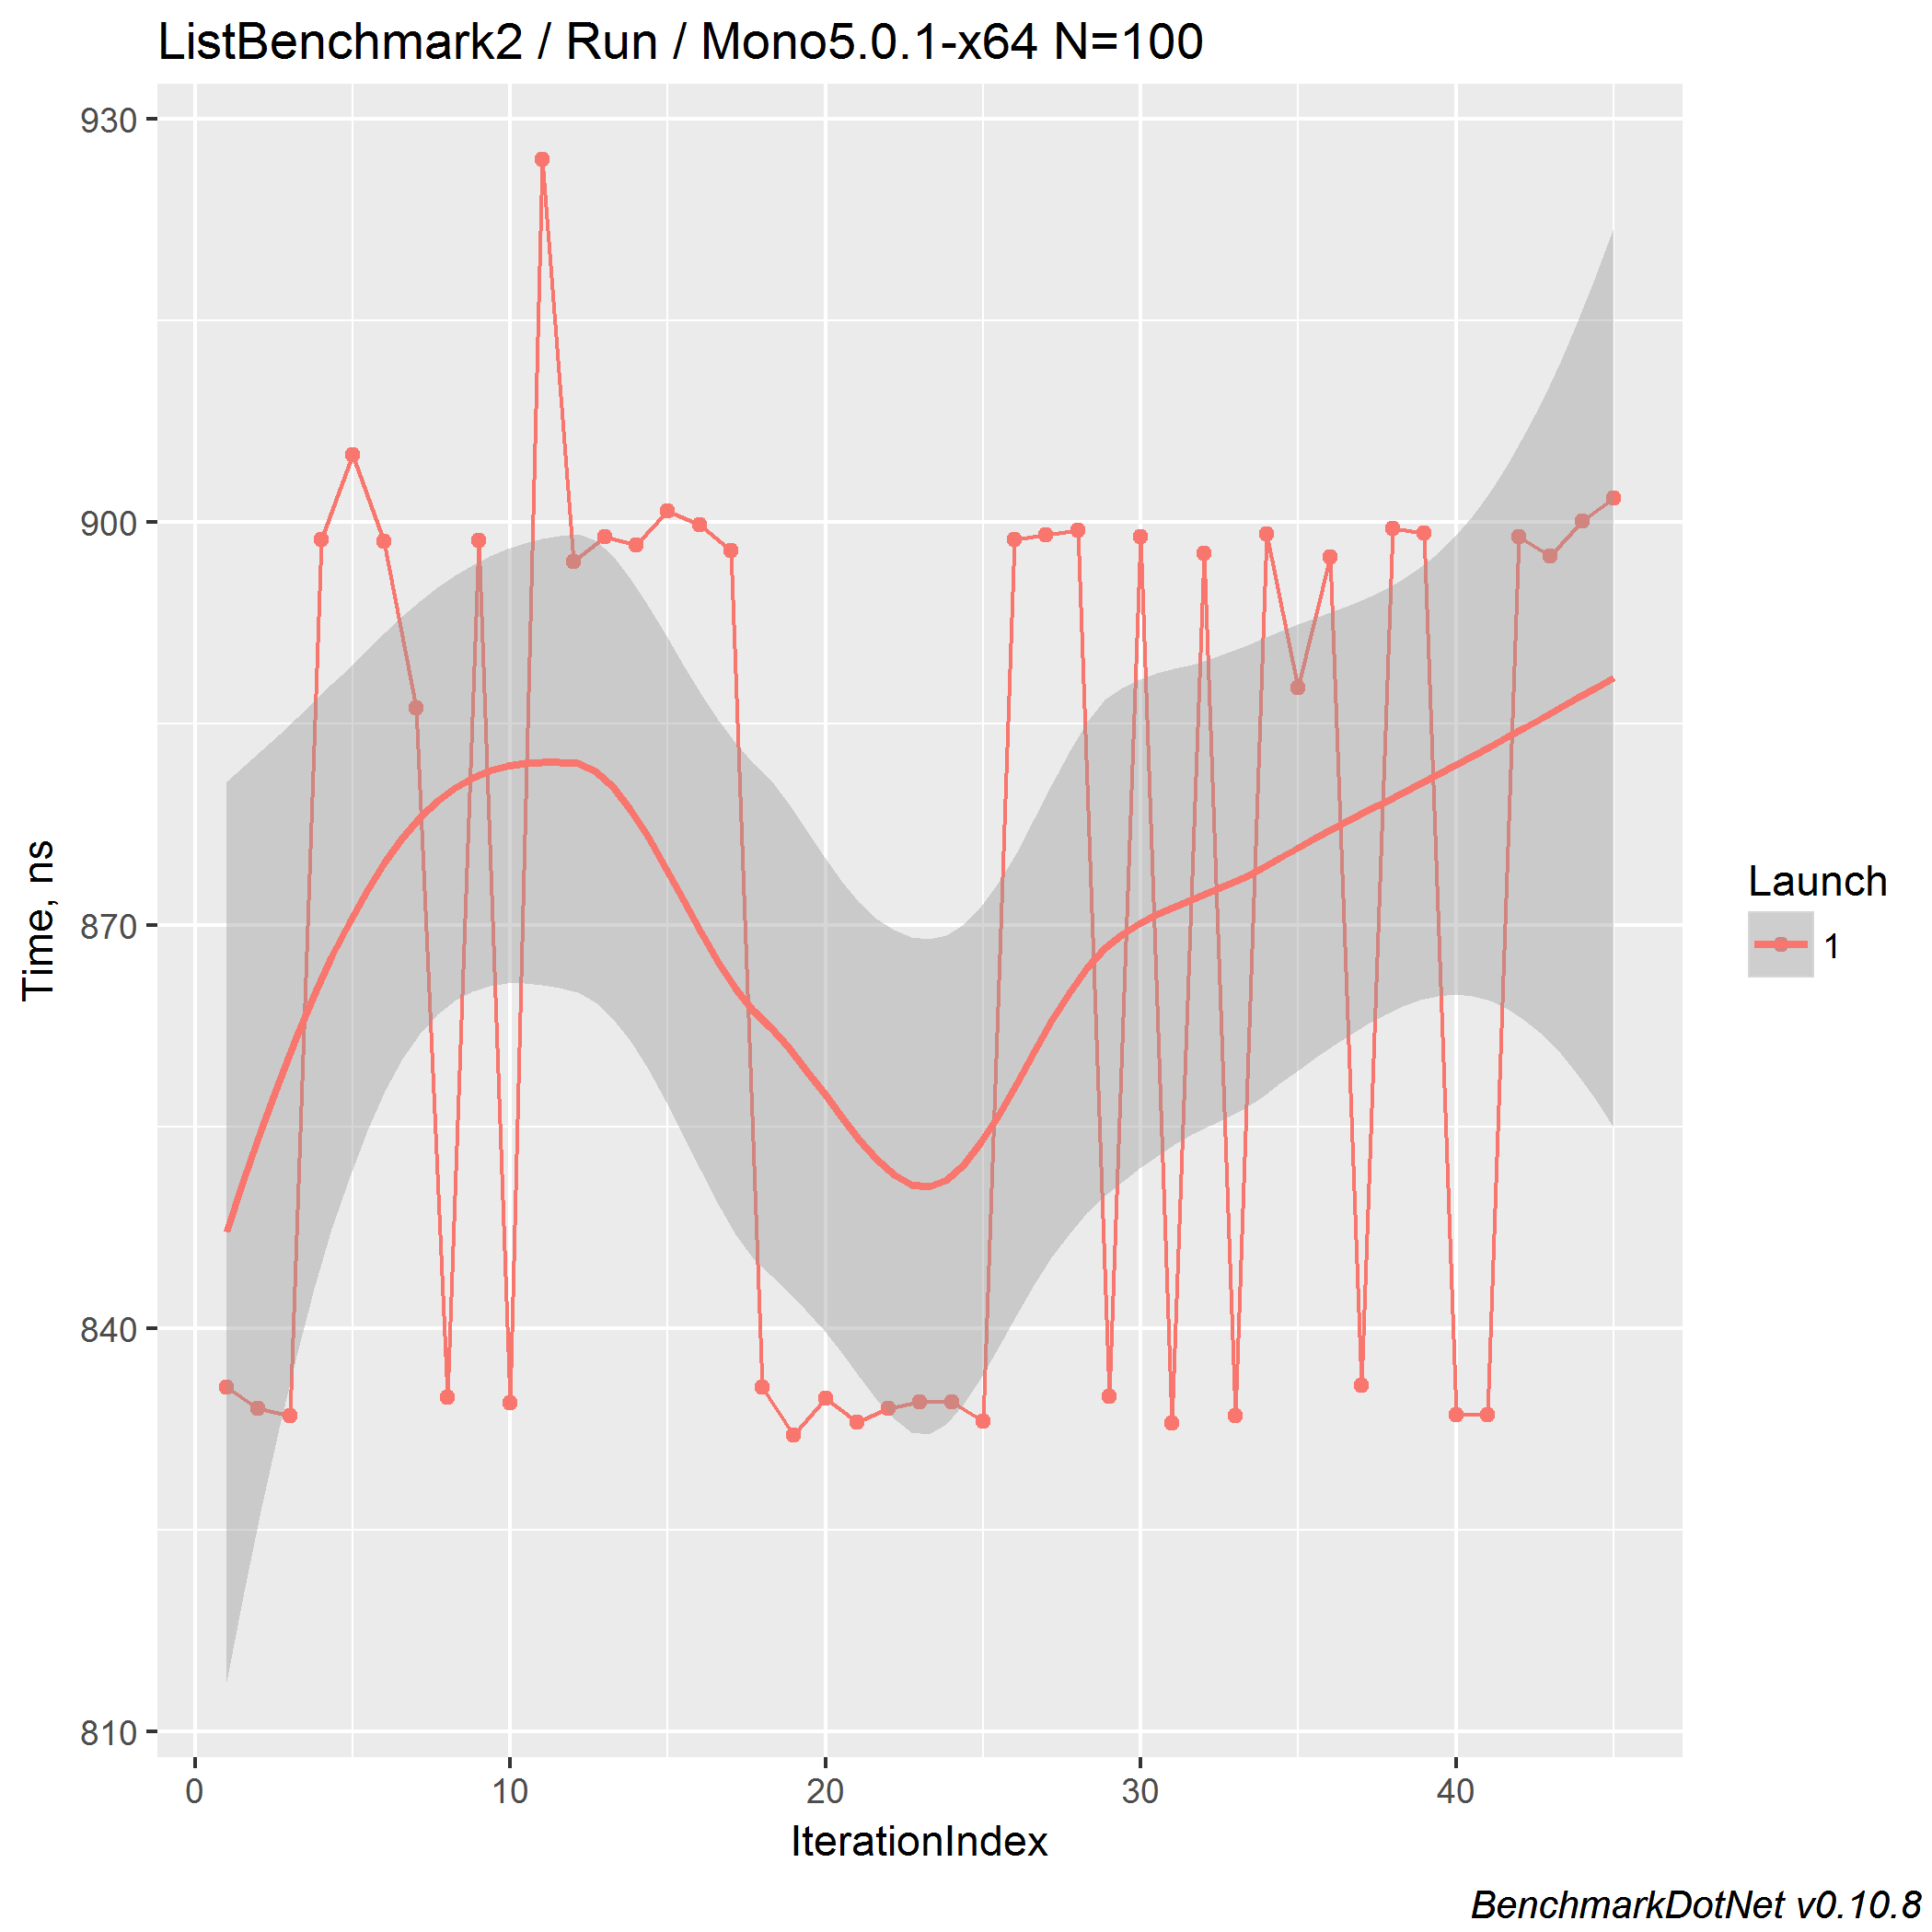
For N=1000, we have ~1.55x speedup.
And we still have a bimodal distribution for mono.
Here is the timeline plot for N=100:
ConcurrentQueue
Now let’s play with ConcurrentQueue.
The original code:
while (true)
{
  var q = new ConcurrentQueue<int>();
  int gen0 = GC.CollectionCount(0), gen1 = GC.CollectionCount(1), gen2 = GC.CollectionCount(2);
  for (int i = 0; i < 100_000_000; i++)
  {
    q.Enqueue(i);
    q.TryDequeue(out int _);
  }
  Console.WriteLine($"Gen0={GC.CollectionCount(0) - gen0} Gen1={GC.CollectionCount(1) - gen1} Gen2={GC.CollectionCount(2) - gen2}");
}
The original results:
// .NET Framework 4.7
00:00:02.6485174  Gen0=162 Gen1=80 Gen2=0
00:00:02.6144919  Gen0=162 Gen1=81 Gen2=0
00:00:02.6699958  Gen0=162 Gen1=81 Gen2=0
00:00:02.6441047  Gen0=162 Gen1=81 Gen2=0
00:00:02.6255135  Gen0=162 Gen1=81 Gen2=0
// .NET Core 2.0 Preview 1
00:00:01.7700190  Gen0=0 Gen1=0 Gen2=0
00:00:01.8324078  Gen0=0 Gen1=0 Gen2=0
00:00:01.7552966  Gen0=0 Gen1=0 Gen2=0
00:00:01.7518632  Gen0=0 Gen1=0 Gen2=0
00:00:01.7560811  Gen0=0 Gen1=0 Gen2=0
Here we manually check GC collections.
In general case, it can be heard because such measurements have own problems.
In BenchmarkDotNet, you mark the benchmark class with the [MemoryDiagnoser] attribute,
and GC statistics will be automatically calculated.
And it’s not only about high-precision GC collection values, it also prints average allocated size in bytes!
Check out a post of Adam Sitnik
about MemoryDiagnoser: “The new MemoryDiagnoser is now better than ever!”.
Let’s write a new benchmark:
[Config(typeof(MainConfig))]
[BenchmarkCategory("Collections")]
[MemoryDiagnoser]
public class ConcurrentQueueBenchmark1
{
  private ConcurrentQueue<int> q = new ConcurrentQueue<int>();

  [Benchmark]
  public void Run()
  {
    q.Enqueue(0);
    q.TryDequeue(out int _);
  }
}
| Job | Mean | Error | StdDev | Gen 0 | Gen 1 | Gen 2 | Allocated |
|---|---|---|---|---|---|---|---|
| Core2.0-x64 | 18.92 ns | 0.0272 ns | 0.0227 ns | - | - | - | 0 B |
| Mono5.0.1-x64 | 45.41 ns | 0.1918 ns | 0.1498 ns | 0.0018 | 0.0001 | 0.0000 | N/A |
| NET4.7_RyuJIT-x64 | 31.24 ns | 0.0826 ns | 0.0773 ns | 0.0017 | 0.0008 | 0.0000 | 9 B |
Now we know average GC collection counts for all generations (Gen 0/Gen 1/Gen 2 are values per 1000 operations)
and the amount of allocated memory.
The original speedup is ~1.45x, our value is ~1.65x
[Config(typeof(MainConfig))]
[BenchmarkCategory("Collections")]
public class ConcurrentQueueBenchmark2
{
  private ConcurrentQueue<int> q = new ConcurrentQueue<int>();

  [Params(100, 100_000, 1_000_000)]
  public int N;

  [Benchmark]
  public void Run()
  {
    for (int i = 0; i < N; i++)
      q.Enqueue(0);
    for (int i = 0; i < N; i++)
      q.TryDequeue(out int _);
  }
}
| Job | N | Mean | Error | StdDev |
|---|---|---|---|---|
| Core2.0-x64 | 100 | 2.490 us | 0.0022 us | 0.0019 us |
| Mono5.0.1-x64 | 100 | 4.283 us | 0.0784 us | 0.0695 us |
| NET4.7_RyuJIT-x64 | 100 | 3.174 us | 0.0206 us | 0.0183 us |
| Core2.0-x64 | 100000 | 2,720.496 us | 4.2448 us | 3.3141 us |
| Mono5.0.1-x64 | 100000 | 4,130.617 us | 13.7123 us | 12.1556 us |
| NET4.7_RyuJIT-x64 | 100000 | 3,211.175 us | 5.8462 us | 5.4685 us |
| Core2.0-x64 | 1000000 | 27,249.183 us | 74.8775 us | 66.3769 us |
| Mono5.0.1-x64 | 1000000 | 41,757.702 us | 123.4342 us | 126.7578 us |
| NET4.7_RyuJIT-x64 | 1000000 | 34,823.063 us | 694.9357 us | 1,161.0814 us |
Thus, speedup for N=1_000_000 is ~1.26x.
Let’s look at the timelines:
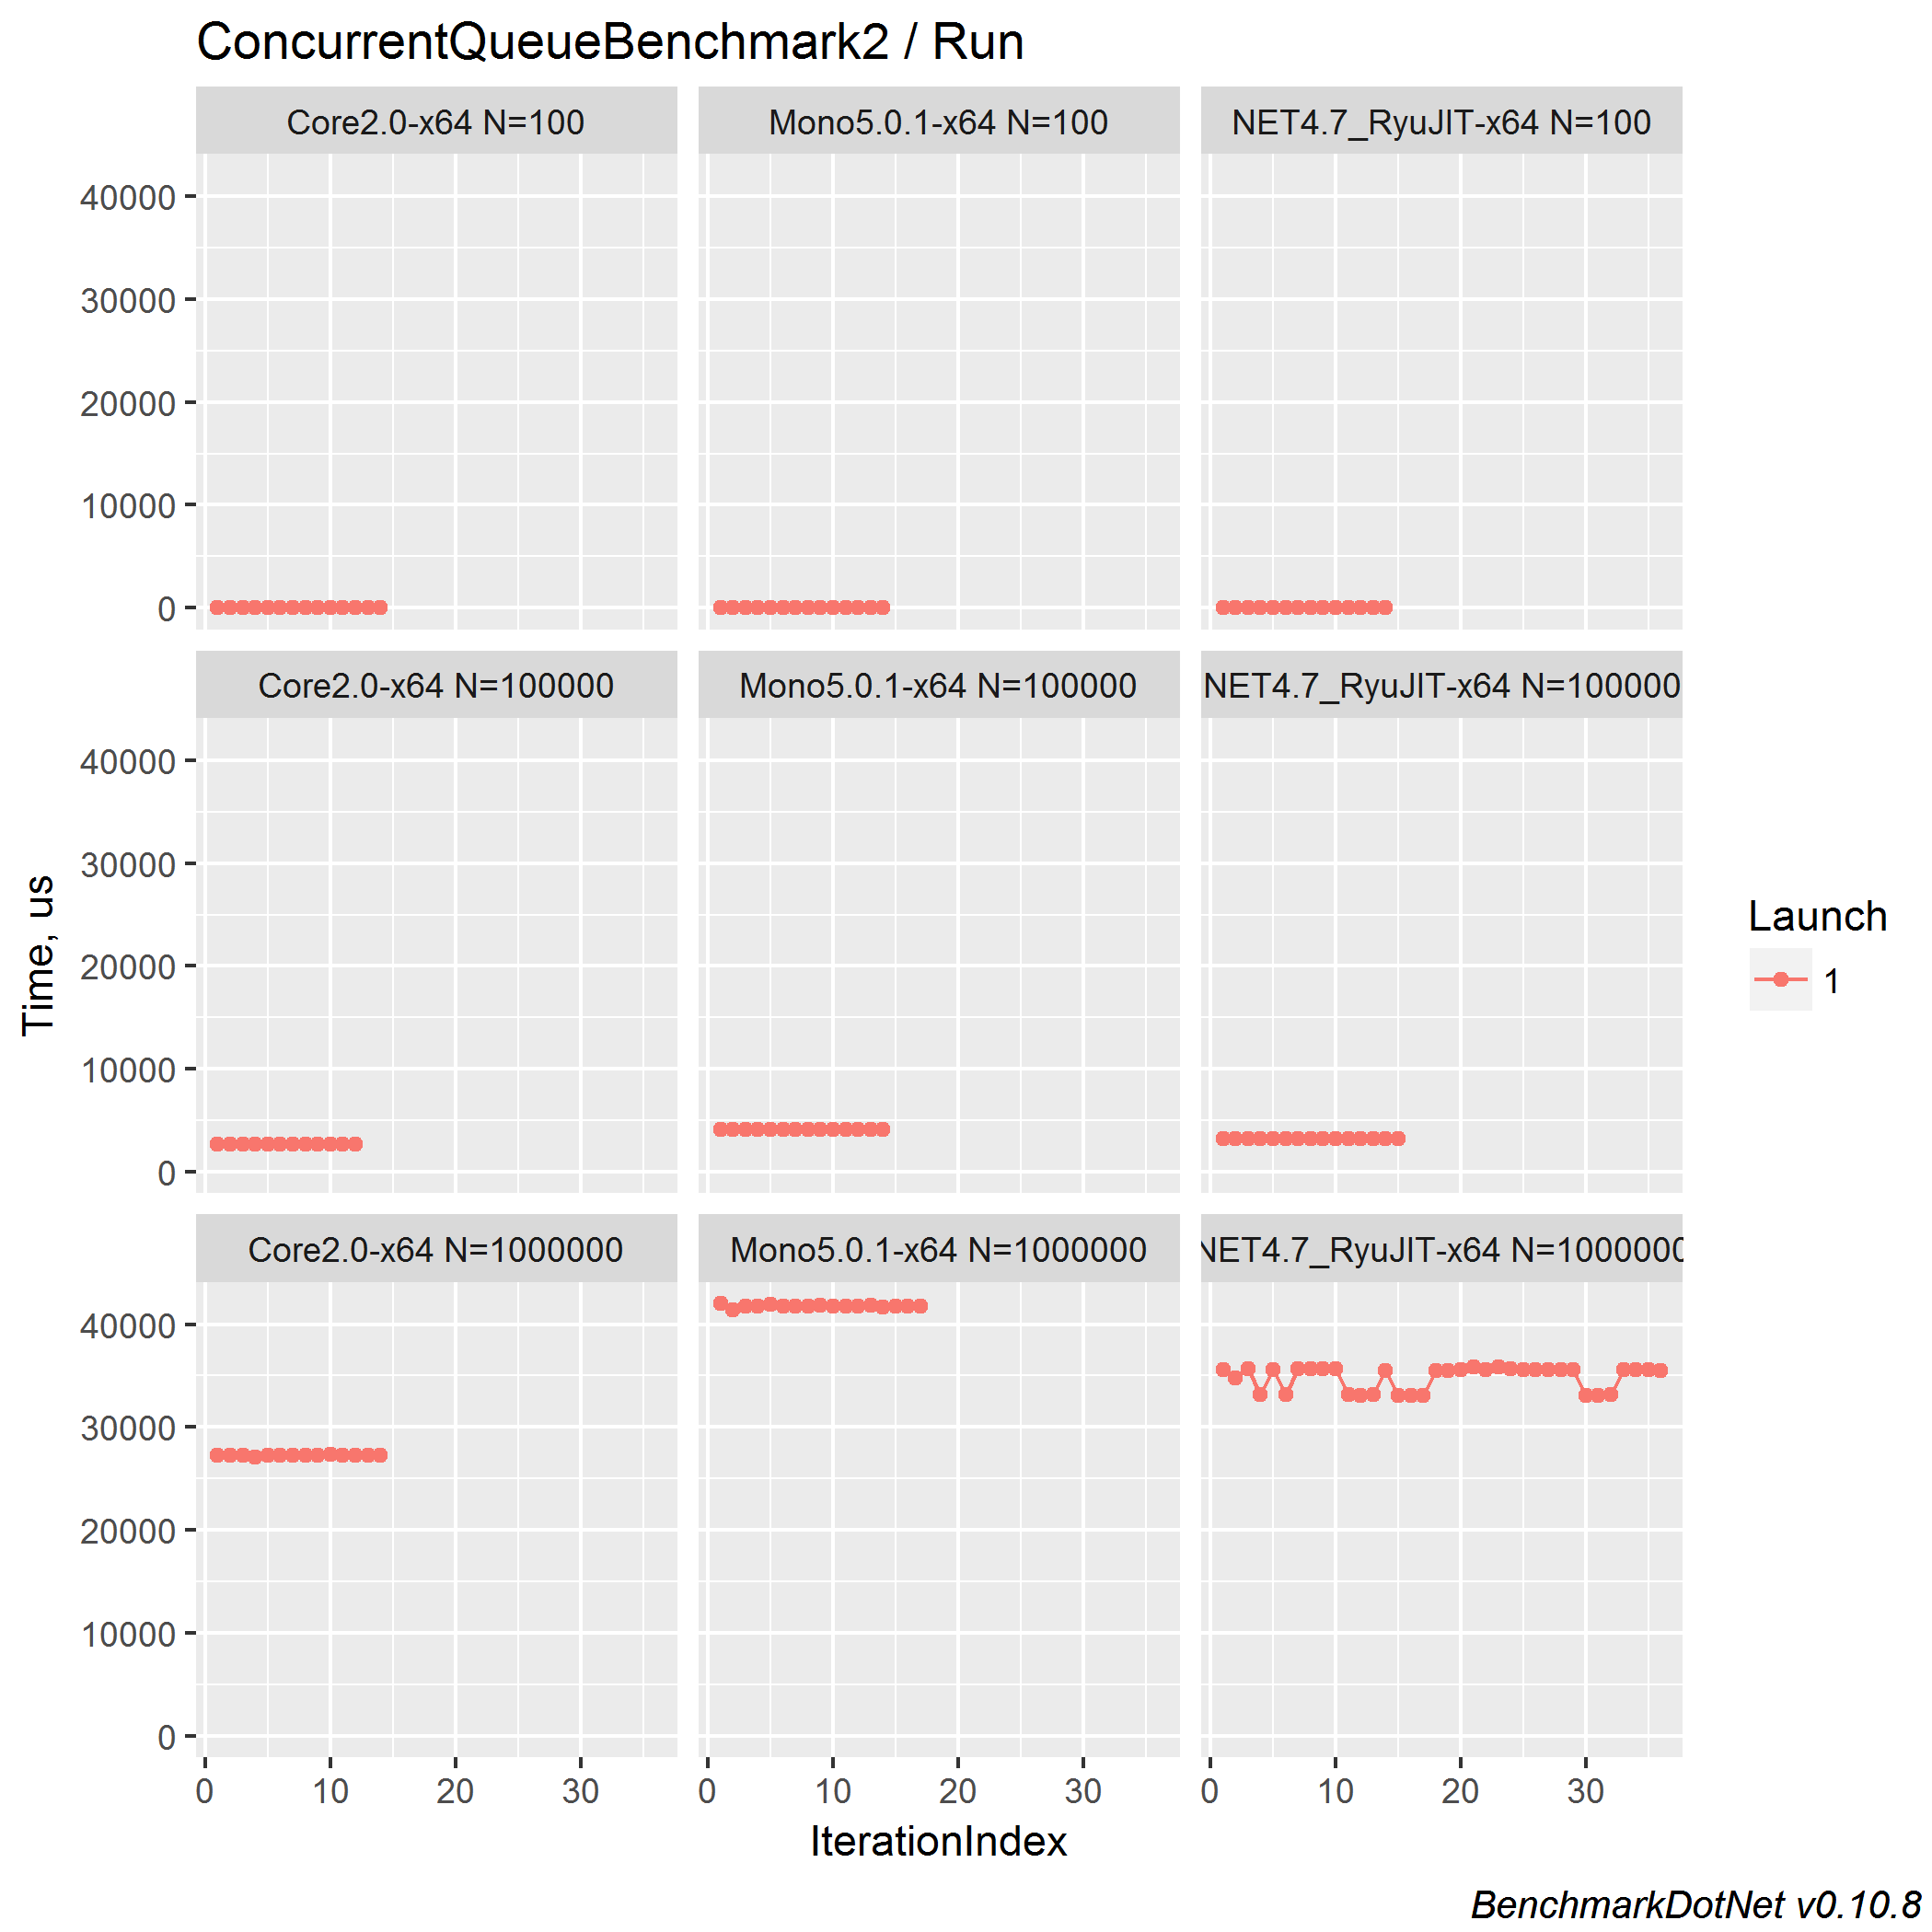
Plots are cool: we immediately see a suspicious place: .NET Framework 4.7 + N=1_000_000.
Looks like another bimodal distribution: a good candidate for detailed research, if we continue this investigation.
Now let’s look at a more interesting example with multithreading. The original code:
while (true)
{
  const int Items = 100_000_000;
  var q = new ConcurrentQueue<int>();
  var sw = Stopwatch.StartNew();

  Task consumer = Task.Run(() =>
  {
    int total = 0;
     while (total < Items) if (q.TryDequeue(out int _)) total++;
  });
  for (int i = 0; i < Items; i++) q.Enqueue(i);
  consumer.Wait();

  Console.WriteLine(sw.Elapsed);
}
The original results:
// .NET Framework 4.7
00:00:06.1366044
00:00:05.7169339
00:00:06.3870274
00:00:05.5487718
00:00:06.6069291
// .NET Core 2.0 Preview 1
00:00:01.2052460
00:00:01.5269184
00:00:01.4638793
00:00:01.4963922
00:00:01.4927520
It’s not easy to write multithreading benchmarks. People asked me several times about multithreading support in BenchmarkDotNet, but it’s not easy to implement. Of course, it’s easy to provide a nice API for such benchmark, but it’s hard to achieve stable results. I don’t want to write another benchmarking library which prints some numbers. If we have a feature, it should work great. So, we don’t support it out of the box, but we can just rewrite the original benchmark with the help of BenchmarkDotNet in a simple way:
[Config(typeof(MonitoringConfig))]
[BenchmarkCategory("Collections")]
public class ConcurrentQueueBenchmark3
{
  private ConcurrentQueue<int> q = new ConcurrentQueue<int>();

  [Params(100_000_000)]
  public int N;

  [Benchmark]
  public void Run()
  {
    Task consumer = Task.Run(() =>
    {
      int total = 0;
      while (total < N) if (q.TryDequeue(out int _)) total++;
    });
    for (int i = 0; i < N; i++)
      q.Enqueue(i);
    consumer.Wait();
  }
}
Here we use MonitoringConfig instead of MainConfig:
public class MonitoringConfig : ManualConfig
{
  public MonitoringConfig()
  {
    Add(Job.Default.With(RunStrategy.Monitoring).With(Runtime.Clr).With(Jit.RyuJit).With(Platform.X64).WithId("NET4.7_RyuJIT-x64"));
    Add(Job.Default.With(RunStrategy.Monitoring).With(Runtime.Mono).WithId("Mono5.0.1-x64"));
    Add(Job.Default.With(RunStrategy.Monitoring).With(Runtime.Core).With(CsProjCoreToolchain.NetCoreApp20).WithId("Core2.0-x64"));
    Add(RPlotExporter.Default);
    KeepBenchmarkFiles = true;
  }
}
Mainly, BenchmarkDotNet is focusing on microbenchmarking.
If you measure a method which takes seconds, the whole benchmarking process can take too much time.
RunStrategy.Monitoring is designed for macrobenchmarks, it allows getting good results in a short period of time.
One day we will support such method out of the box, but currently Monitoring is our choice (more about run strategies).
The results:
| Job | N | Mean | Error | StdDev |
|---|---|---|---|---|
| Core2.0-x64 | 100000000 | 1.720 s | 0.3313 s | 0.2191 s |
| Mono5.0.1-x64 | 100000000 | 6.829 s | 0.9576 s | 0.6334 s |
| NET4.7_RyuJIT-x64 | 100000000 | 6.042 s | 0.4212 s | 0.2786 s |
The original speedup is ~4x..5.3x, the new speedup is ~3.5x.
The important point here is the following: the standard deviation is huge.
Let’s look again at a few of the original results for .NET Framework 4.7:
00:00:05.5487718
00:00:06.6069291
There is a huge difference between measurements. It’s not enough to do only five iterations in such case! Here is the box plot:
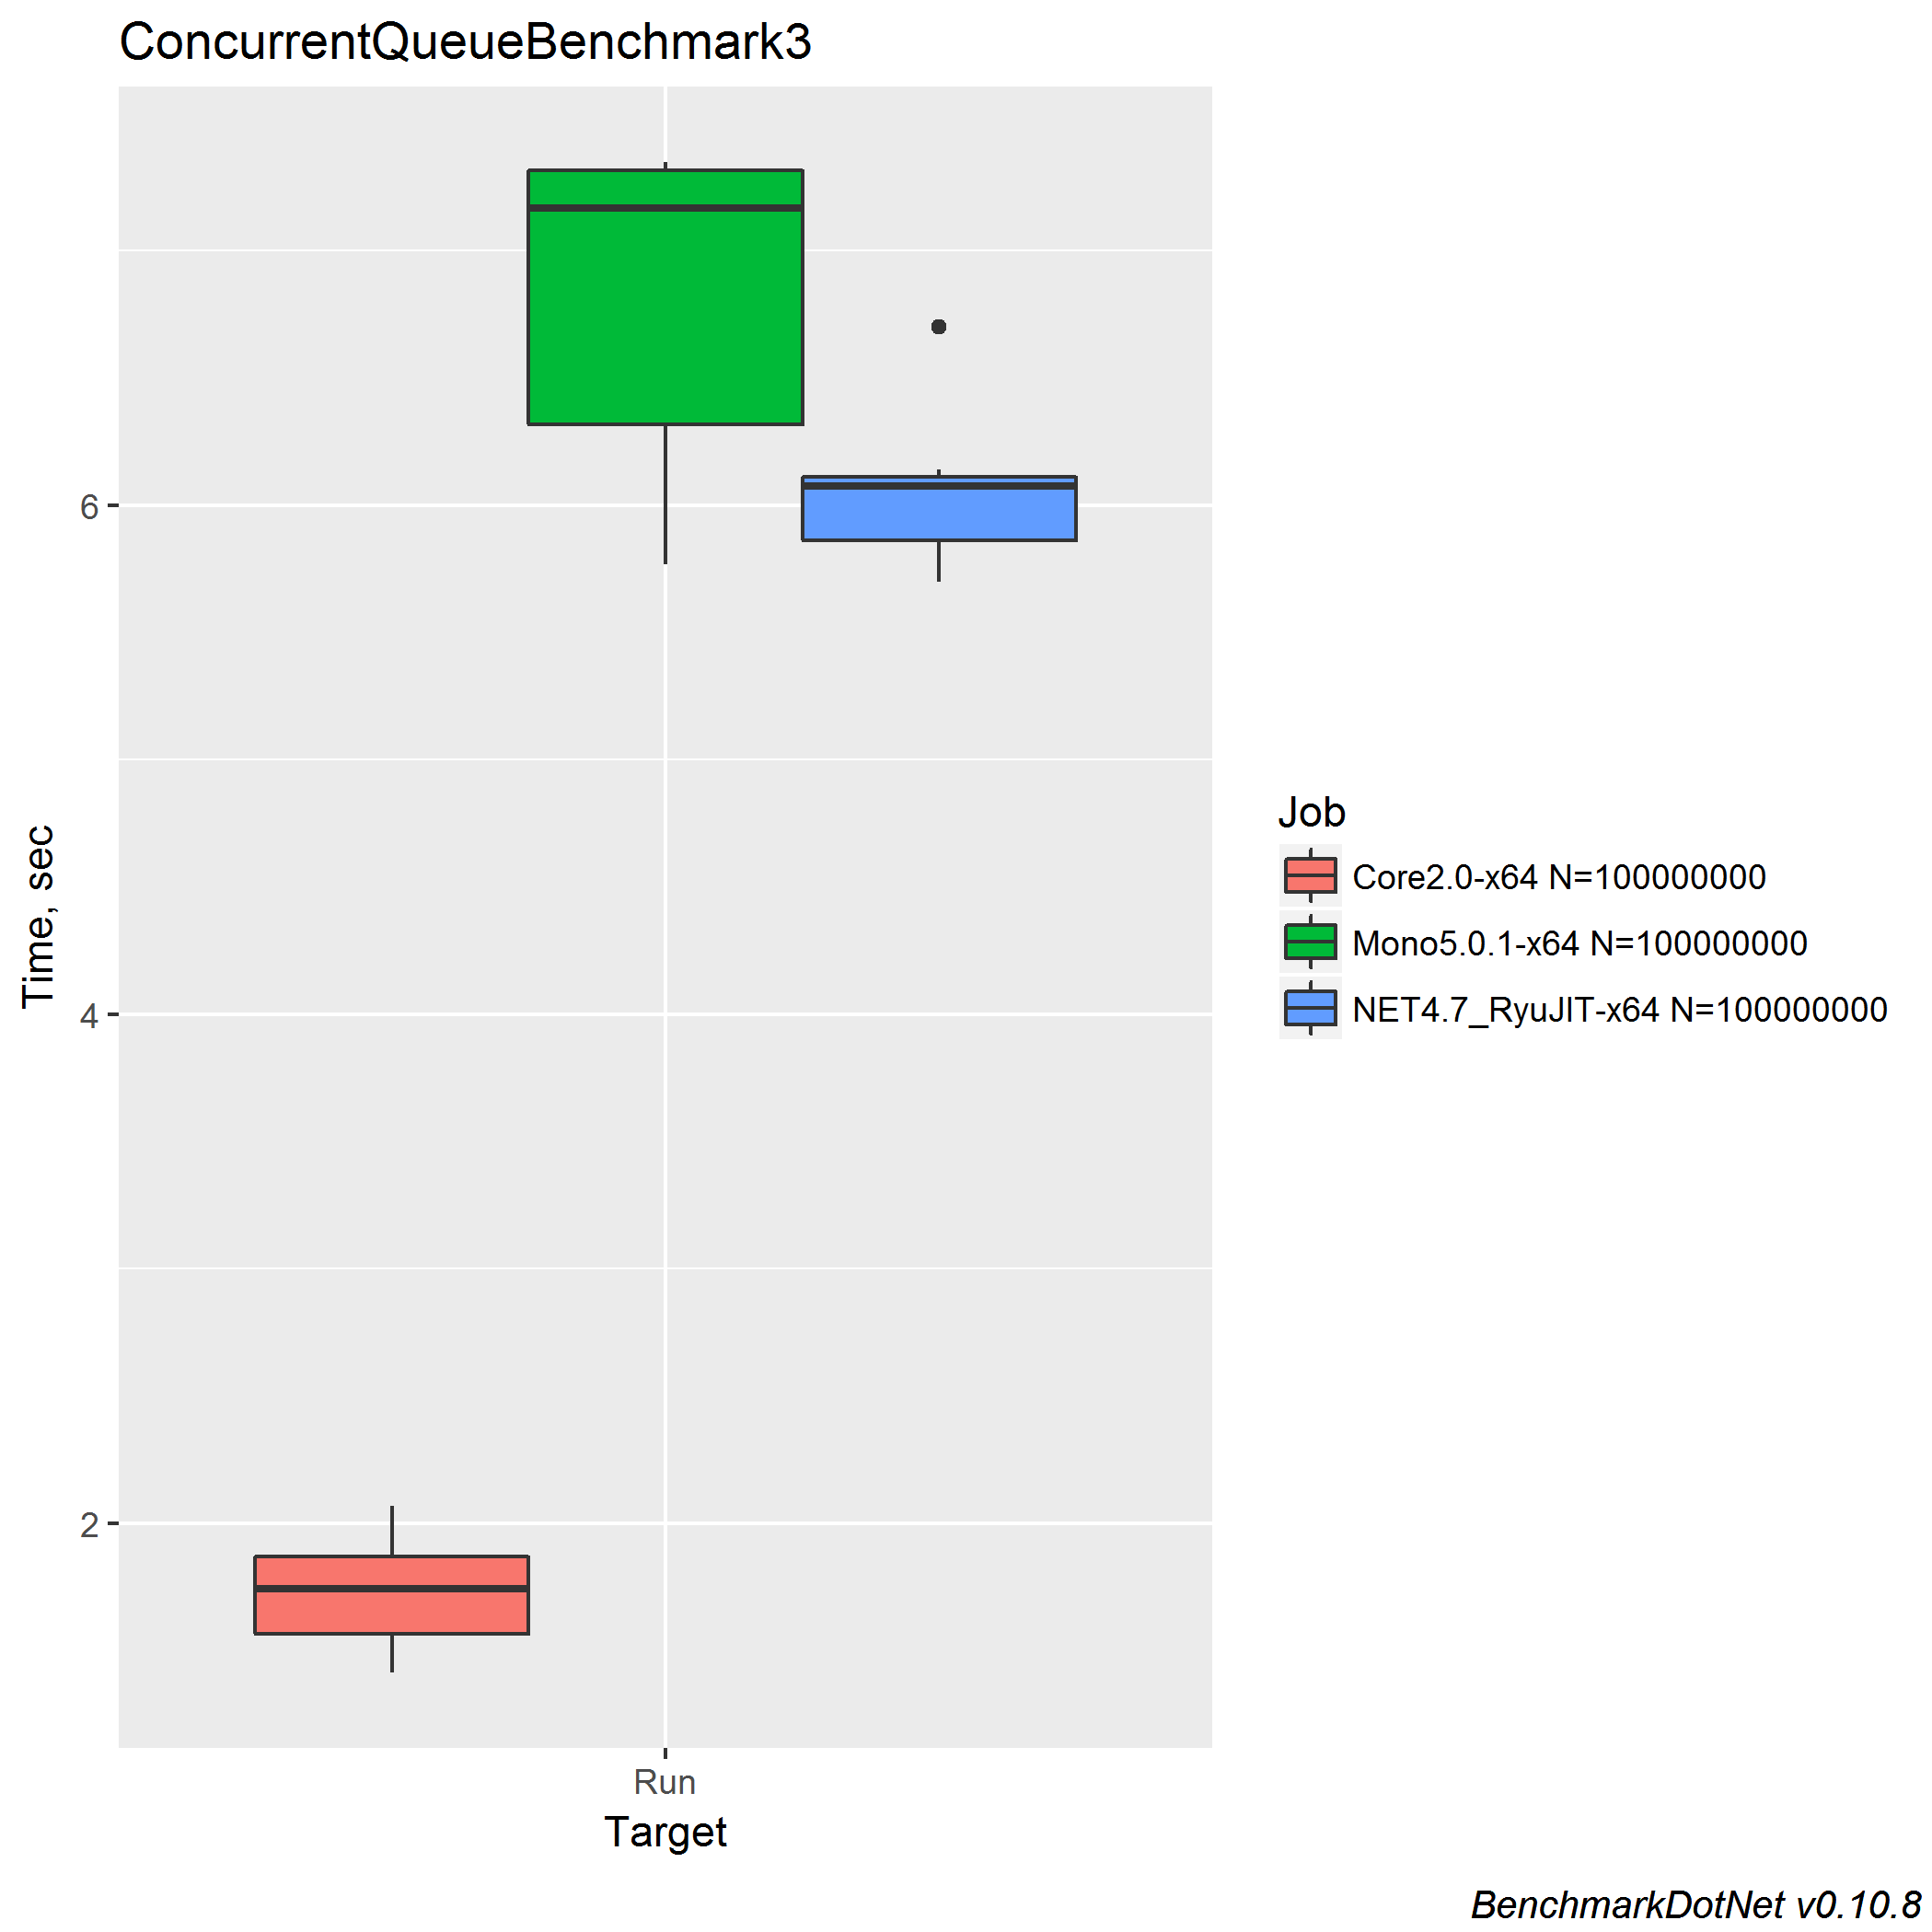
Probably another case of a bimodal distribution? Let’s look at the density plot:

It’s not a bimodal distribution; it’s just a distribution of strange form with huge StdDev.
ConcurrentBag
The original benchmark:
while (true)
{
  var q = new ConcurrentBag<int>() { 1, 2 };
  var sw = new Stopwatch();

  int gen0 = GC.CollectionCount(0), gen1 = GC.CollectionCount(1), gen2 = GC.CollectionCount(2);
  sw.Start();

  for (int i = 0; i < 100_000_000; i++)
  {
    q.Add(i);
    q.TryTake(out int _);
  }

  sw.Stop();
  Console.WriteLine($"Elapsed={sw.Elapsed} Gen0={GC.CollectionCount(0) - gen0} Gen1={GC.CollectionCount(1) - gen1} Gen2={GC.CollectionCount(2) - gen2}");
}
The original results:
// .NET Framework 4.7
Elapsed=00:00:06.5672723 Gen0=953 Gen1=0 Gen2=0
Elapsed=00:00:06.4829793 Gen0=954 Gen1=1 Gen2=0
Elapsed=00:00:06.9008532 Gen0=954 Gen1=0 Gen2=0
Elapsed=00:00:06.6485667 Gen0=953 Gen1=1 Gen2=0
Elapsed=00:00:06.4671746 Gen0=954 Gen1=1 Gen2=0
// .NET Core 2.0 Preview 1
Elapsed=00:00:04.3377355 Gen0=0 Gen1=0 Gen2=0
Elapsed=00:00:04.2892791 Gen0=0 Gen1=0 Gen2=0
Elapsed=00:00:04.3101593 Gen0=0 Gen1=0 Gen2=0
Elapsed=00:00:04.2652497 Gen0=0 Gen1=0 Gen2=0
Elapsed=00:00:04.2808077 Gen0=0 Gen1=0 Gen2=0
A new benchmark:
[Config(typeof(MainConfig))]
[BenchmarkCategory("Collections")]
[MemoryDiagnoser]
public class ConcurrentBag
{
  private ConcurrentBag<int> q = new ConcurrentBag<int> { 1, 2 };

  [Benchmark]
  public void Run()
  {
    q.Add(0);
    q.TryTake(out int _);
  }
}
| Job | Mean | Error | StdDev | Gen 0 | Allocated |
|---|---|---|---|---|---|
| Core2.0-x64 | 56.47 ns | 1.1561 ns | 2.1140 ns | - | 0 B |
| Mono5.0.1-x64 | 162.82 ns | 0.2874 ns | 0.2548 ns | 0.0086 | N/A |
| NET4.7_RyuJIT-x64 | 82.52 ns | 0.2572 ns | 0.2008 ns | 0.0126 | 40 B |
The original speedup is ~1.5x, the new speedup is ~1.37x (almost the same).
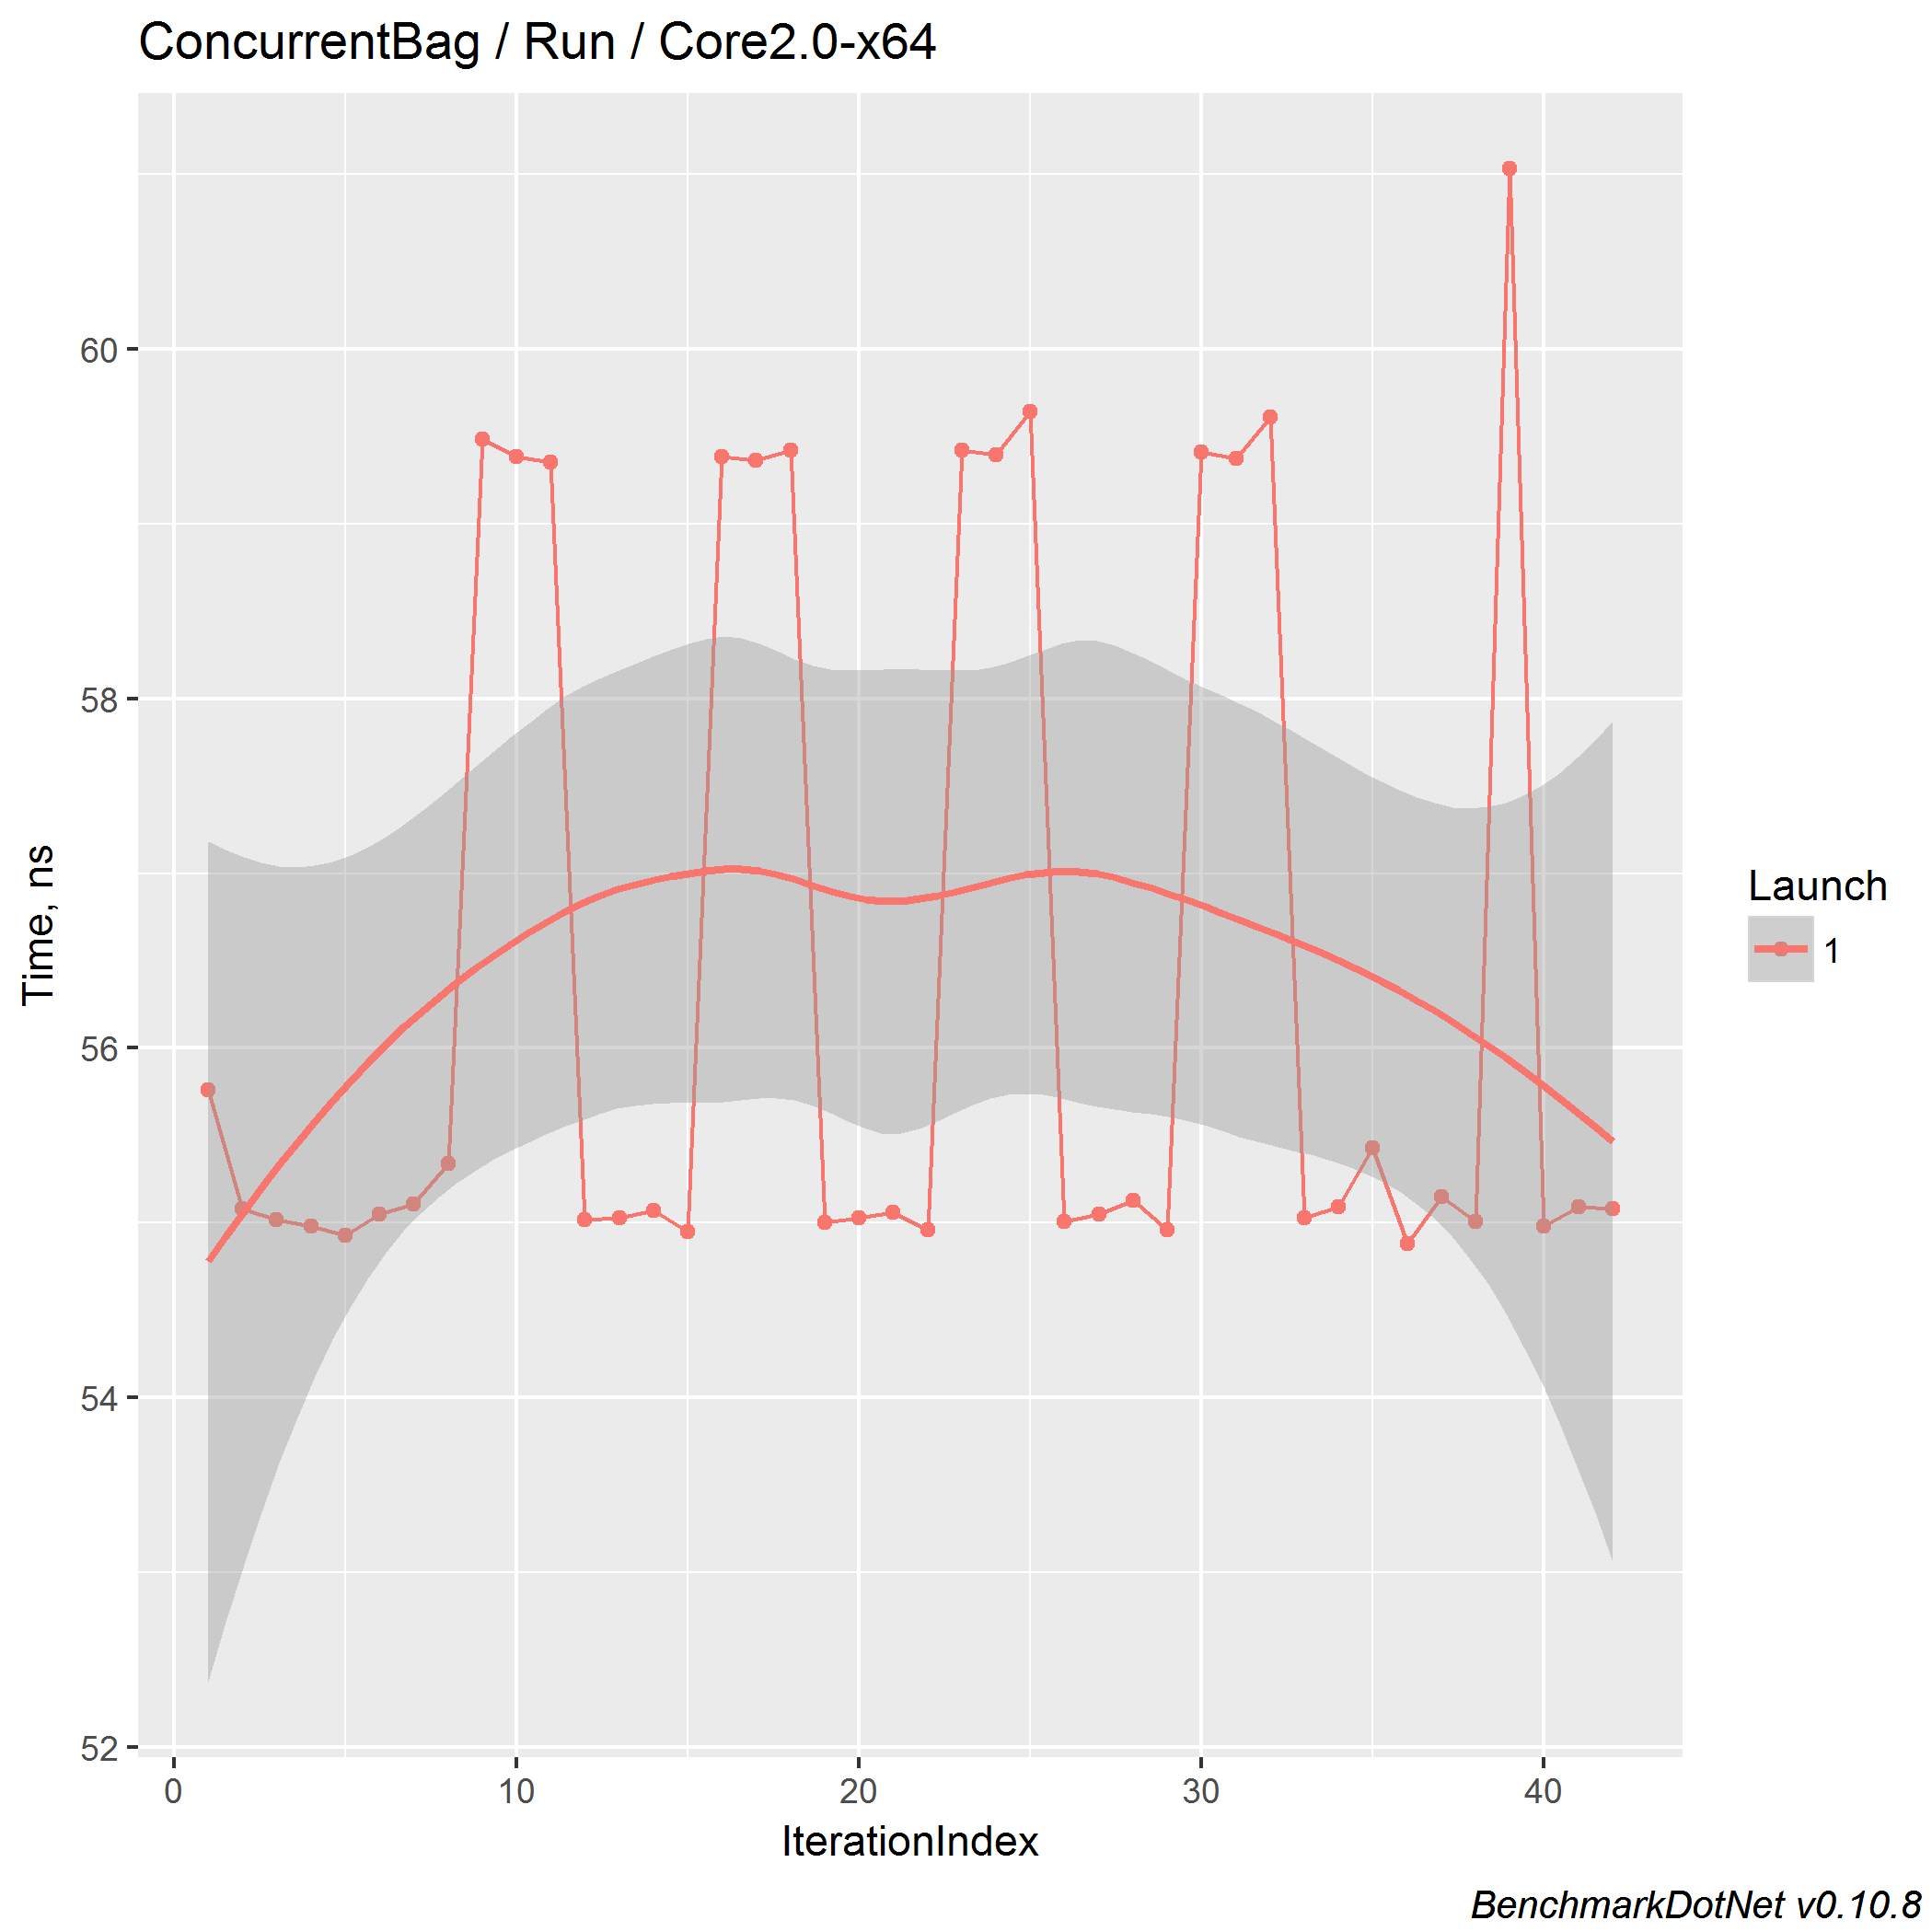
By the way, Mono works slowly again: about two times slower than the full framework.
On .NET Core 2.0 Preview 1, we got another bimodal distributions, here is a timeline plot:
Conclusion
Could we say that .NET Core is always the fastest runtime? No. We looked only at specific cases related to coreclr-specific optimizations. These benchmarks are designed to show how fast .NET Core is. I’m no saying that .NET Core is a bad runtime, I’m saying that I can write an own set of benchmarks which show that the best runtime is the .NET Framework or Mono. Anyway, .NET Core is a great project. Guys from Microsoft (with the help of the community) did (and continue to do) an awesome job. The .NET Core indeed has awesome performance improvements. However, it’s not a good idea to blindly believe that the .NET Core will always be super-fast for all the cases. (Also it’s not a good idea to blindly believe in any information which you read on the internet.)
If you are want to migrate to .NET Core and get better performance for free, you should write own benchmarks first. Find bottleneck methods in your software, design the corresponded benchmarks based on users use cases, check different environment, perform a thoughtful analysis (it’s the most important part). Only after this, you can make correct conclusions about the best .NET runtime for you. I hope now you understand that it’s not easy to design proper benchmarks (even if you use BenchmarkDotNet). This activity requires a lot of time and skills.
If you want to check out how it’s work in your environment (or make some additional experiments), here is a repo for you: AndreyAkinshin/StephenToubBenchmarks. In this post, I didn’t make real performance investigations (it wasn’t my purpose): I just tried to explain basic benchmarking concepts and show how to use BenchmarkDotNet. This post contains only drafts of future benchmarks. I wrote it in a few hours and maybe I made mistakes (actually, 90% of any benchmarking activity is making mistakes). However, I hope that you have learned a few interesting benchmarking tricks.
You may notice that I didn’t show all the benchmarks from the original post. I implemented almost all of them in the GitHub repo, but I just didn’t have enough time to collect all measurements and write explanations. There are a lot of interesting fundamental benchmark errors there, but I want to get some feedback first. Is it an interesting topic? Is it worth to explain all the benchmarks and how they can be improved? If so, I will be happy to explain in detail what happens in each case (I hope that these explanations will help people to design correct benchmark for similar cases).