Probability of observing outliers using Tukey's fences
Tukey’s fences is one of the most popular simple outlier detectors for one-dimensional number arrays. This approach assumes that for a given sample, we calculate first and third quartiles ($Q_1$ and $Q_3$), and mark all the sample elements outside the interval
$$ [Q_1 - k (Q_3 - Q_1),\, Q_3 + k (Q_3 - Q_1)] $$as outliers. Typical recommendation for $k$ is $1.5$ for “regular” outliers and $3.0$ for “far outliers”. Here is a box plot example for a sample taken from the standard normal distributions (sample size is $1000$):

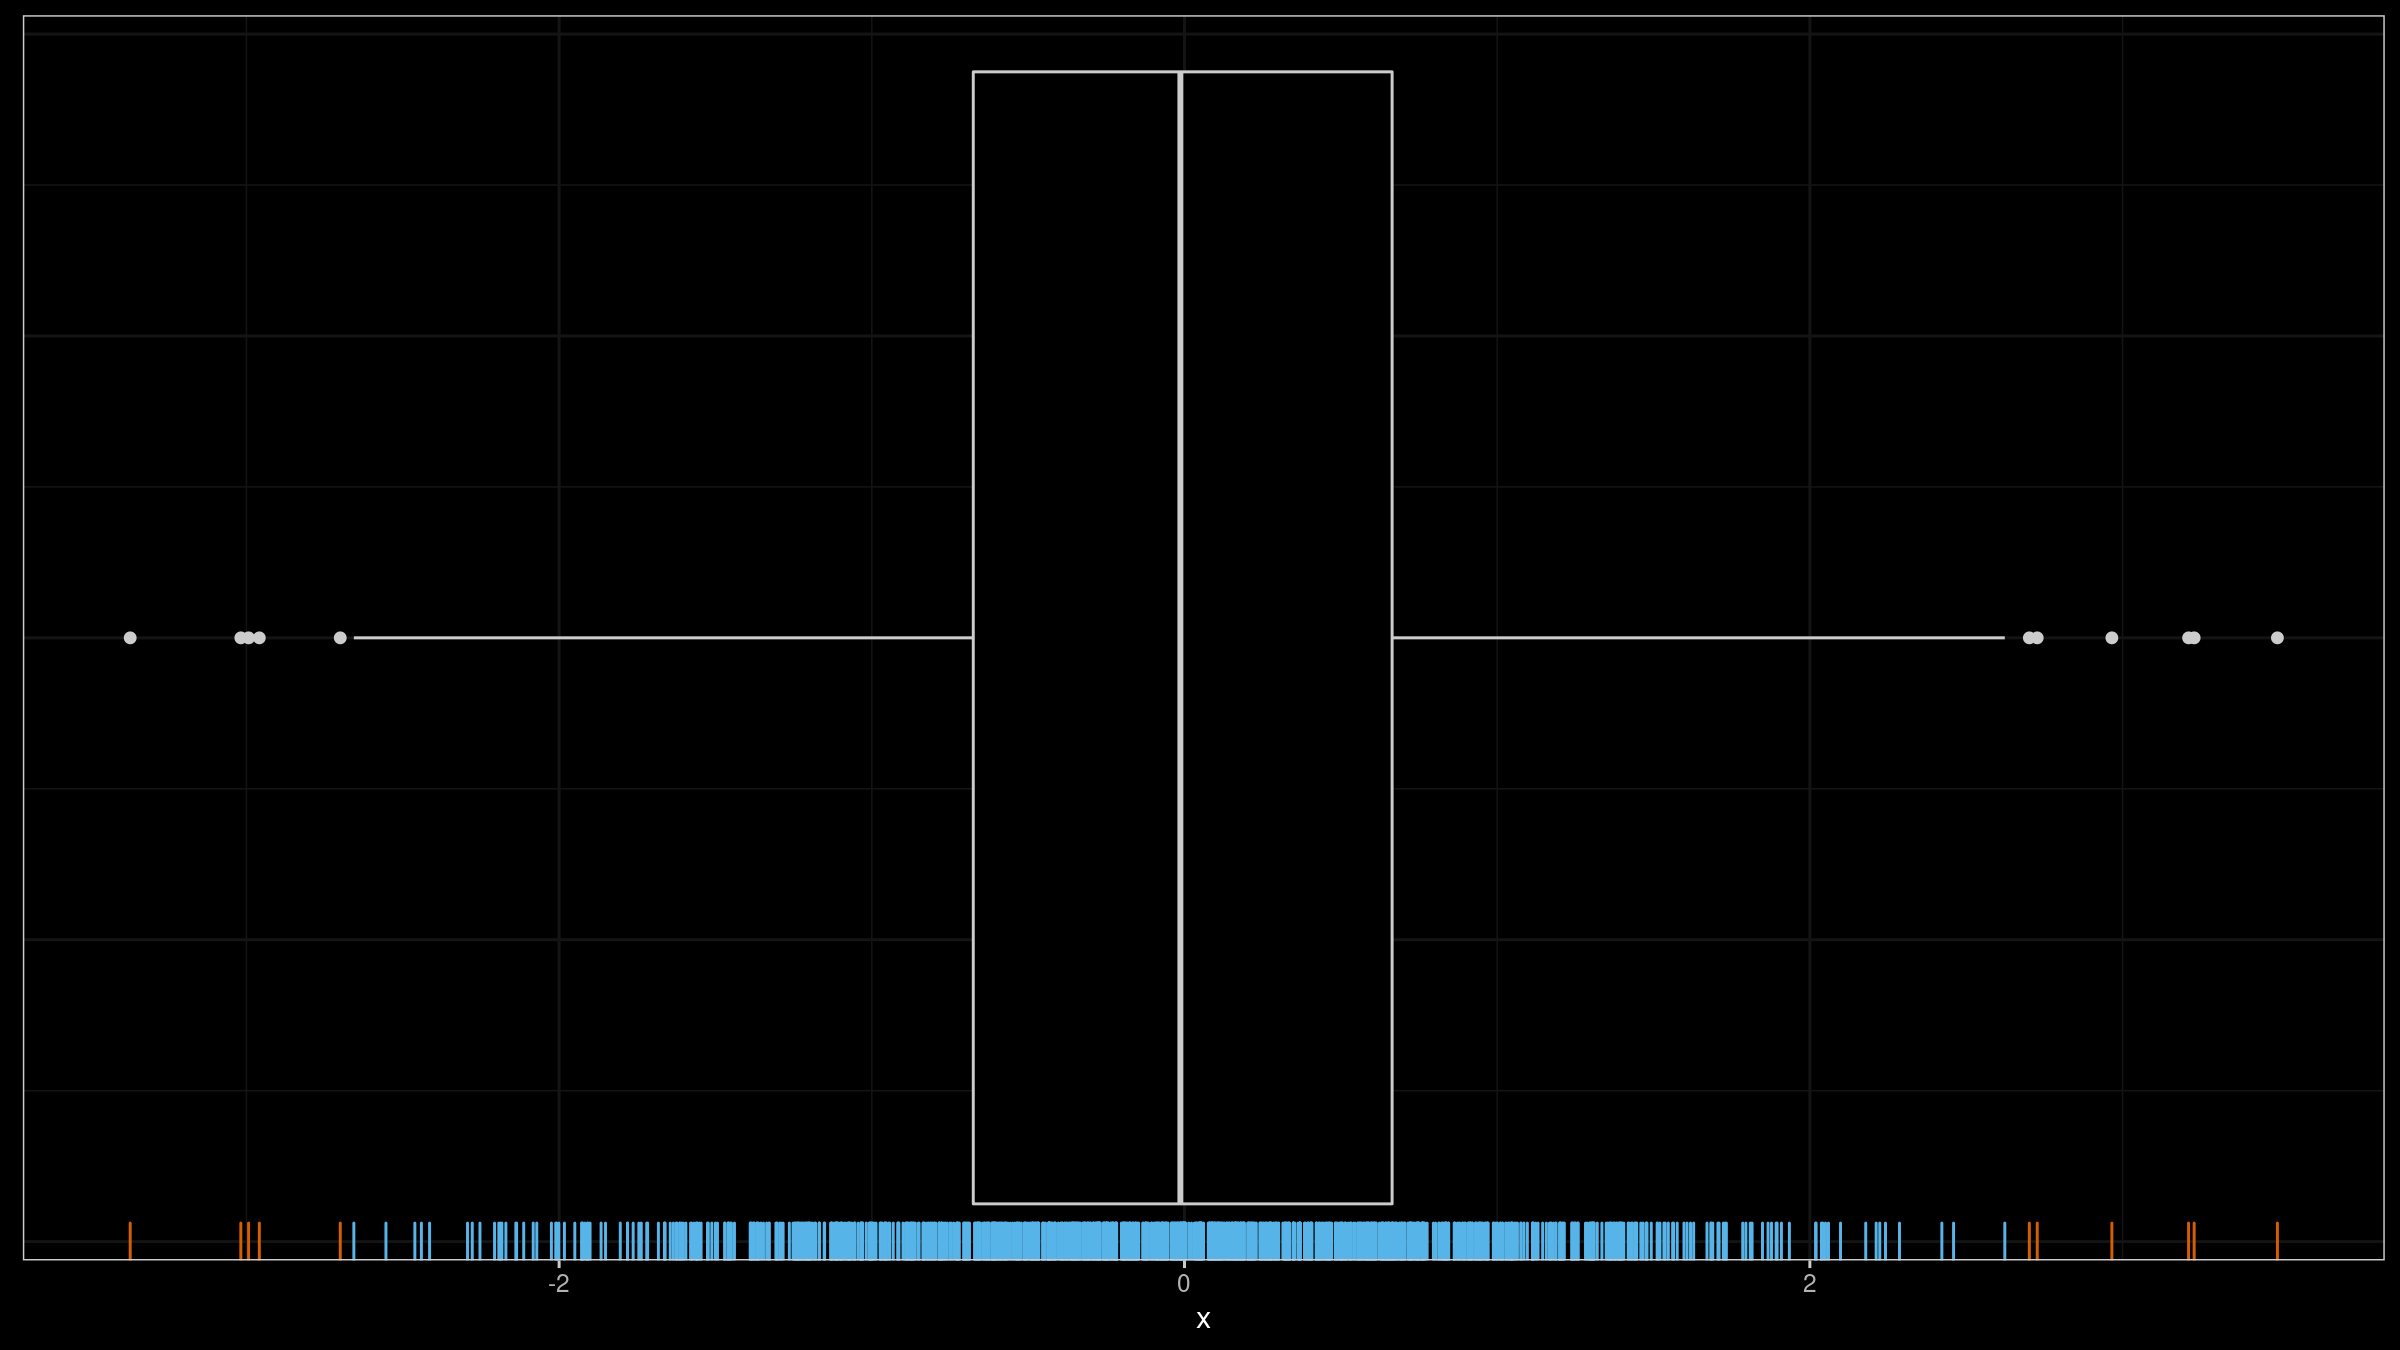
As we can see, 11 elements were marked as outliers (shown as dots). Is it an expected result or not? The answer depends on your goals. There is no single definition of an outlier. In fact, the chosen outlier detector provides a unique outlier definition.
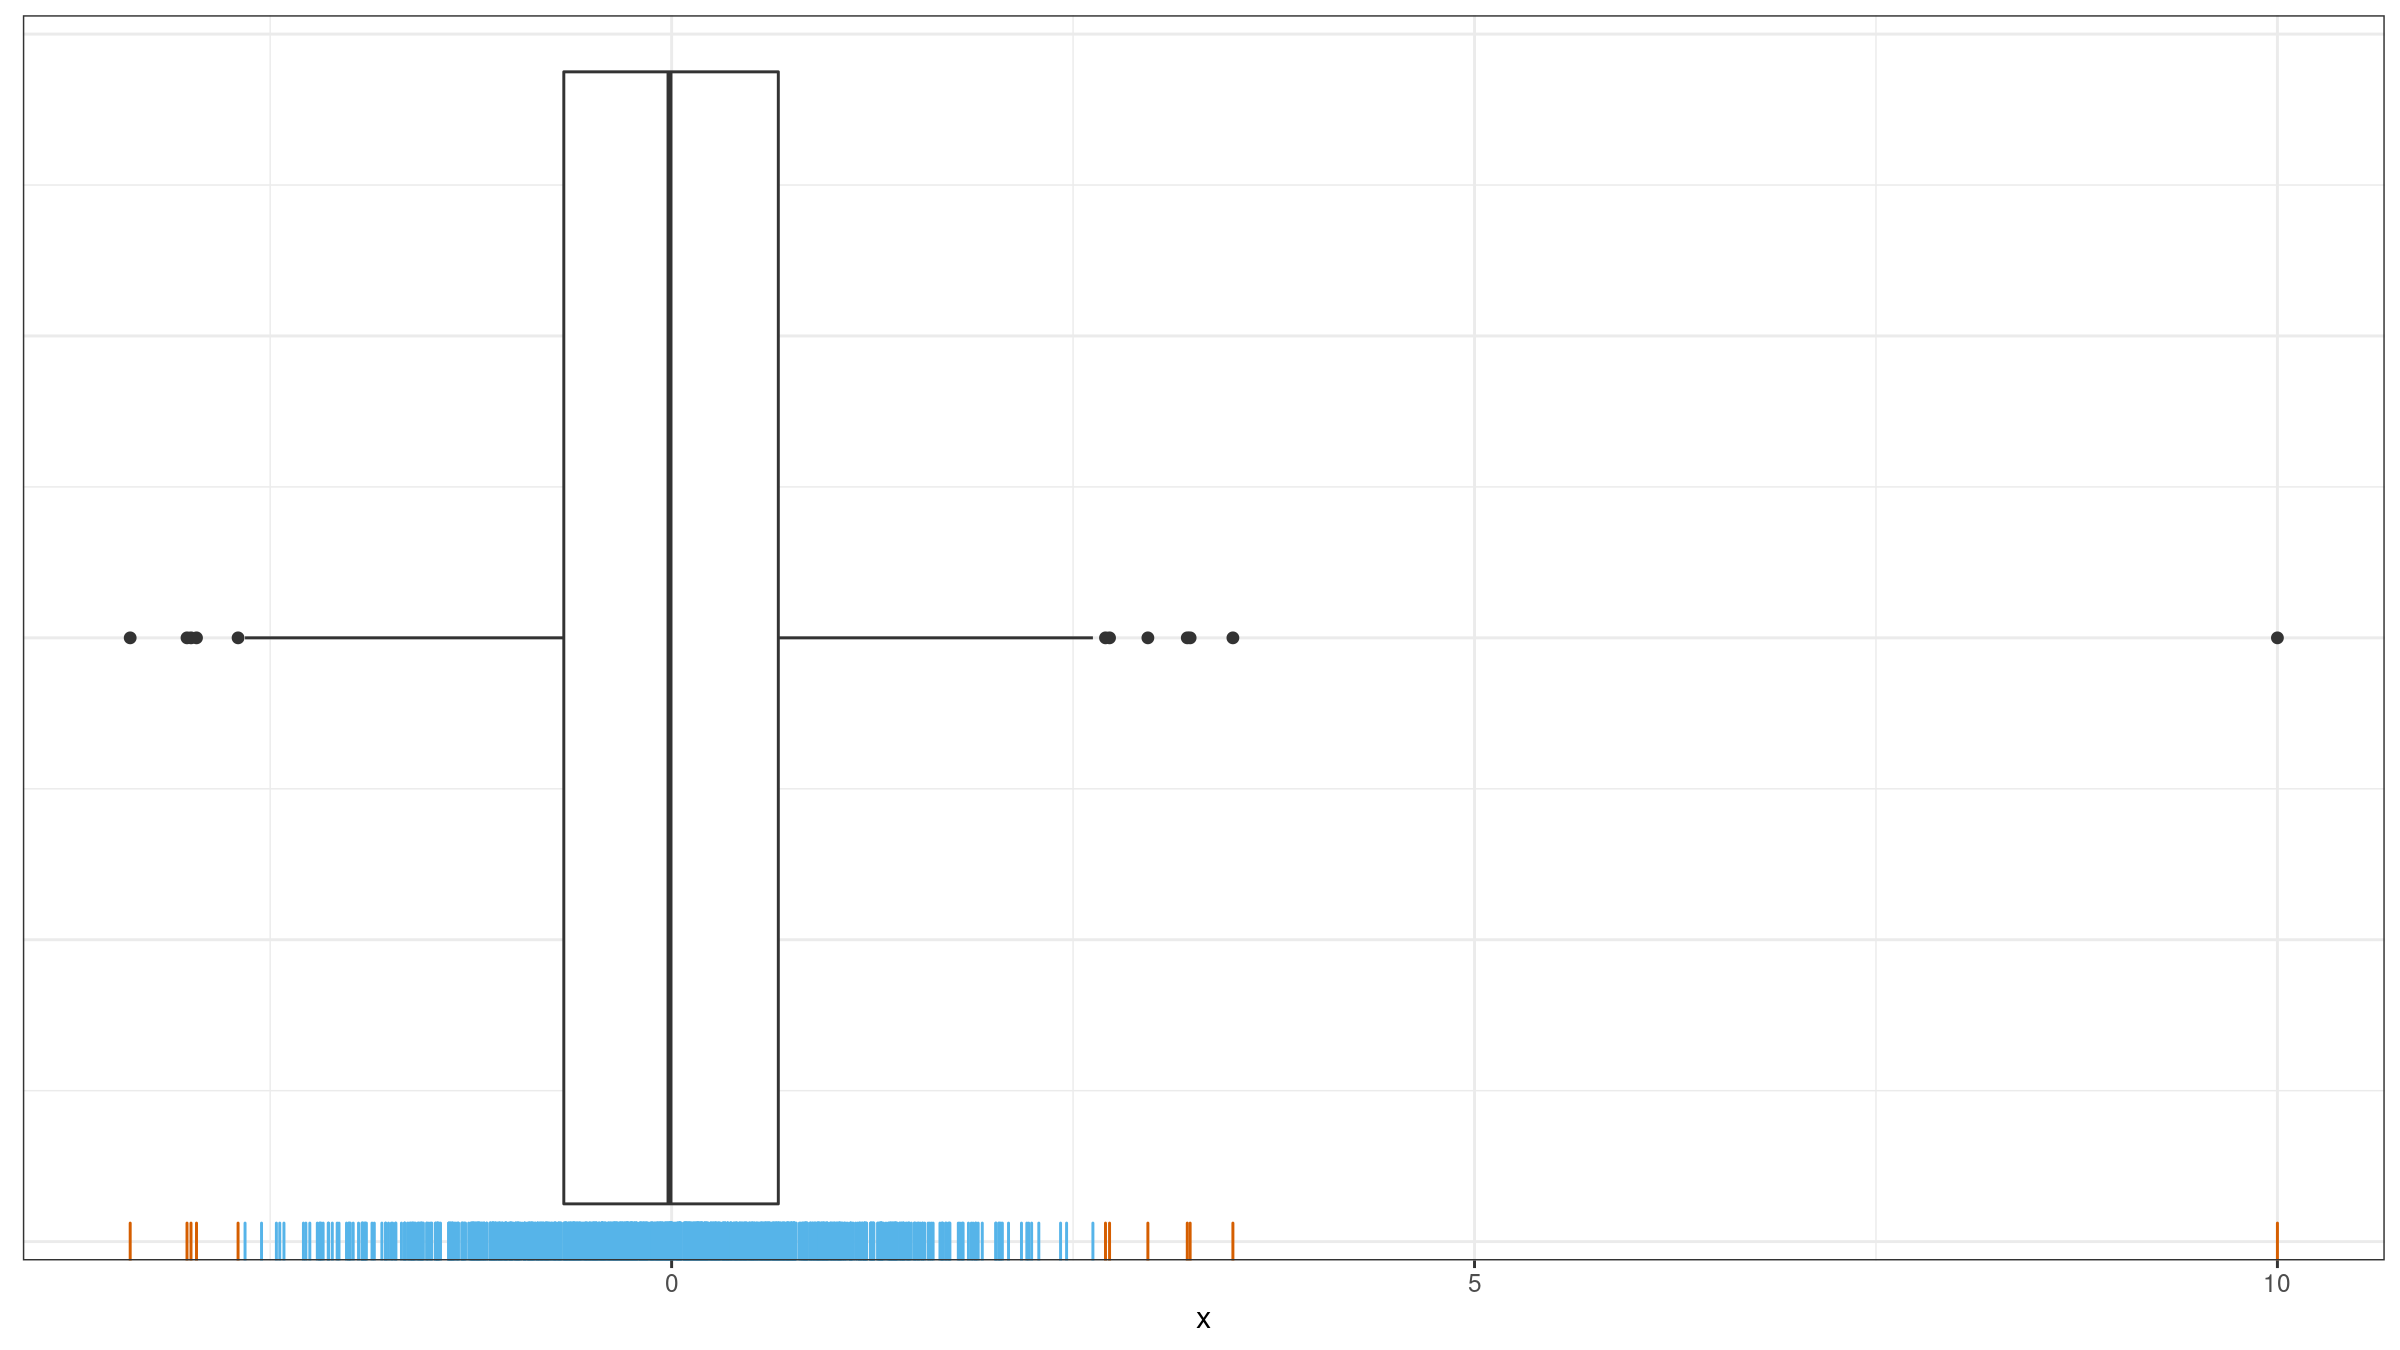
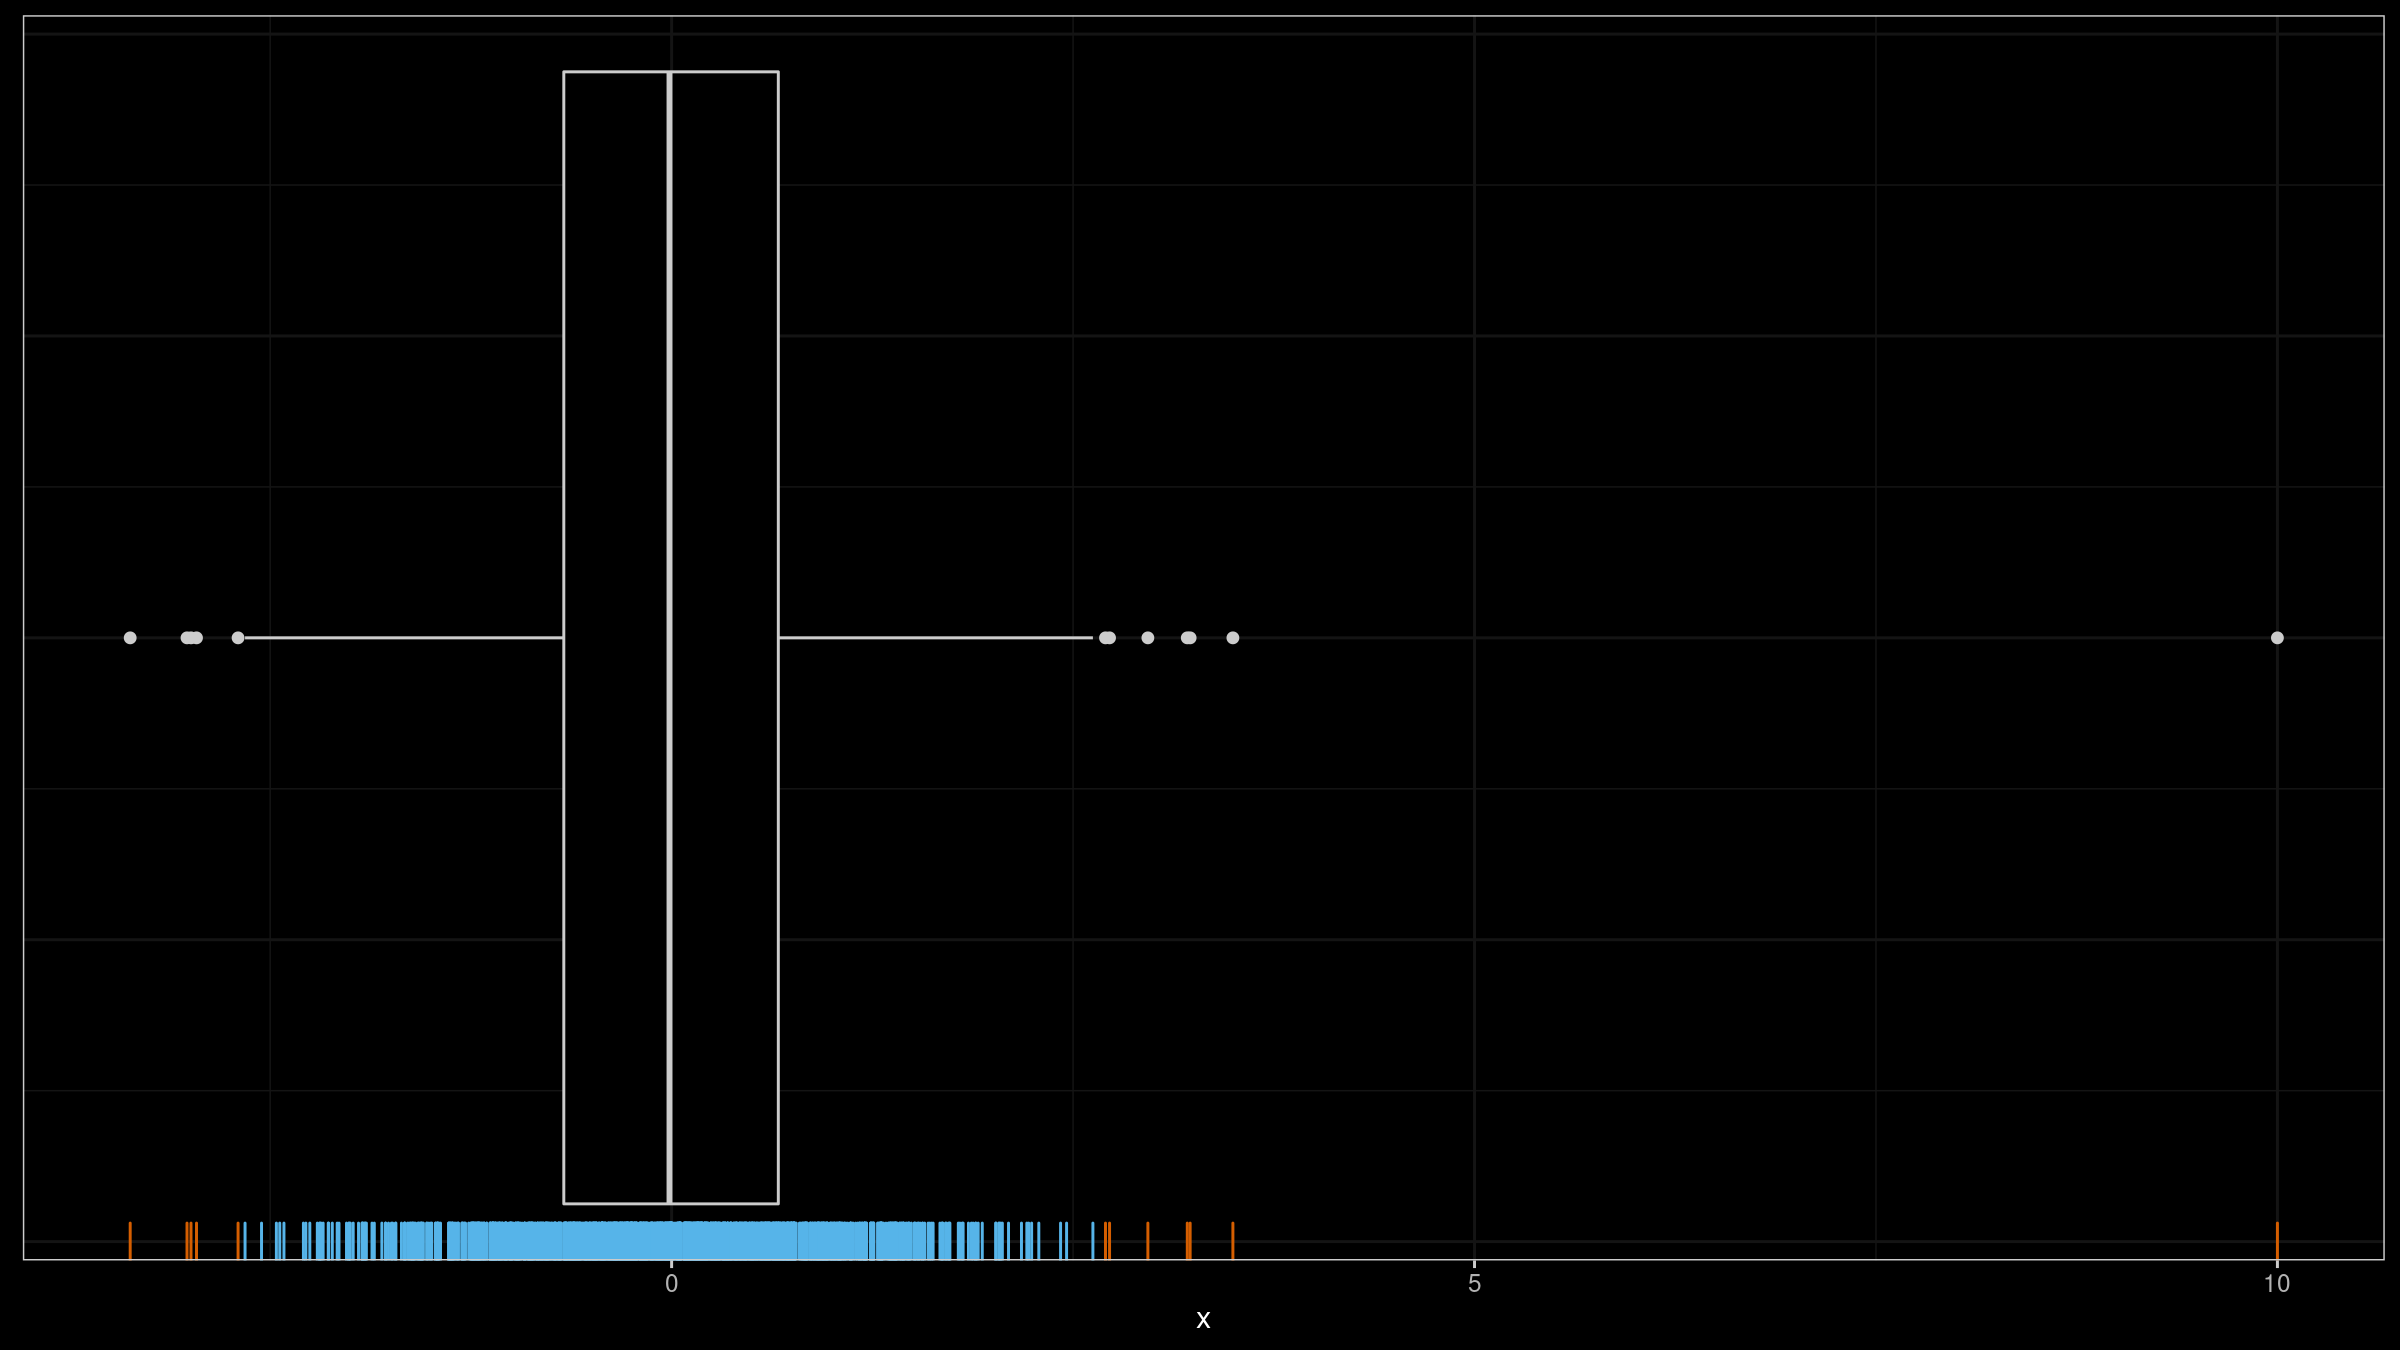
In my applications, I typically consider outliers as rare events that should be investigated. When I detect too many outliers, all such reports become useless noise. For example, on the above image, I wouldn’t treat any of the sample elements as outliers. However, If we add $10.0$ to this sample, this element is an obvious outlier (which will be the only one):
Thus, an important property of an outlier detector is the “false positive rate”: the percentage of samples with detected outliers which I wouldn’t treat as outliers. In this post, I perform numerical simulations that show the probability of observing outliers using Tukey’s fences with different $k$ values.
Numerical simulations
Let’s conduct the following numerical simulation:
- Enumerate different distributions. We consider the standard normal distribution, the standard Gumbel distribution, and the standard exponential distribution.
- Enumerate different $k$ values. We consider $k \in \{ 1.5, 2.0, 2.5, 3.0, 3.5 \}$.
- Enumerate different samples sizes from 6 to 500.
- Generate 1000 random samples from the given distribution of the given size.
- For each sample, detect outliers using the considered $k$ values.
- Evaluate the percentage of samples that contain at least one outlier.
Here are the results:
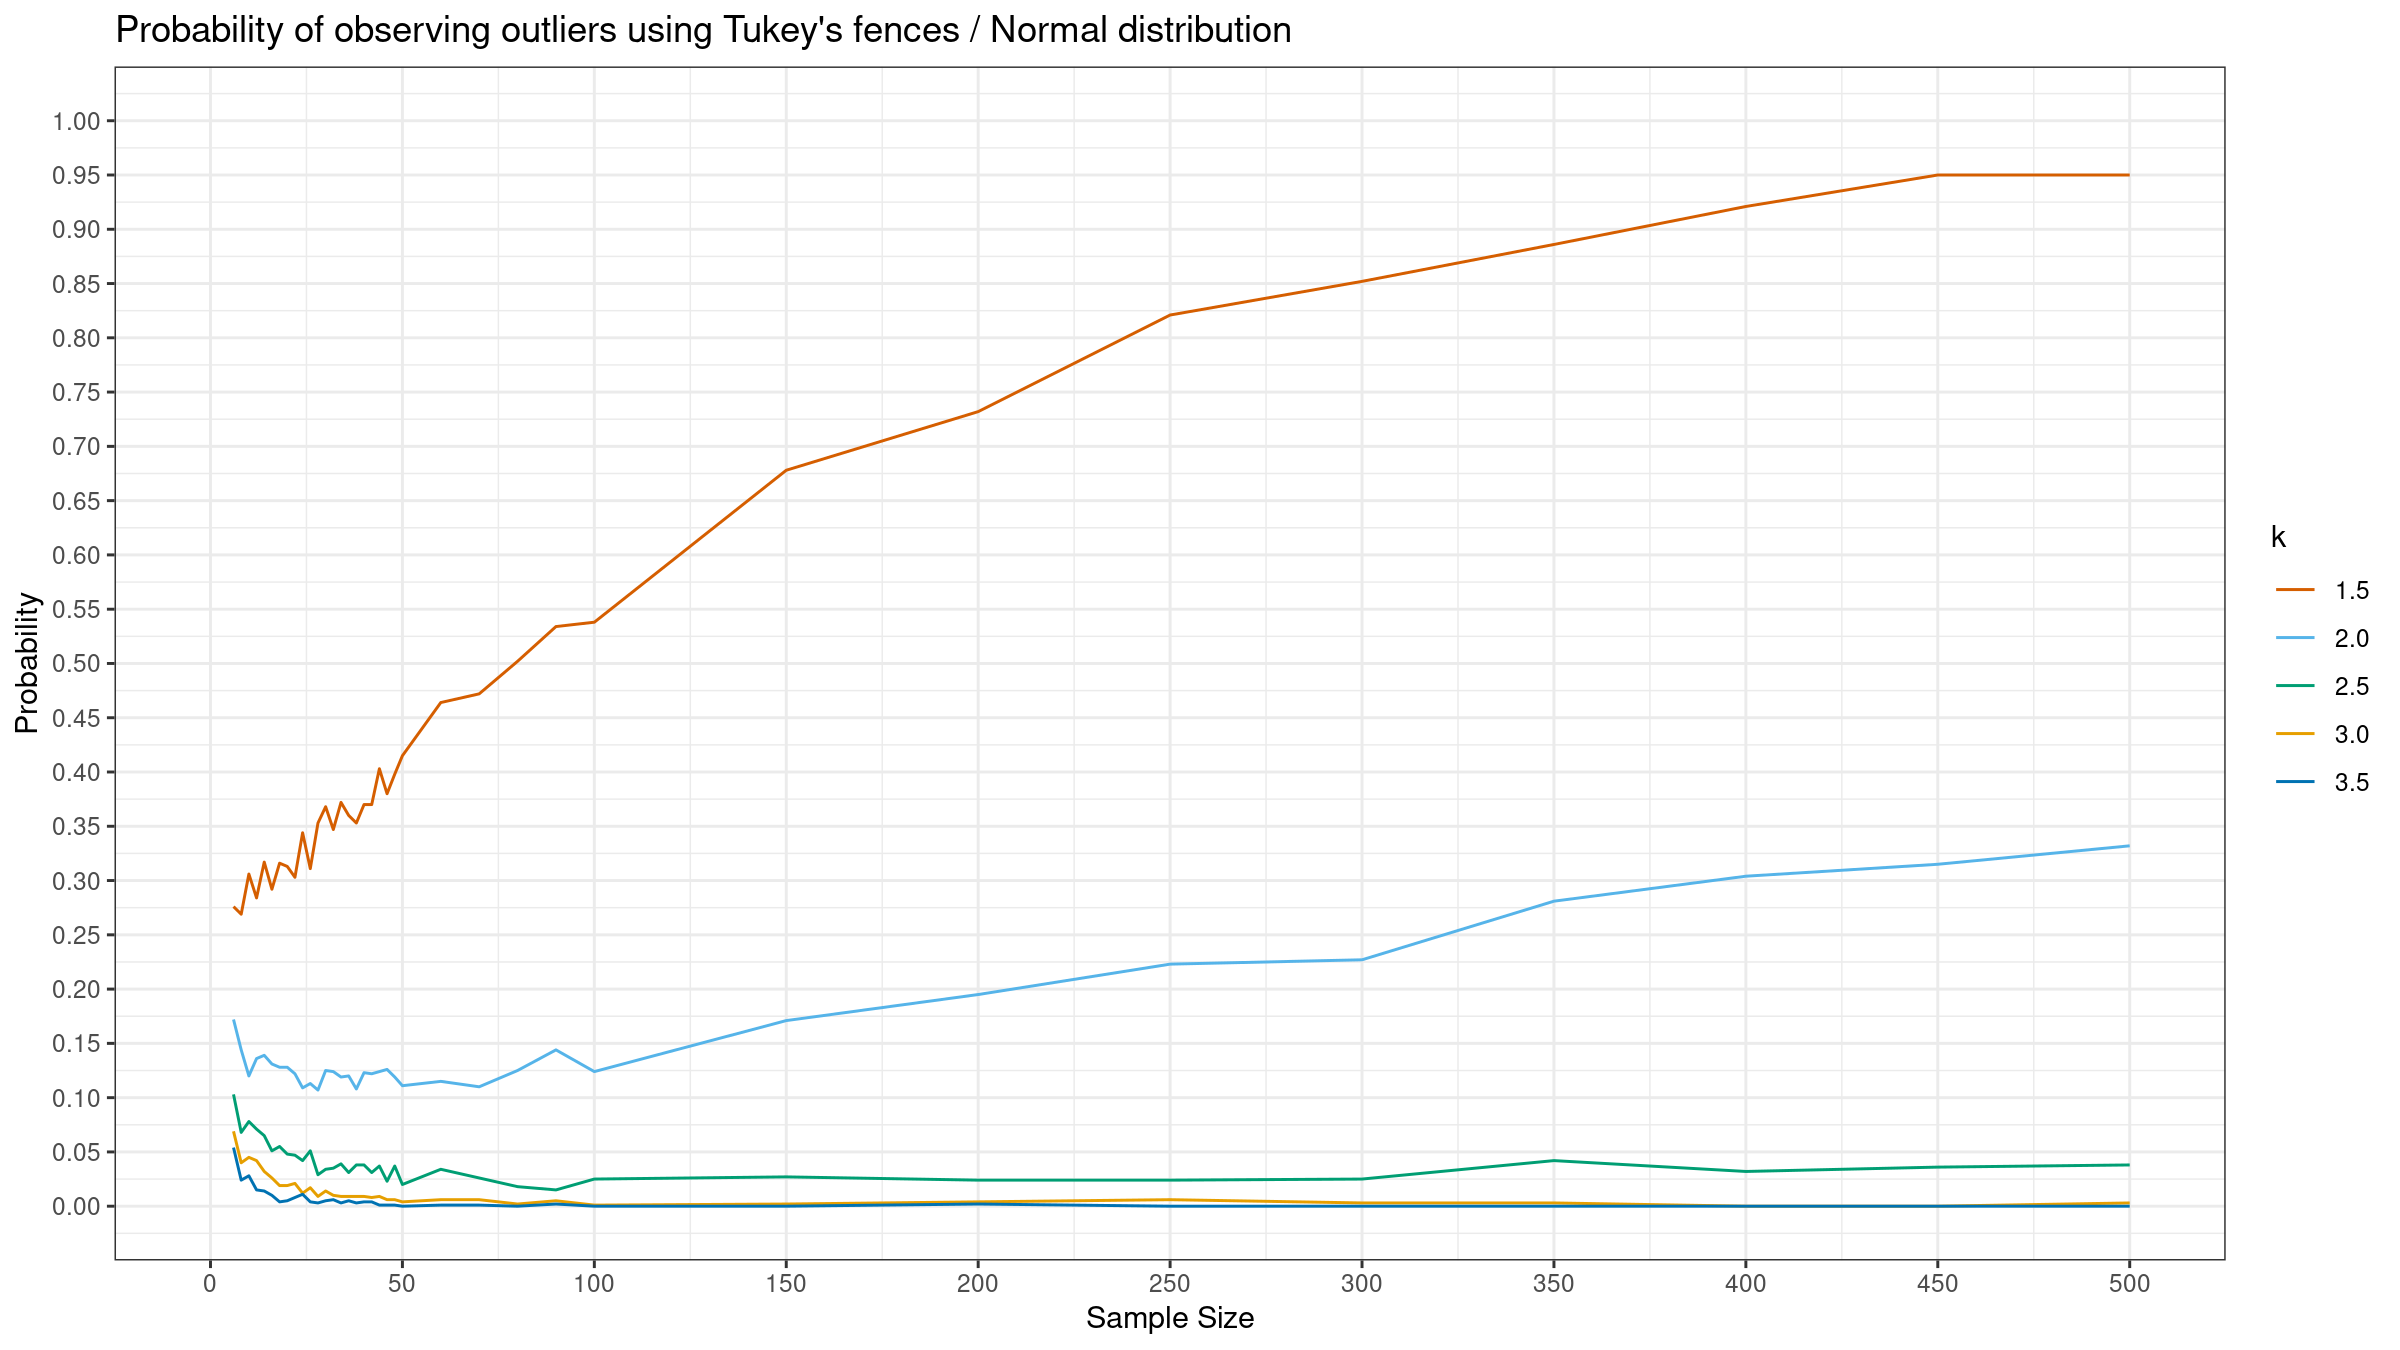
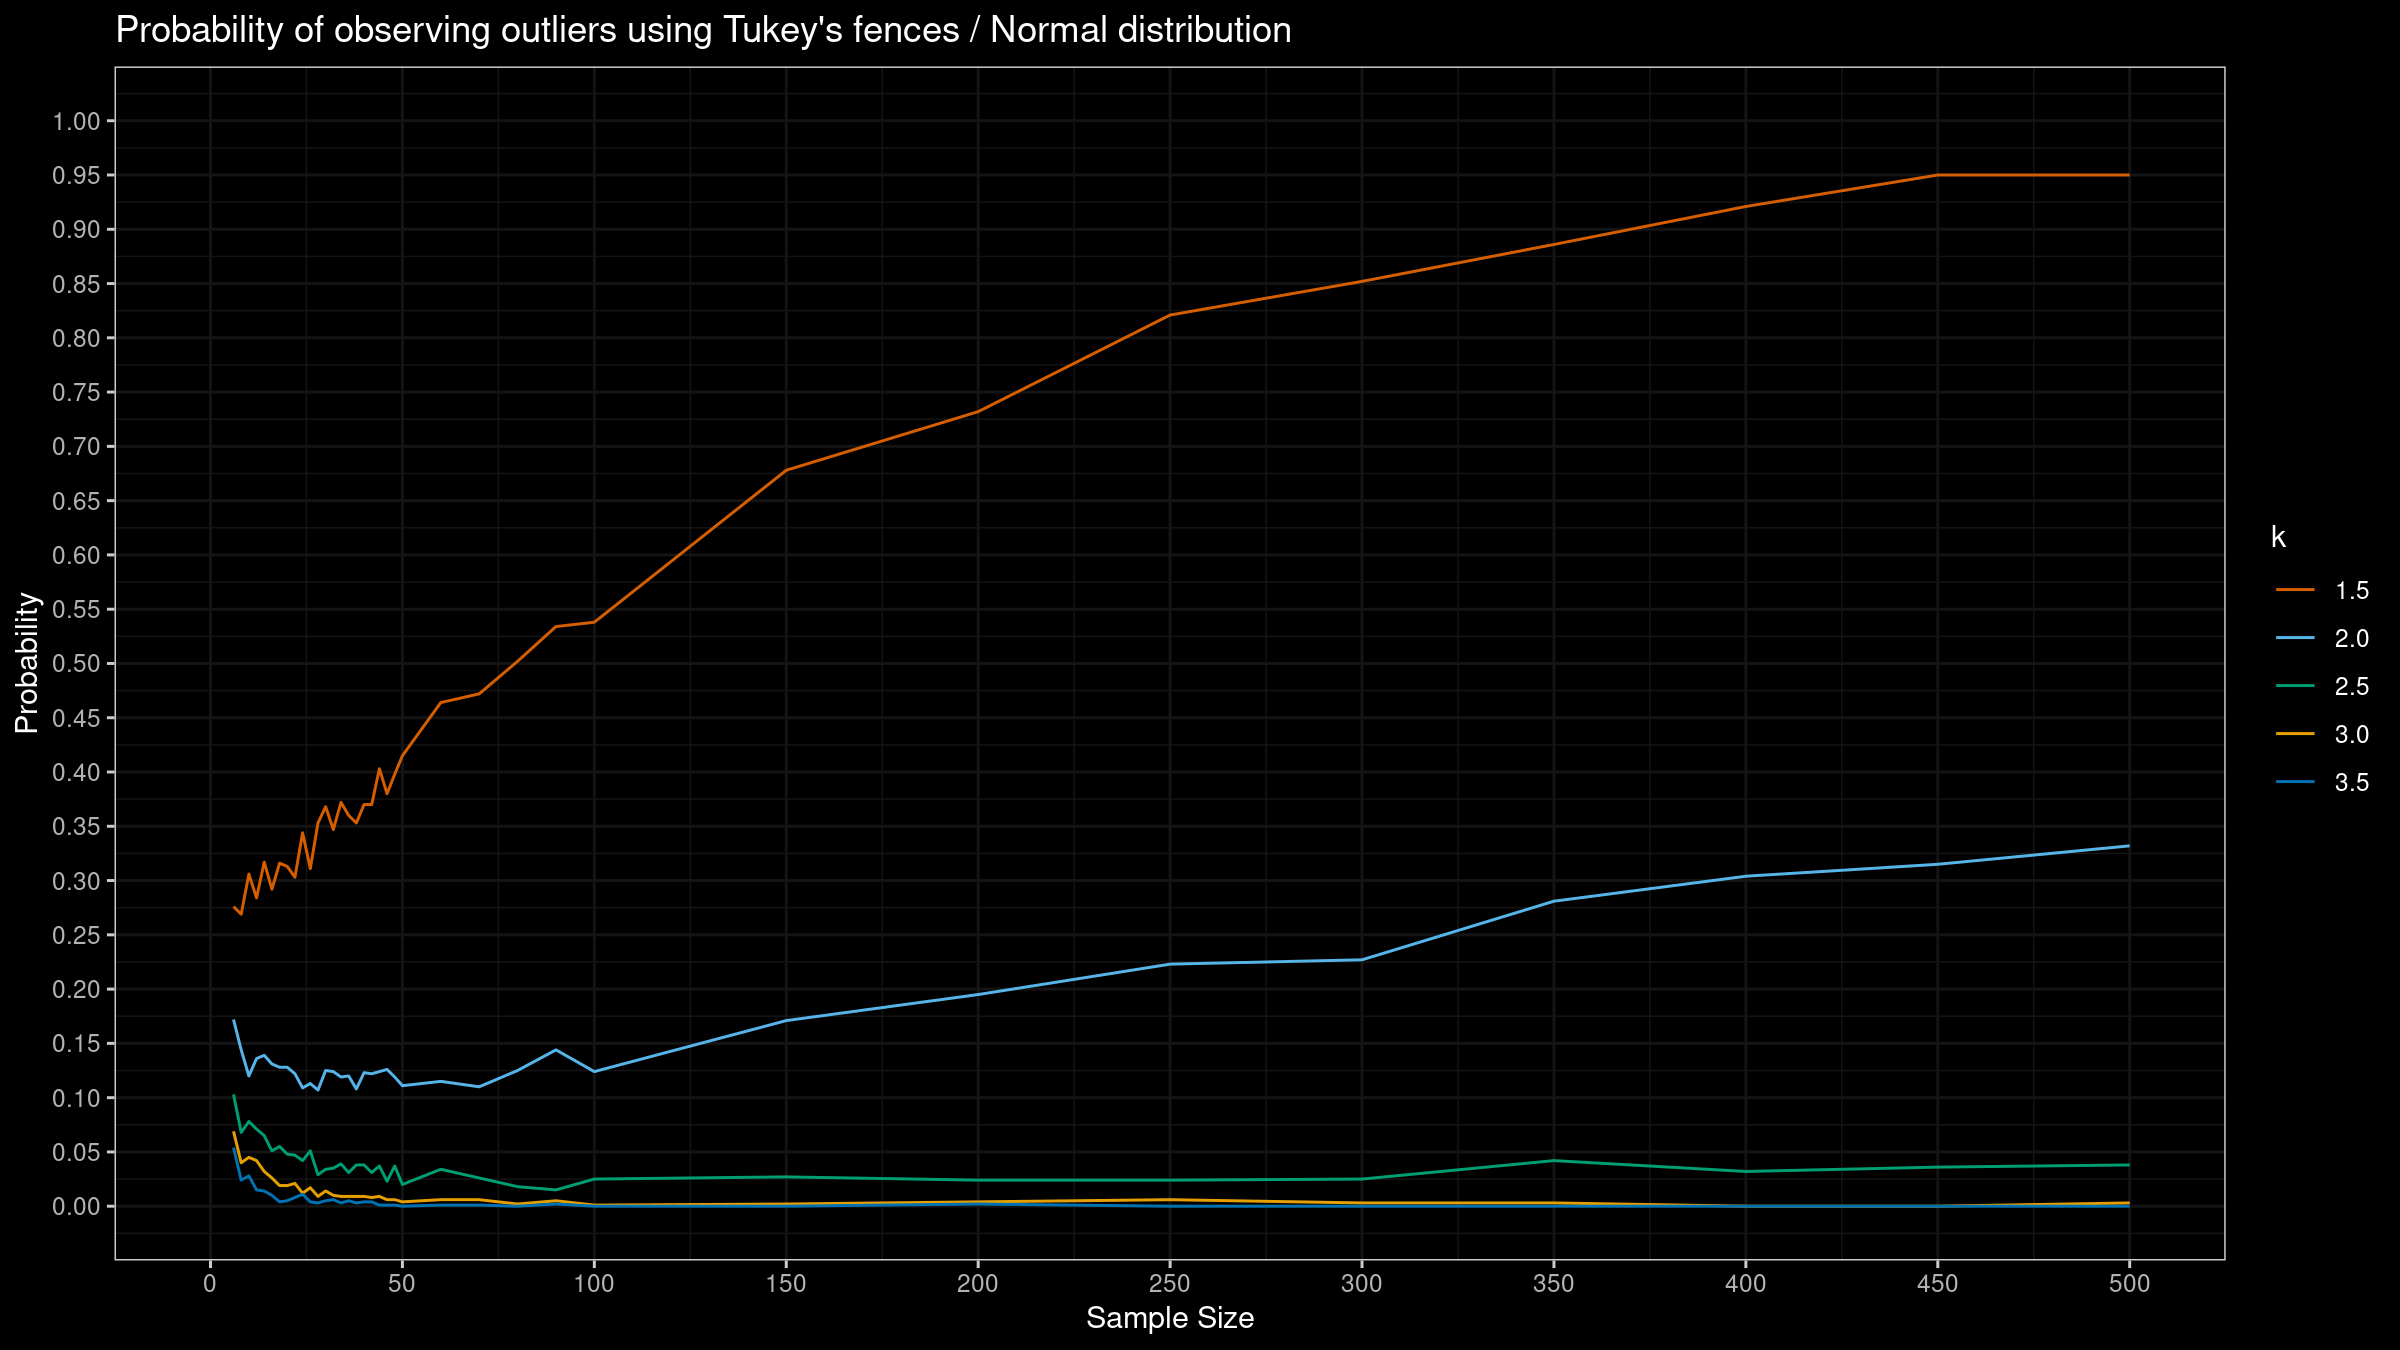
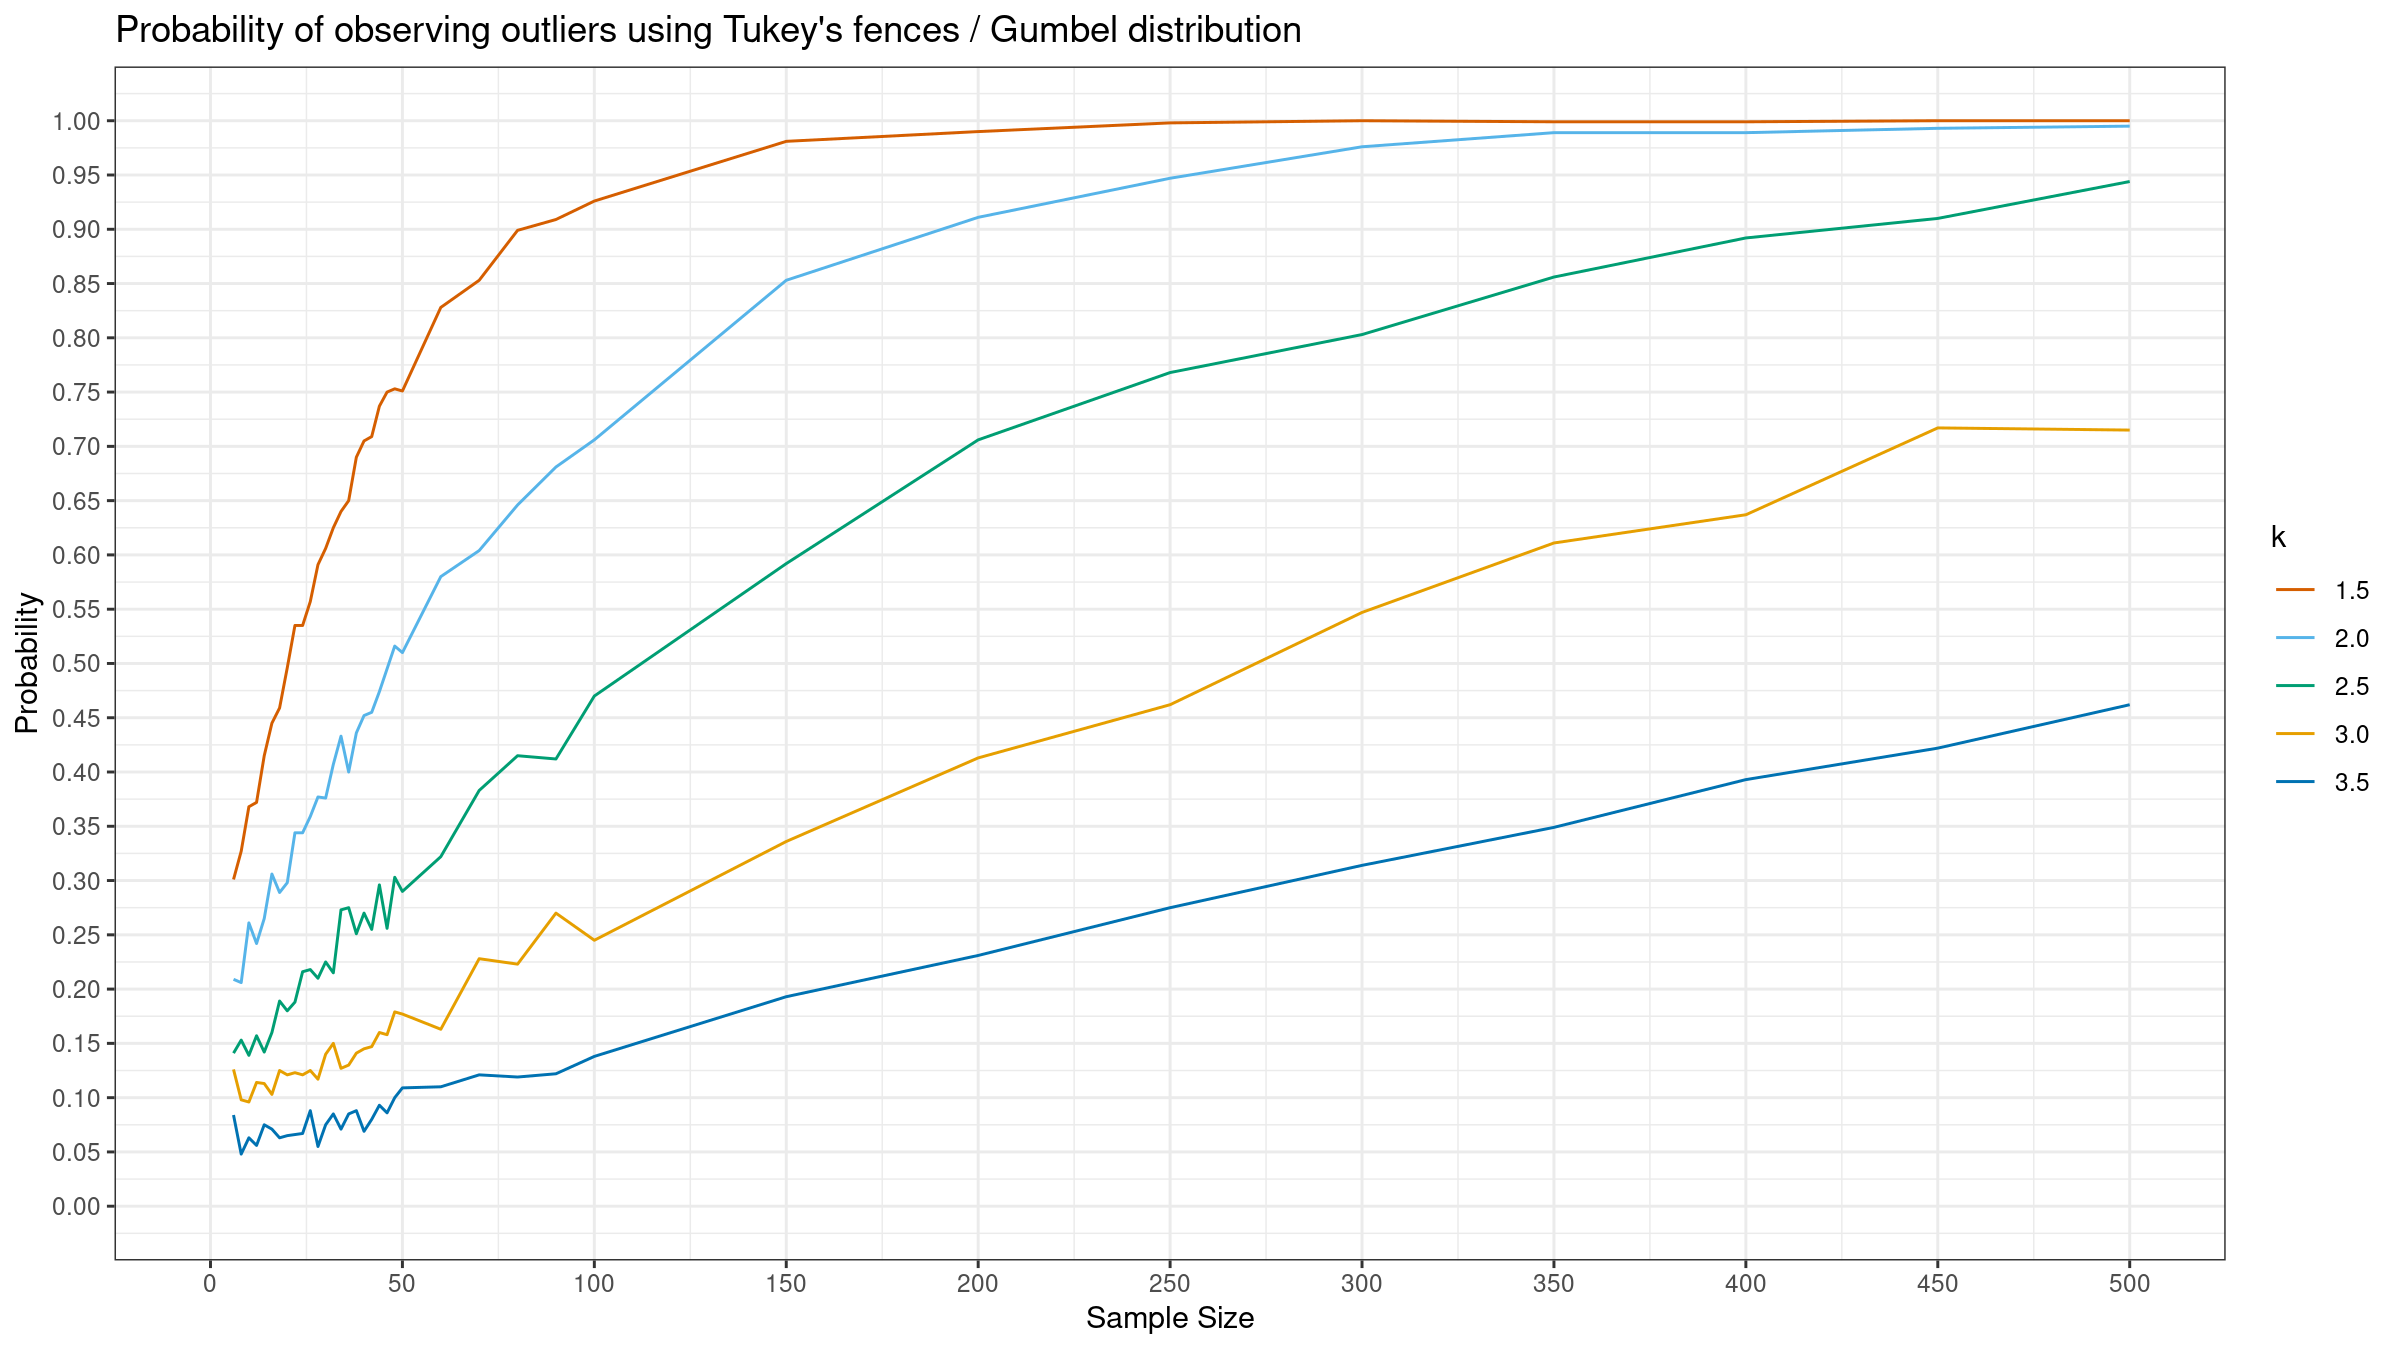
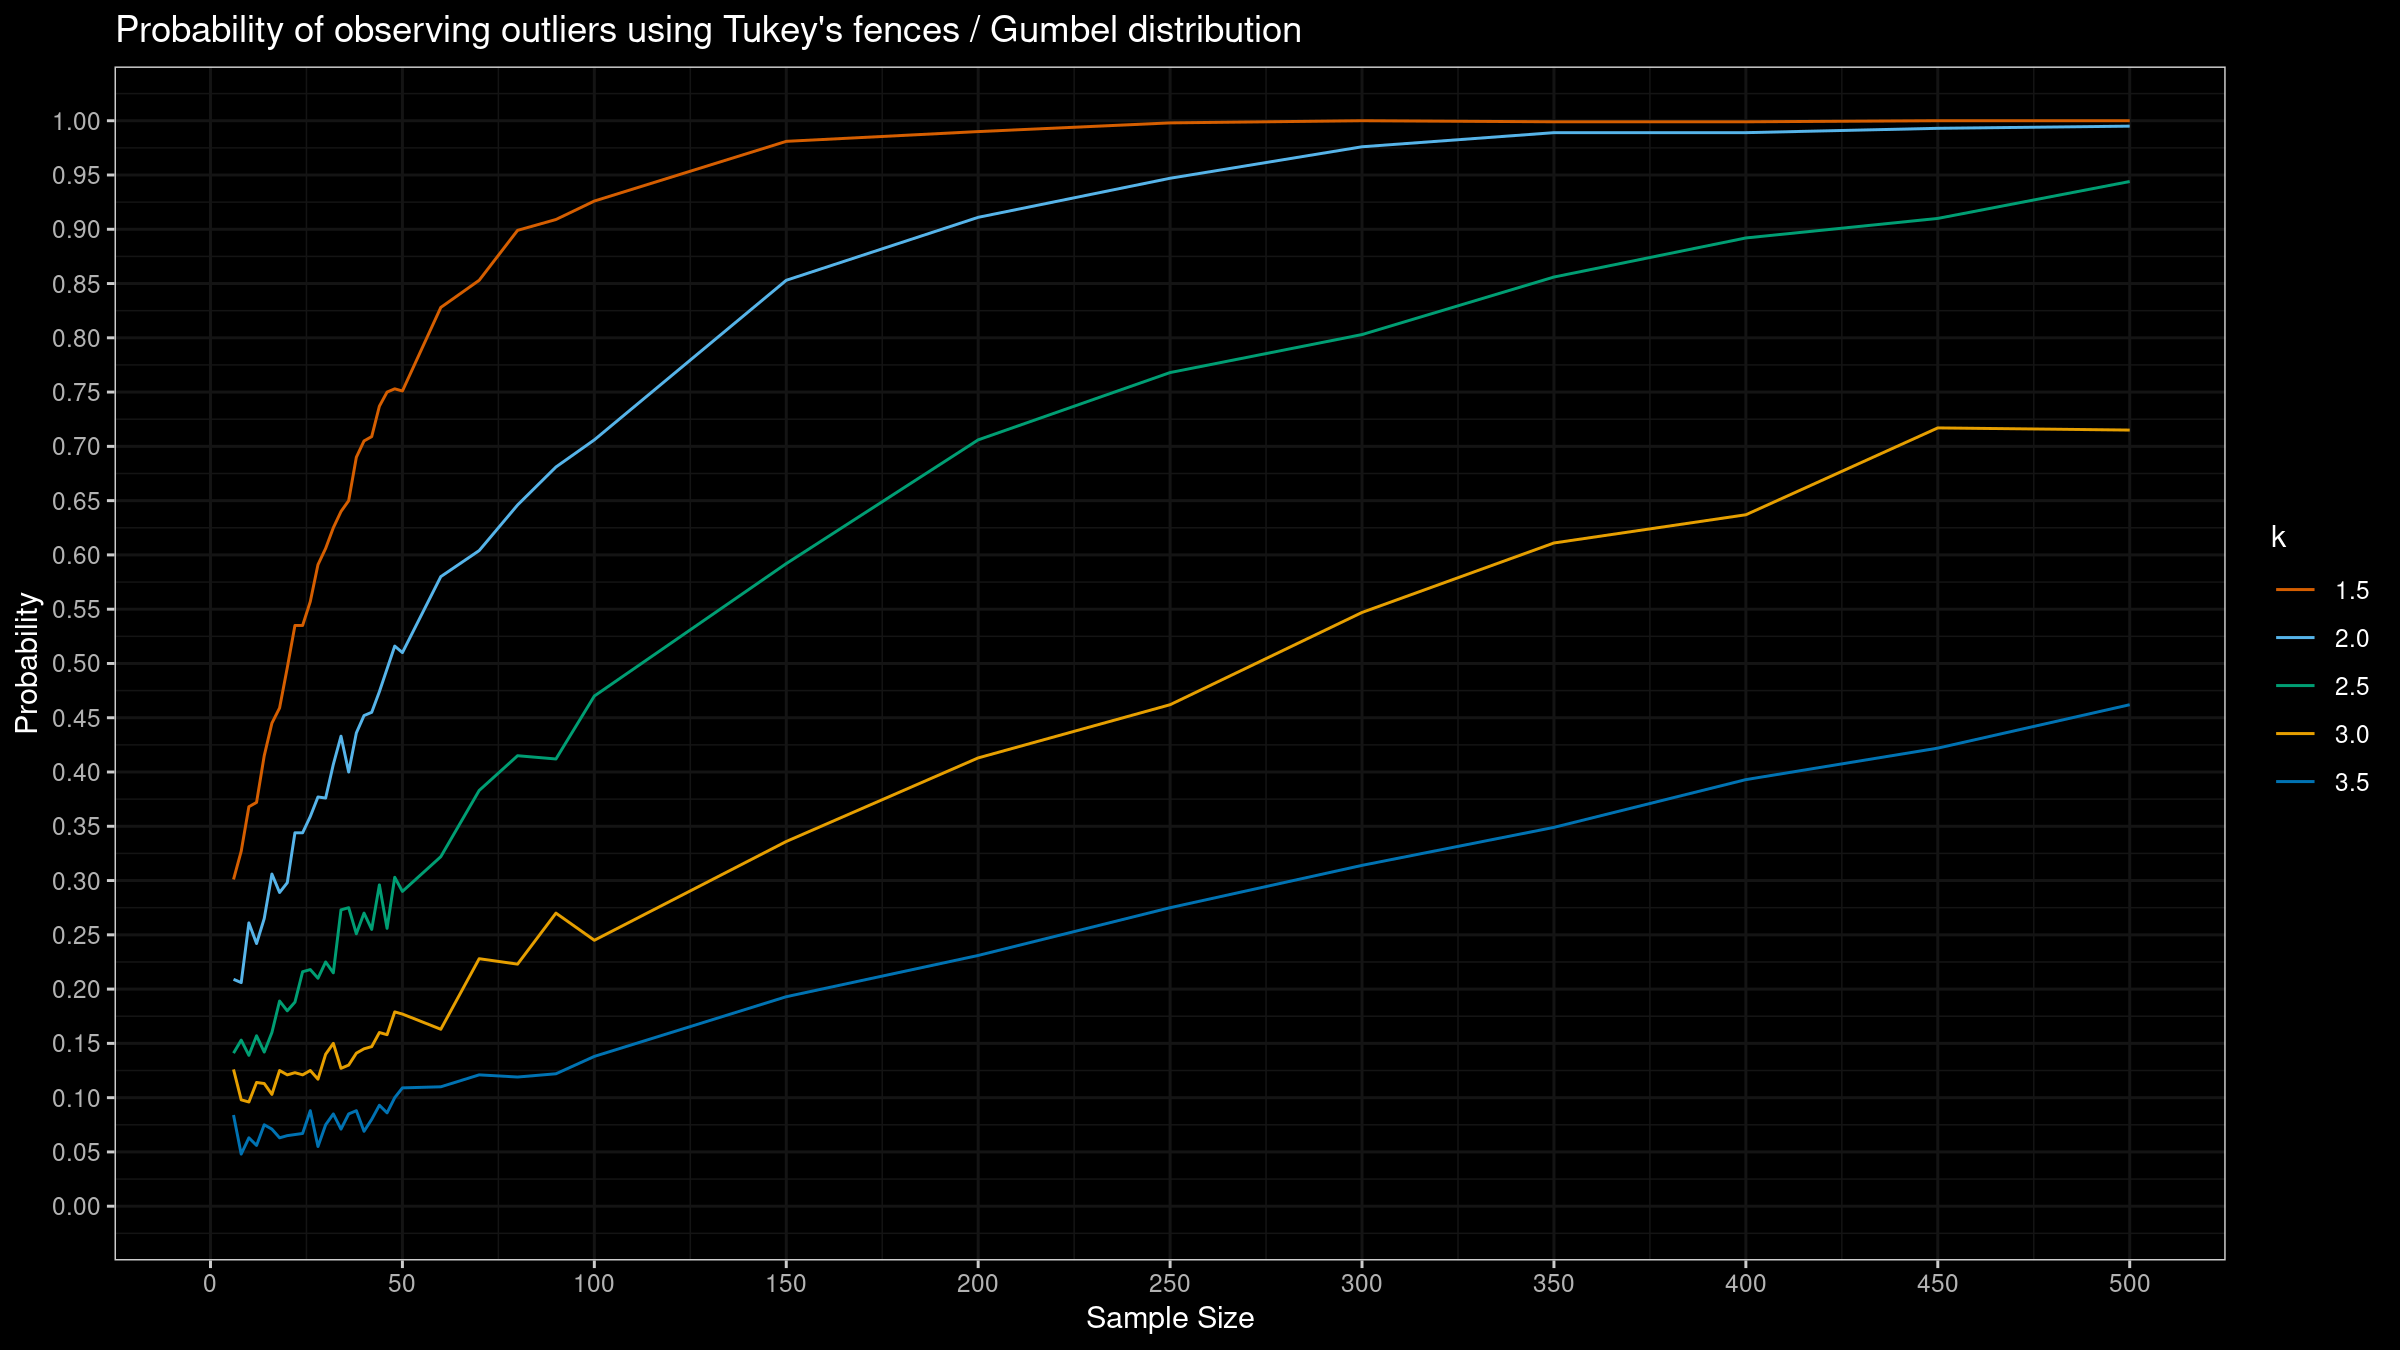
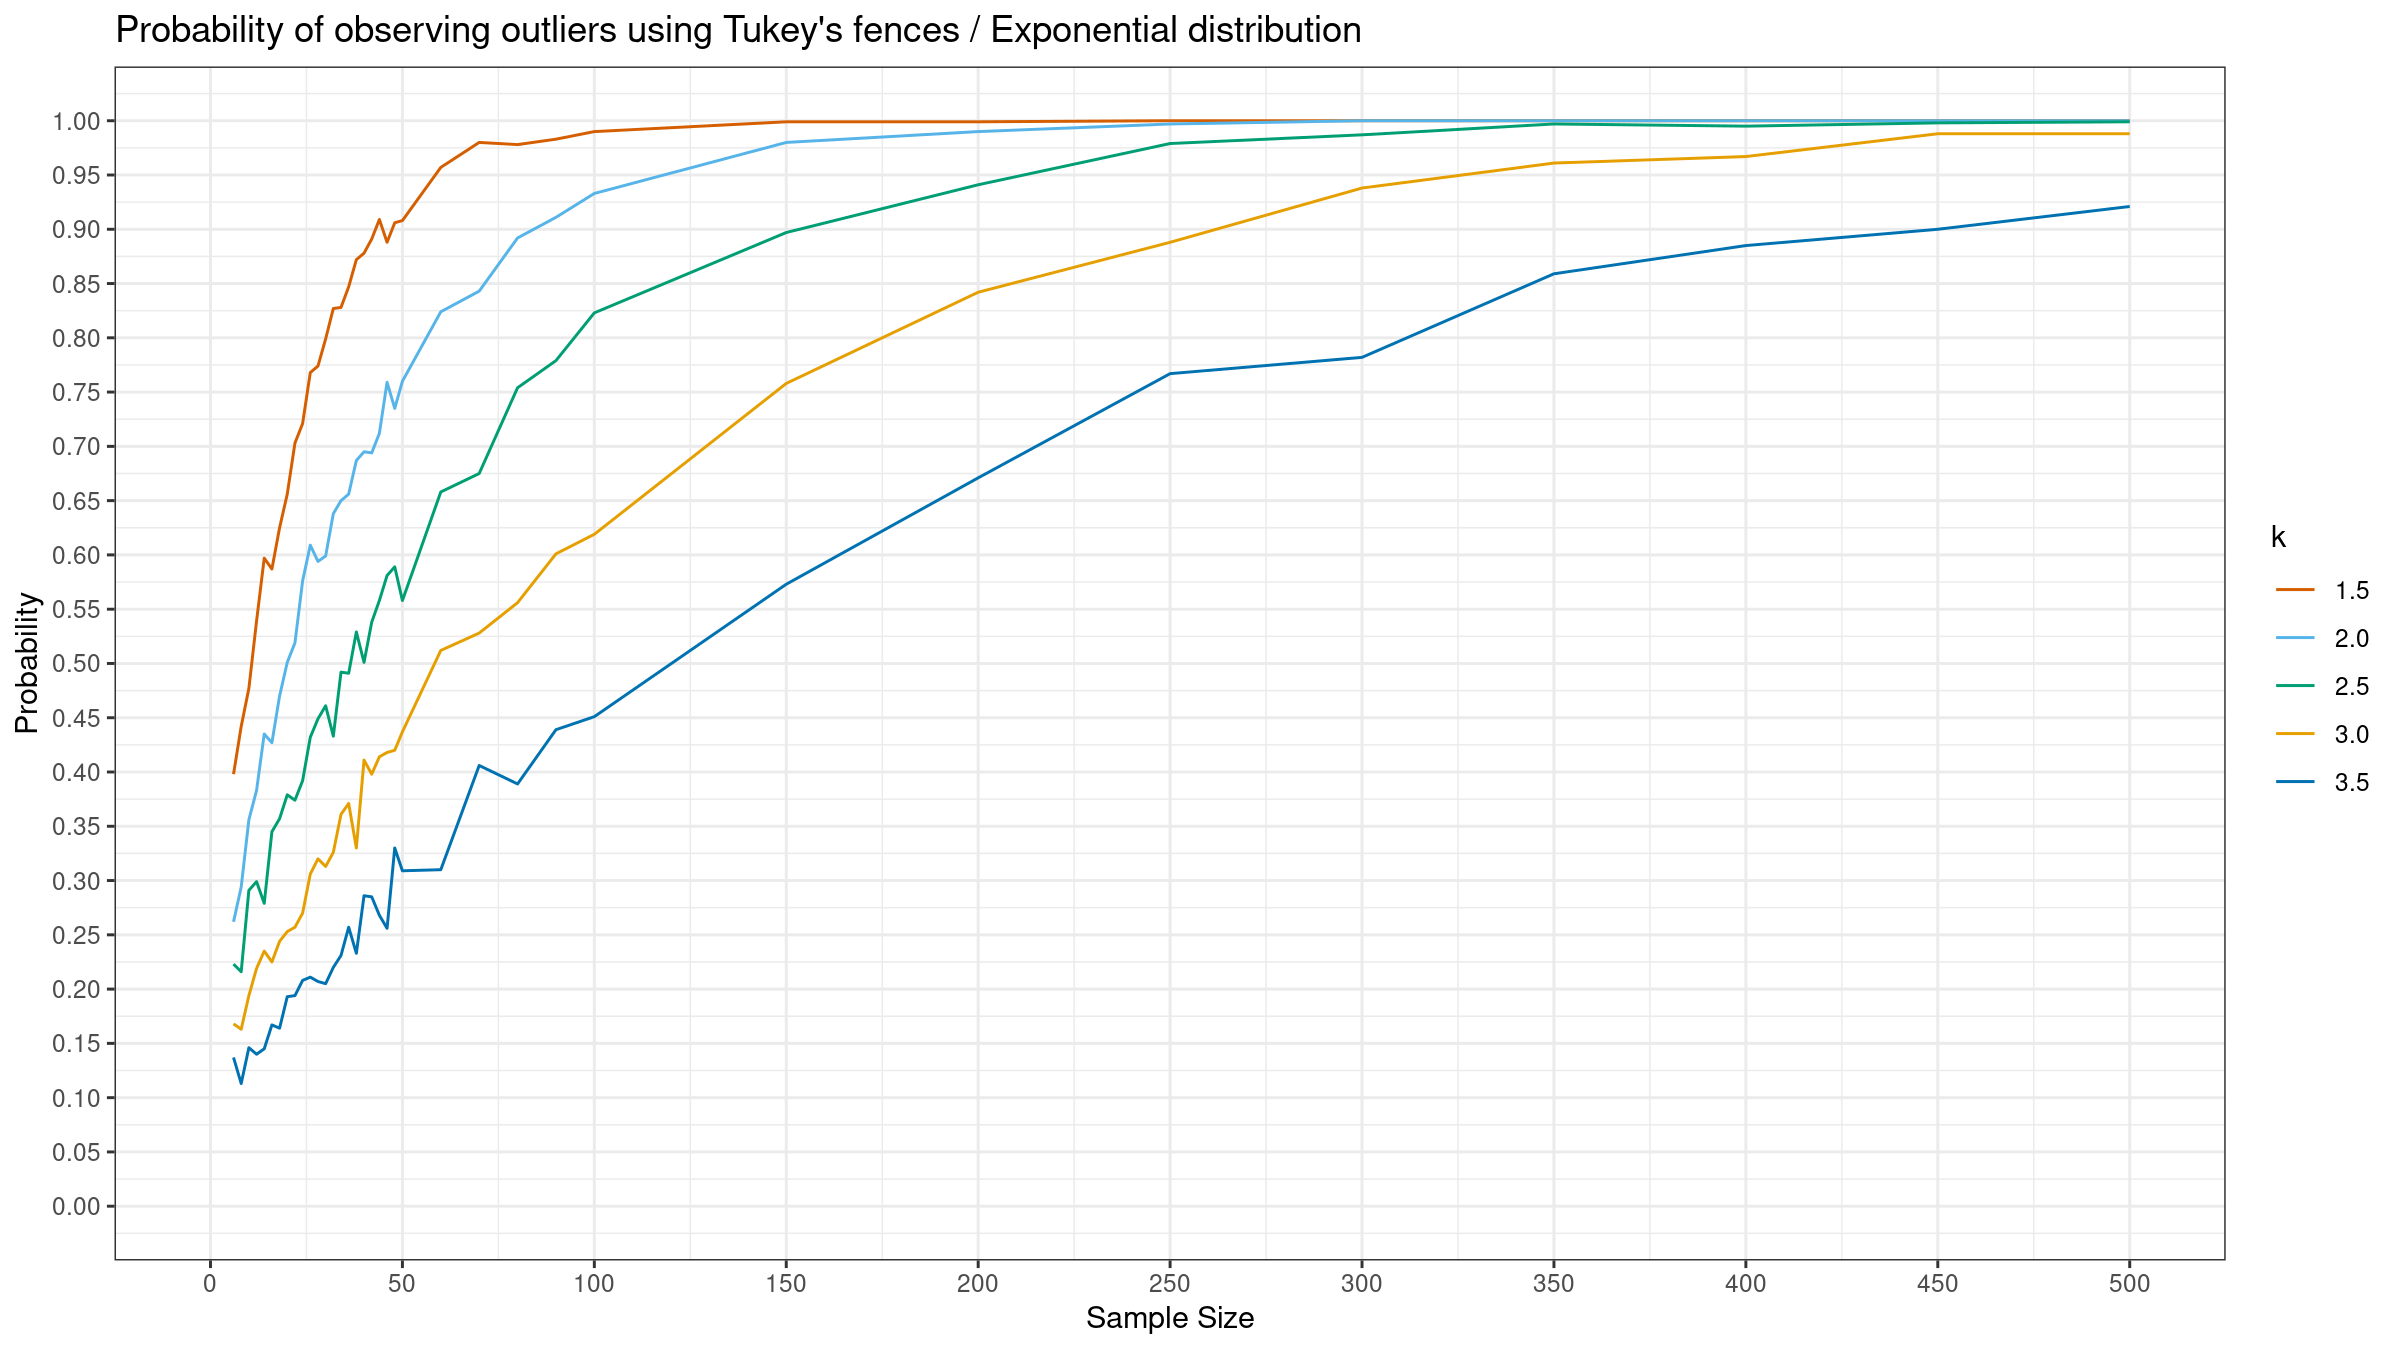
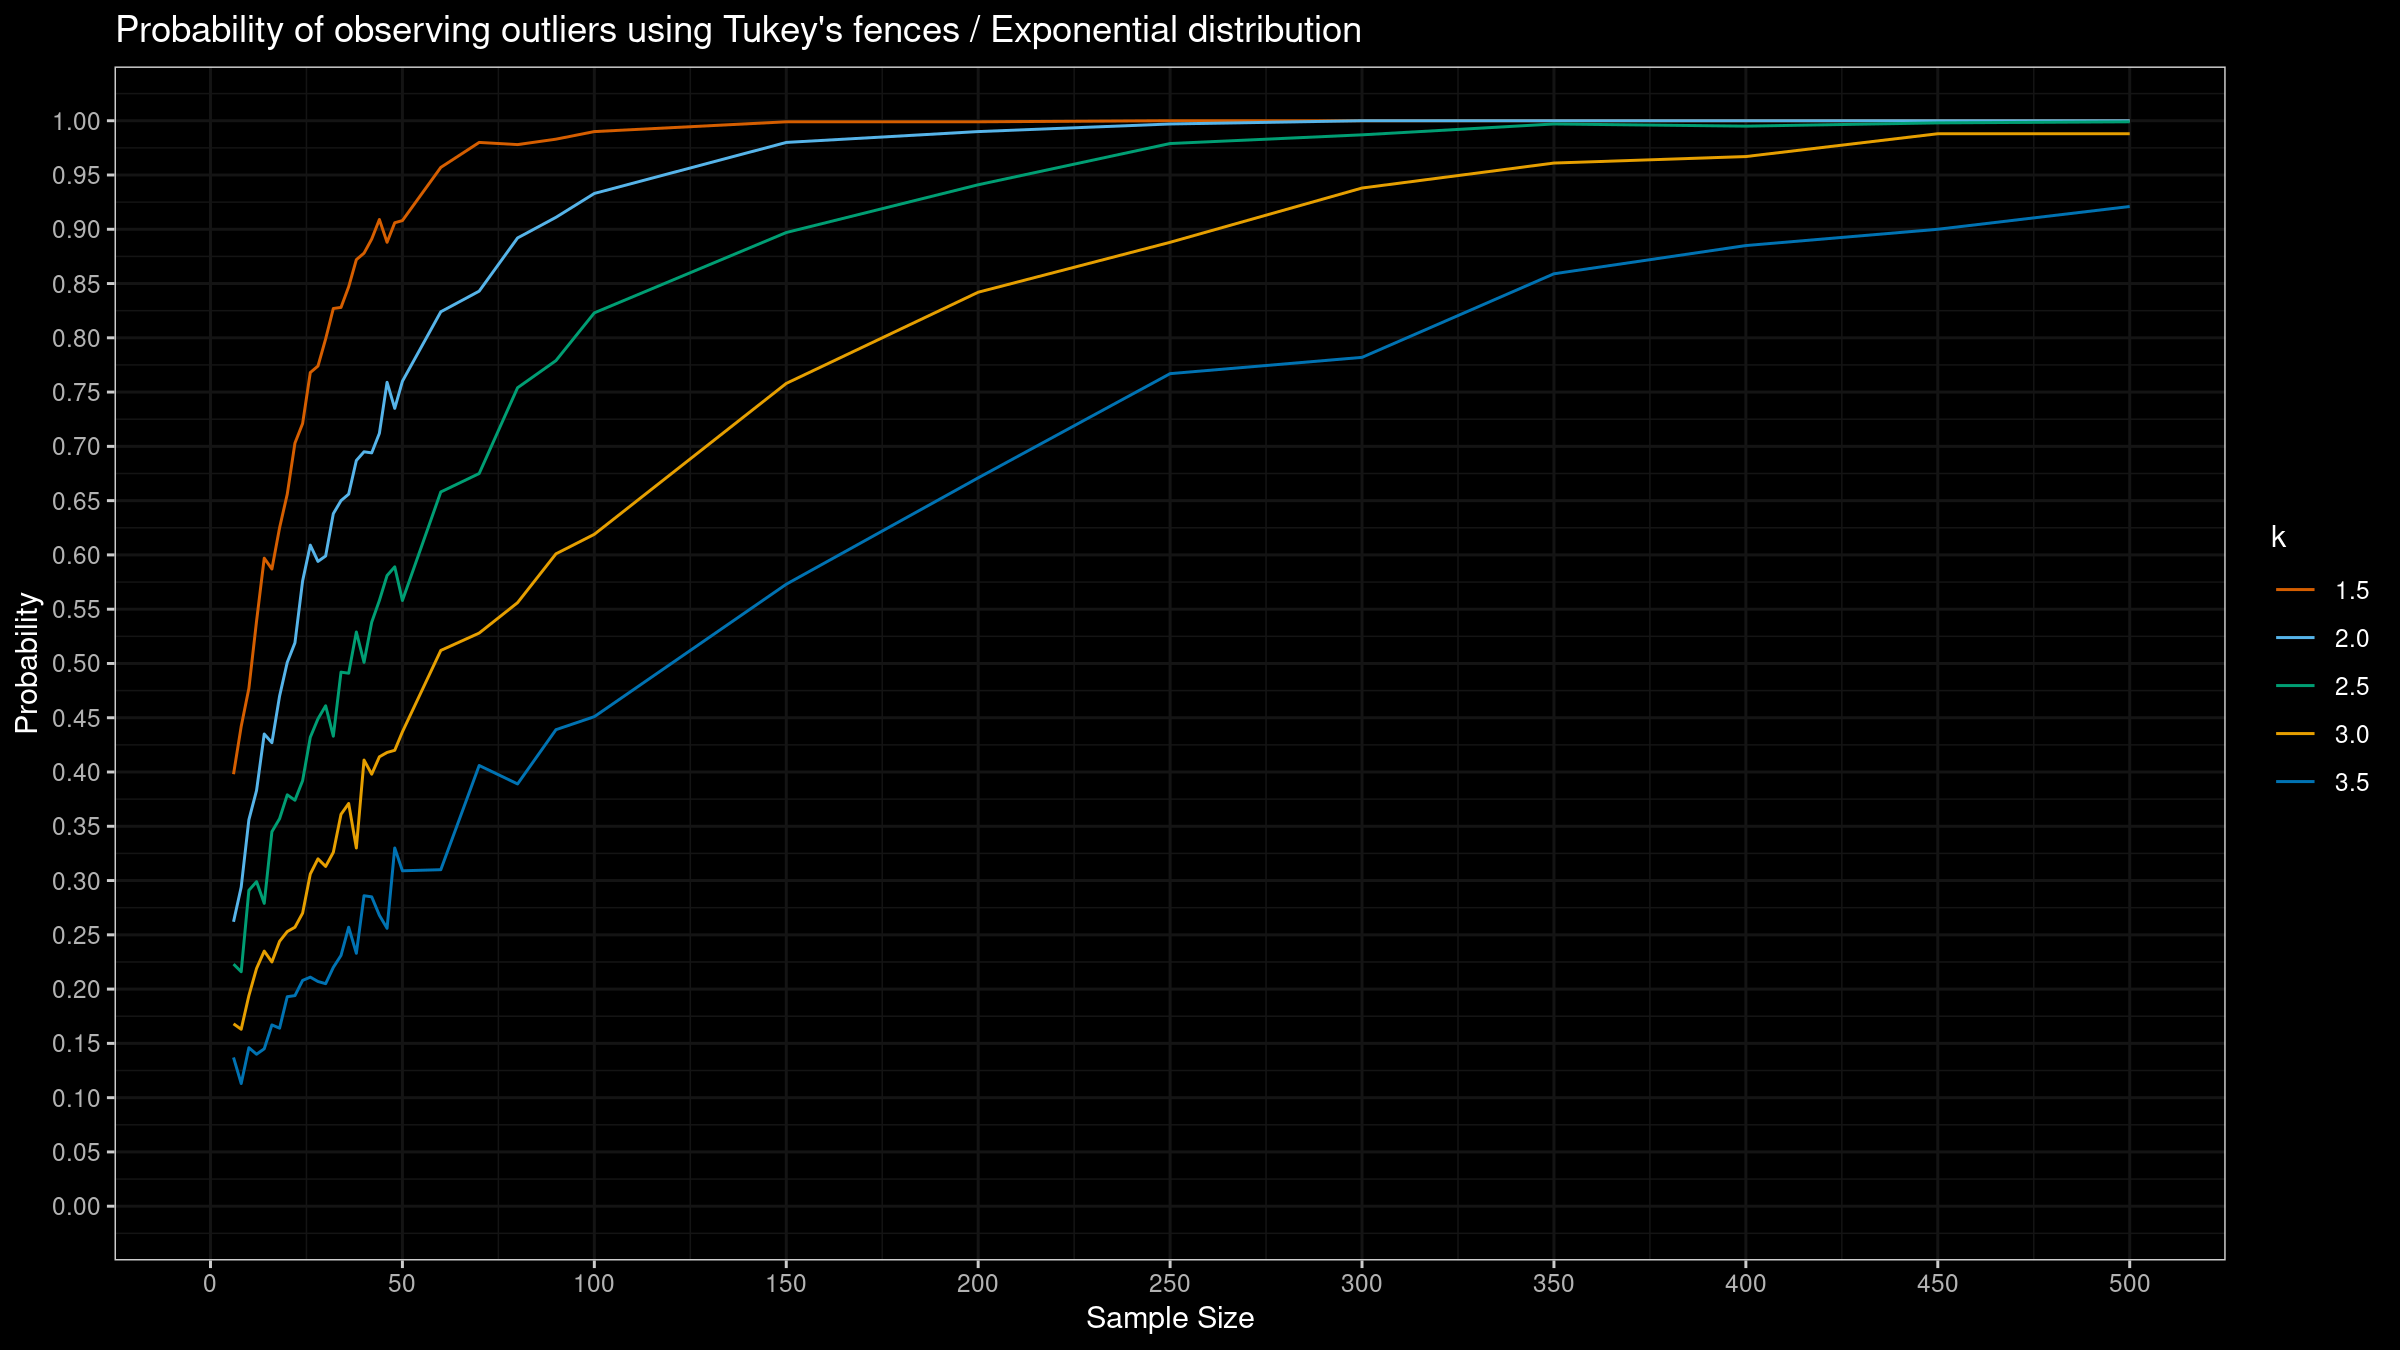
As we can see, the “default” $k=1.5$ provides extremely high detection rate. For huge samples, we detect outliers in almost all the cases regardless of the chosen distribution.
More conservative values give lower detection rate for the normal distribution, but they are still quite high for the Gumbel and the exponential distribution.